Ridgeline (joyplot)
Stack one distribution per group, in order, so a shift in the whole shape reads as movement down the page.
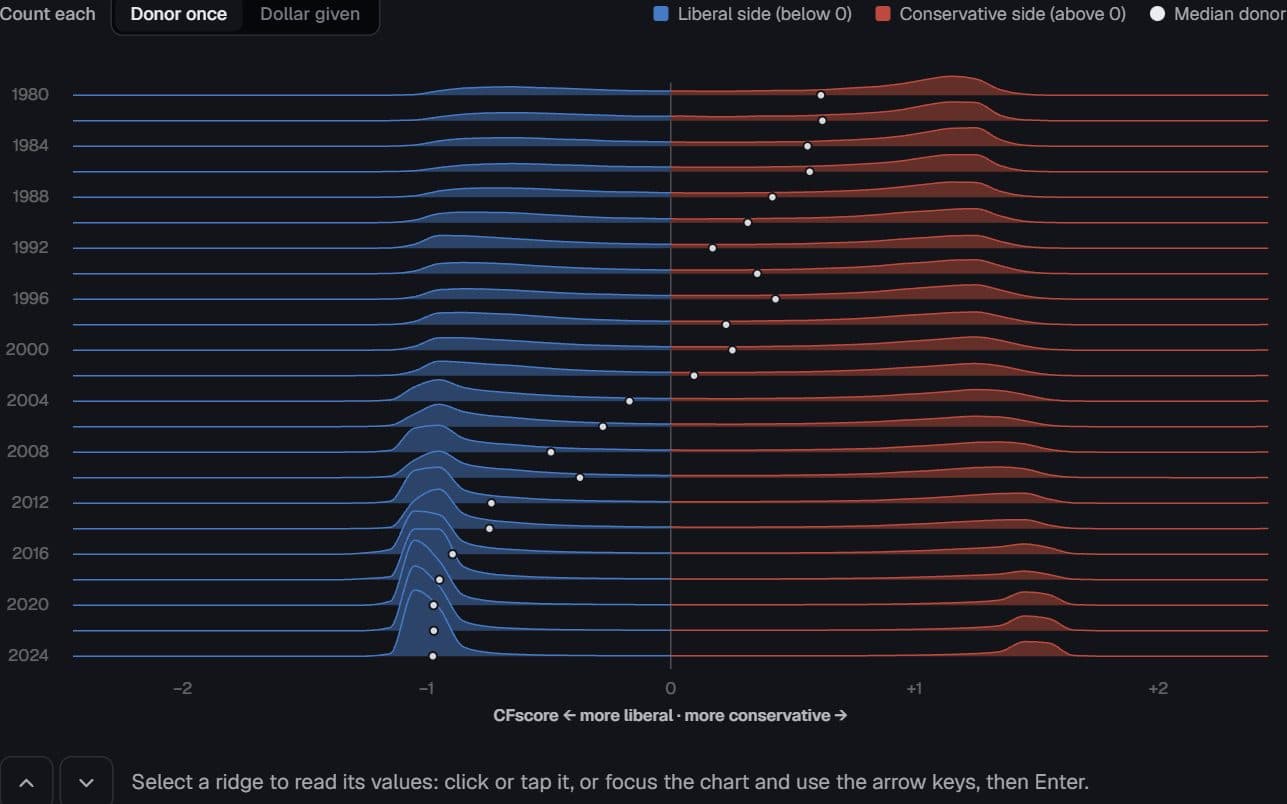
DIME · reliable donors, 1980–2024
Distribution of reliable individual donors on the common-space CFscore ideology scale, one ridge per federal election cycle. Every ridge has area 1 and all share one height scale.
Count each
- Liberal side (below 0)
- Conservative side (above 0)
- Median donor
Select a ridge to read its values: click or tap it, or focus the chart and use the arrow keys, then Enter.
Each ridge is one election cycle’s reliable individual donors on Bonica’s common-space CFscore, in 0.1-wide bins. Every ridge has area 1 and all share one height scale, so a taller peak means a more concentrated cycle, not more donors. A reliable donor gave to at least eight distinct recipients and has an estimated rather than projected score. Scores are fixed per donor, so the slide left after 2004 is a change in who gives and gets itemised — ActBlue-era small-dollar Democrats — not donors moving; the empty centre holds by either count. The dot on each baseline is the median: exact when each donor counts once; read from the bins when dollars are counted (the same method lands within 0.02 of the exact donor median). Dollars are real 2024 dollars (CPI-U).
Ridge summaries · 23 rows
| Cycle | Reliable donor-cycles | Median CFscore, donors | Median CFscore, dollars (binned) | Within ±0.25, donors (%) | Within ±0.25, dollars (%) | Below −0.5 (%) | Above +0.5 (%) |
|---|---|---|---|---|---|---|---|
| 1,980 | 31,138 | 0.62 | 0.57 | 11.8 | 12.3 | 20.1 | 53.2 |
| 1,982 | 25,207 | 0.62 | 0.82 | 12.3 | 9.6 | 19.2 | 53.4 |
| 1,984 | 39,460 | 0.56 | 0.8 | 12 | 10 | 21.7 | 51.5 |
| 1,986 | 45,211 | 0.57 | 0.72 | 13 | 11.1 | 19.6 | 52 |
| 1,988 | 70,902 | 0.42 | 0.58 | 12.7 | 11.1 | 24.1 | 47.8 |
| 1,990 | 111,512 | 0.32 | 0.51 | 11.3 | 11.5 | 28.5 | 45.6 |
| 1,992 | 167,283 | 0.17 | 0.22 | 11 | 10.3 | 32.3 | 42.9 |
| 1,994 | 197,604 | 0.36 | 0.25 | 10.7 | 10.5 | 29 | 46.6 |
| 1,996 | 297,838 | 0.43 | 0.28 | 10.7 | 9.4 | 27.5 | 48.4 |
| 1,998 | 470,028 | 0.23 | 0.14 | 10.1 | 12.3 | 32 | 44.3 |
| 2,000 | 598,971 | 0.25 | 0.39 | 10 | 9.1 | 31.9 | 44.9 |
| 2,002 | 794,413 | 0.1 | 0.18 | 9.6 | 24.5 | 35.3 | 42.5 |
| 2,004 | 1,033,327 | -0.17 | 0.26 | 7.7 | 8.4 | 42.3 | 39.9 |
| 2,006 | 1,142,451 | -0.28 | 0.42 | 7.8 | 7.2 | 44.1 | 37.7 |
| 2,008 | 1,425,885 | -0.49 | -0.15 | 6.2 | 7 | 49.8 | 35.8 |
| 2,010 | 1,409,984 | -0.37 | 0.55 | 6.6 | 7.7 | 46.9 | 38 |
| 2,012 | 1,805,776 | -0.74 | 0.22 | 4.6 | 4.8 | 57 | 32.3 |
| 2,014 | 1,597,010 | -0.74 | 0.42 | 4.8 | 6.6 | 58 | 30.7 |
| 2,016 | 1,978,112 | -0.89 | -0.27 | 3.4 | 4.6 | 64.4 | 27.6 |
| 2,018 | 2,161,252 | -0.95 | -0.6 | 2.5 | 3.5 | 72.8 | 21.2 |
Page 1 of 2
Densities by bin · 1,150 rows
| Cycle | CFscore bin centre | Density, donors | Density, dollars |
|---|---|---|---|
| 1,980 | -2.45 | 0 | 0 |
| 1,980 | -2.35 | 0 | 0 |
| 1,980 | -2.25 | 0 | 0 |
| 1,980 | -2.15 | 0 | 0 |
| 1,980 | -2.05 | 0 | 0 |
| 1,980 | -1.95 | 0 | 0 |
| 1,980 | -1.85 | 0 | 0 |
| 1,980 | -1.75 | 0 | 0 |
| 1,980 | -1.65 | 0 | 0 |
| 1,980 | -1.55 | 0 | 0 |
| 1,980 | -1.45 | 0 | 0 |
| 1,980 | -1.35 | 0 | 0 |
| 1,980 | -1.25 | 0 | 0 |
| 1,980 | -1.15 | 0 | 0 |
| 1,980 | -1.05 | 0.04 | 0.02 |
| 1,980 | -0.95 | 0.24 | 0.16 |
| 1,980 | -0.85 | 0.39 | 0.4 |
| 1,980 | -0.75 | 0.45 | 0.48 |
| 1,980 | -0.65 | 0.47 | 0.5 |
| 1,980 | -0.55 | 0.42 | 0.45 |
Page 1 of 58
Stanford DIME v4.0 (Bonica) · reliable individual donors, federal cycles 1980–2024
Preview
How to read it
Each ridge is one group’s distribution on a shared axis, rising from its own baseline, with later groups in front. Compare where the mass sits and how the shape changes rather than exact heights. A split fill marks the two sides of a meaningful value; the dot on each baseline is a supplied summary such as the median.
When to use it
Distributions over time or across ordered groups: donor ideology by election cycle, a feeling thermometer by survey wave, county vote margins by election.
Watch out for
Avoid unordered categories (use small multiples) and groups too small to have a shape. Per-ridge peak scaling hides size differences, so it is never the default. Do not smooth coarse bands into a curve.
Data shape & units
rows: { group, x, value }[] plus an ordered groups list; value is a density, share or count per bin. normalize is none (one height scale, the default), sum (counts to shares) or max. Optional markers { group, value, label?, display?, lo?, hi? } and per-group counts and facts for the tooltip and status line.
Missing values
A null value is a gap in the ridge, never a zero, and a threshold seam does not close across it. A group with no rows keeps its slot and reads as having no data. Marker intervals appear only when both bounds are supplied.
Controls & accessibility
Hover or keyboard focus outlines a ridge and names its group, n and marker. Click, tap or Enter selects it: the others recede, it comes to the front and the status line reads its values. Arrow keys on the chart and the step buttons move ridge by ridge; activating the selection again, or Clear, releases it.
Use the component
Install from the CTZN registry, then pass your prepared rows. Examples below illustrate the component contract.
npx shadcn add @ctzn-viz/ridgeline-stack<RidgelineStack rows={rows} groups={cycles}
threshold={0} thresholdColors={[liberal, conservative]}
markers={medians} counts={donors} overlap={2.6} rowHeight={17}
xLabel="CFscore" ariaLabel="Donor ideology by cycle" />Examples using this form
US federal donors · Stanford DIME, 1980–2024
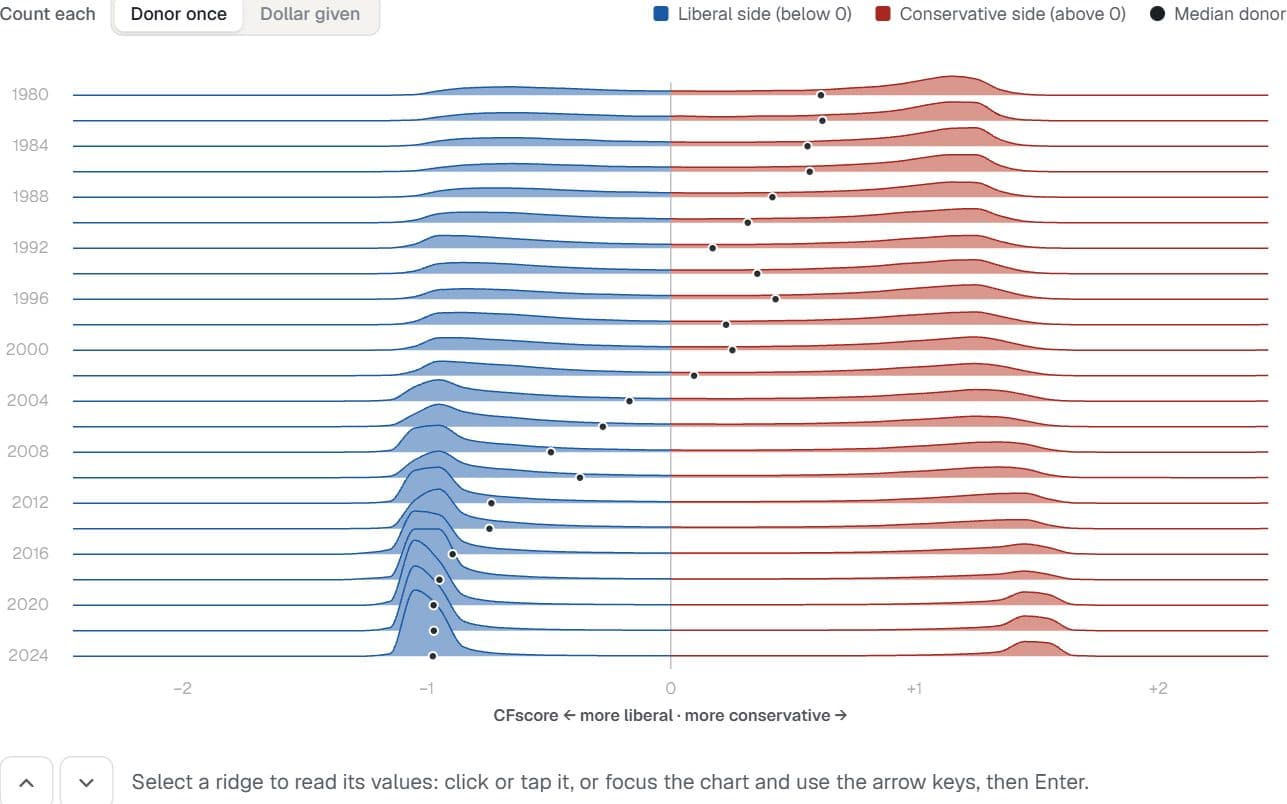
The donor centre emptied first
Where do reliable campaign donors sit on the left–right scale in each election cycle, and did the middle empty out?
Hides: Donors changing their minds. Each donor’s score is fixed; the ridges show who was giving each cycle.
Try it: Switch donor weighting
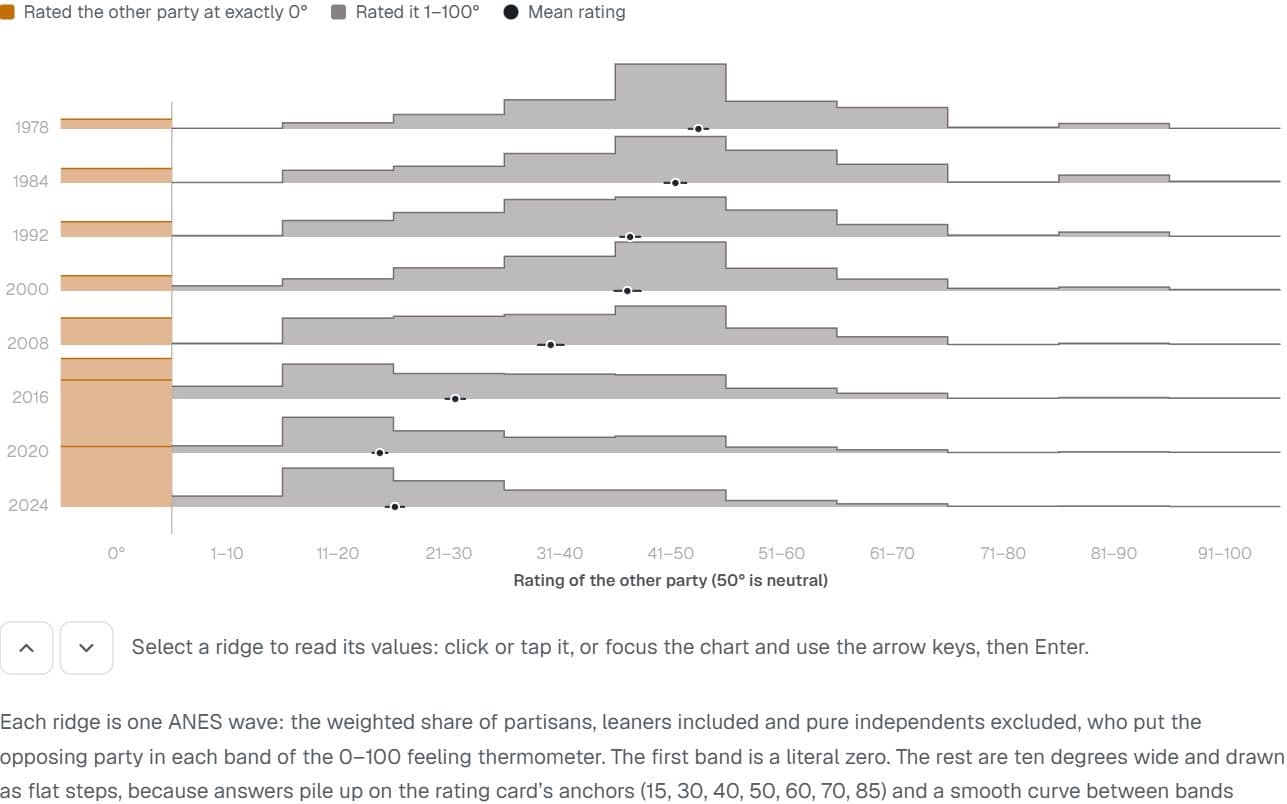
US partisans · American National Election Studies, 1978–2024
The cold mass at zero
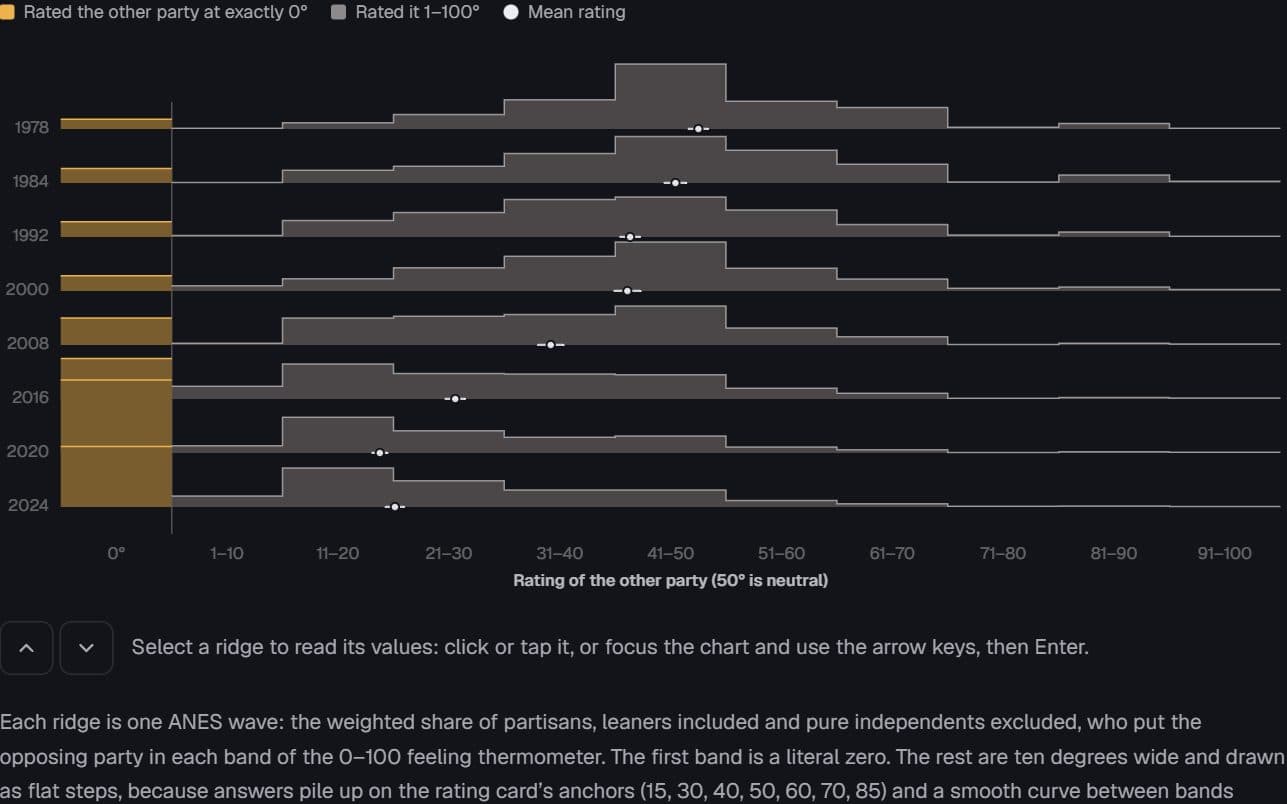
How warmly do partisans feel about the other party, and how many now give it a literal zero?
Hides: How much is survey mode. Recent waves were mostly online, and online answers give more zeros.
Try it: Eight survey waves
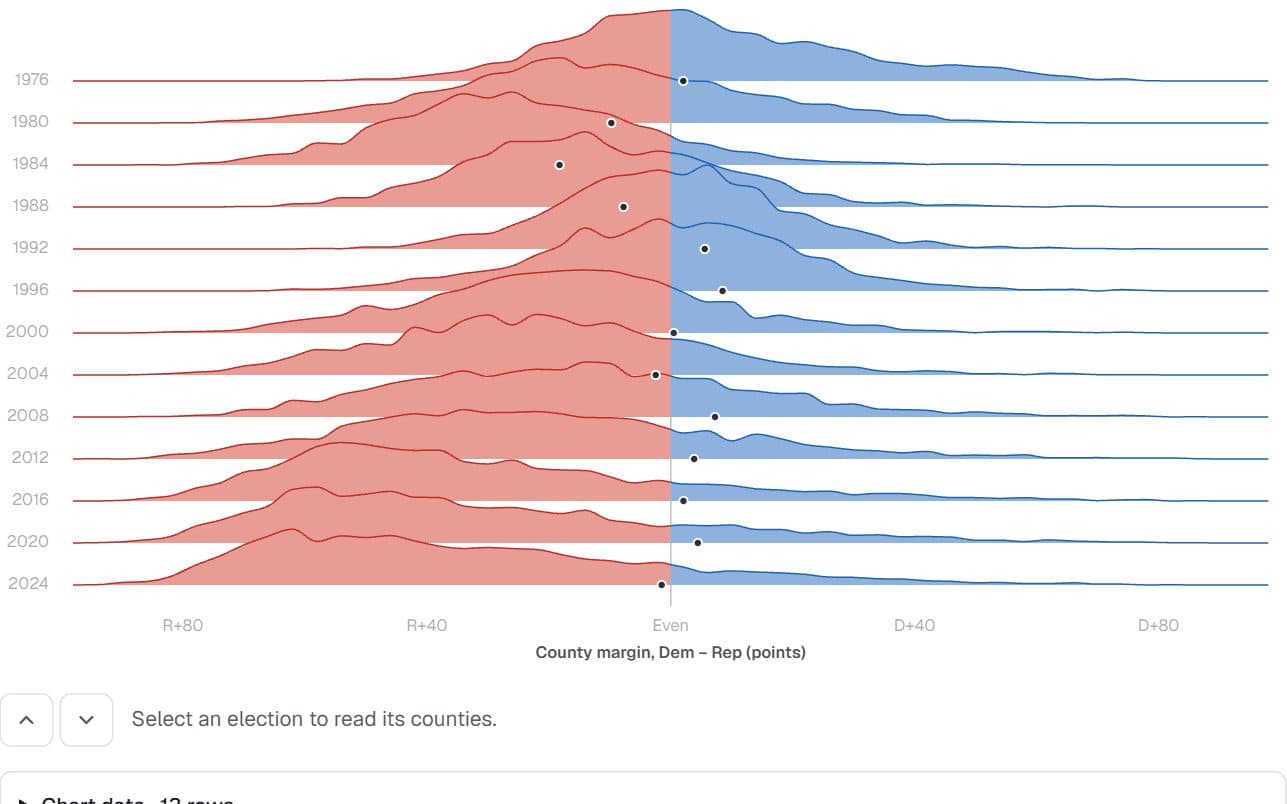
US counties · presidential returns, 1976–2024
Counties sorted into landslides
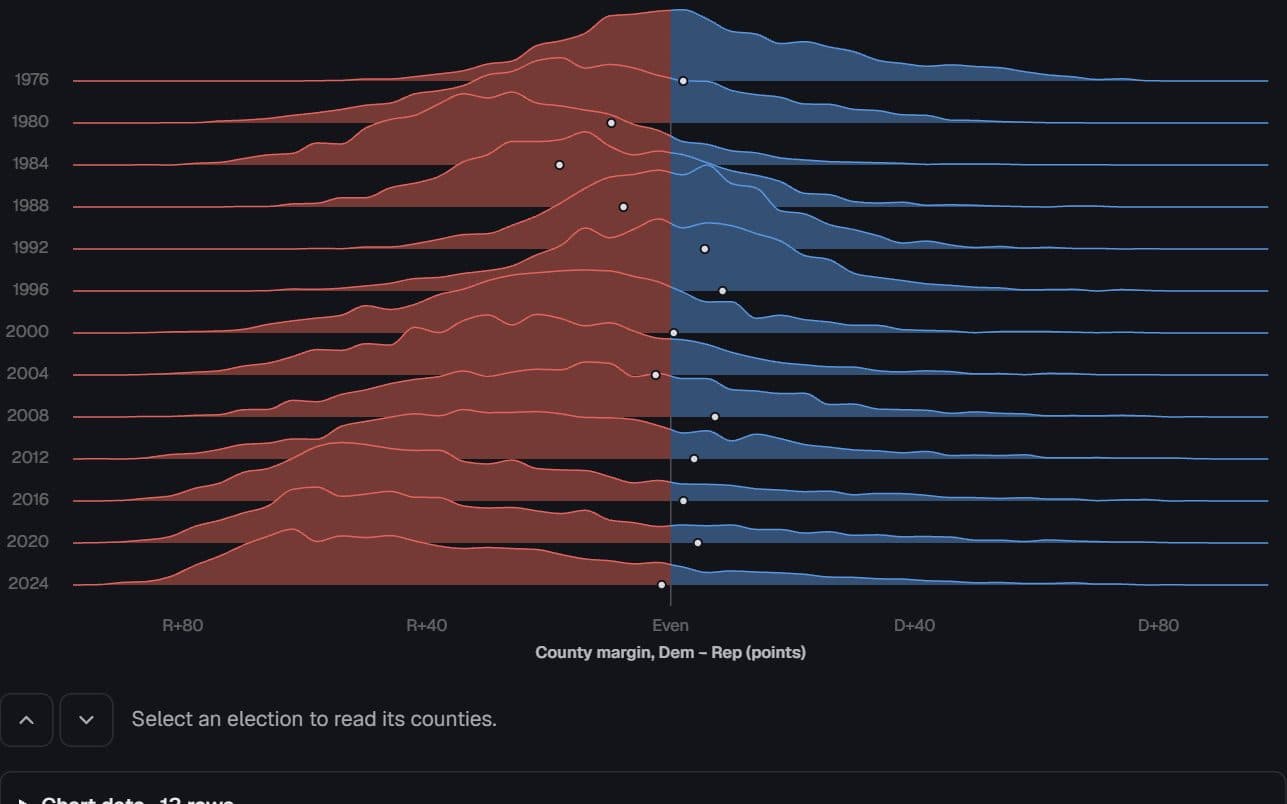
Between 1976 and 2024, did counties drift apart gradually or sort into landslides — and how far did the county map part from the national vote?
Hides: Population. Every county counts once, so the ridges describe the map rather than the vote.
Try it: Thirteen elections