Difference lines
Show two series and the gap between them, repeated across groups on one scale.
CES · presidential years, 2008–2024
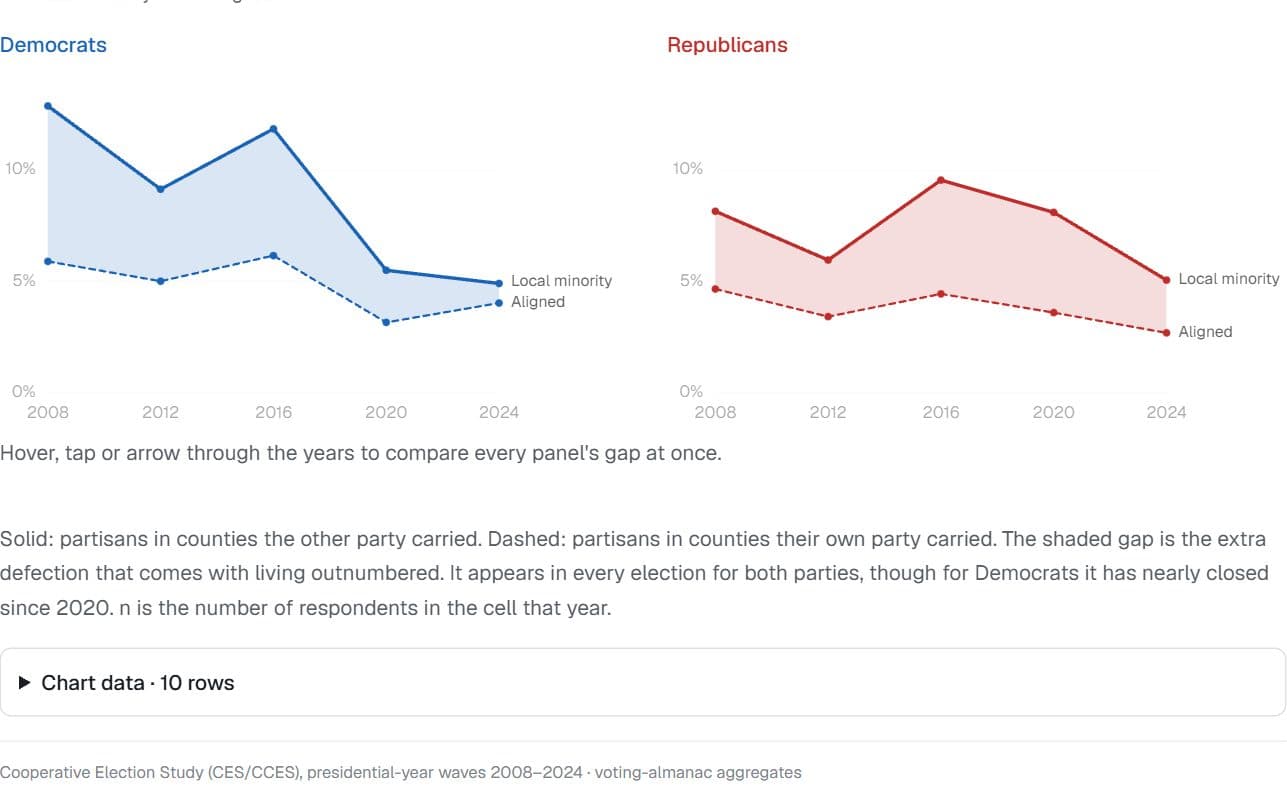
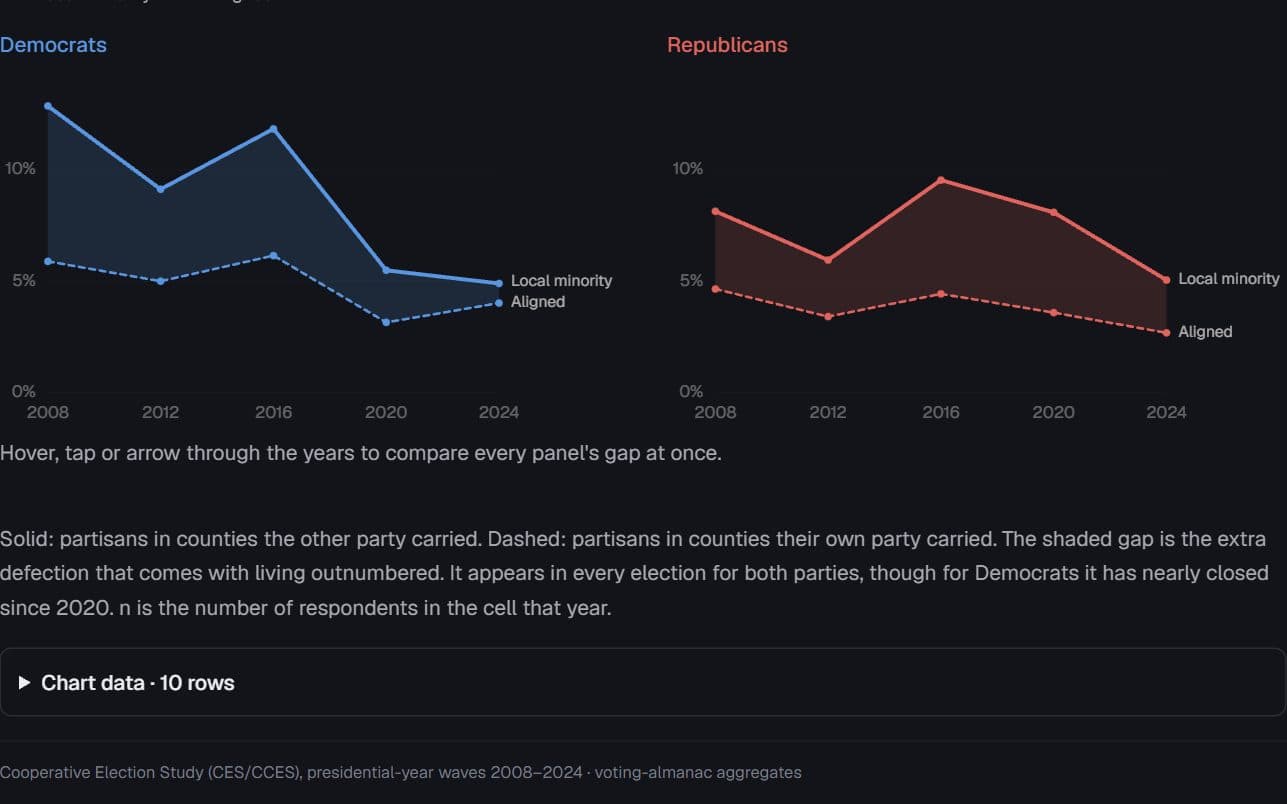
Each party’s local minority against its aligned partisans, one panel per party on one scale. The gap is the cost of living outnumbered — there in every election for both parties.
- Local minority
- Aligned
Democrats
Republicans
Hover, tap or arrow through the years to compare every panel's gap at once.
Solid: partisans in counties the other party carried. Dashed: partisans in counties their own party carried. The shaded gap is the extra defection that comes with living outnumbered. It appears in every election for both parties, though for Democrats it has nearly closed since 2020. n is the number of respondents in the cell that year.
Chart data · 10 rows
| Party | Year | Local minority (%) | Local minority n | Aligned (%) | Aligned n | Gap (pp) |
|---|---|---|---|---|---|---|
| Democrats | 2,008 | 12.9 | 2,860 | 5.9 | 5,736 | 7 |
| Democrats | 2,012 | 9.1 | 4,805 | 5 | 9,075 | 4.1 |
| Democrats | 2,016 | 11.9 | 5,973 | 6.2 | 11,024 | 5.7 |
| Democrats | 2,020 | 5.5 | 5,714 | 3.2 | 12,469 | 2.3 |
| Democrats | 2,024 | 4.9 | 6,918 | 4 | 9,984 | 0.9 |
| Republicans | 2,008 | 8.2 | 4,109 | 4.7 | 4,277 | 3.5 |
| Republicans | 2,012 | 6 | 5,134 | 3.4 | 6,465 | 2.5 |
| Republicans | 2,016 | 9.6 | 4,652 | 4.4 | 6,469 | 5.1 |
| Republicans | 2,020 | 8.1 | 5,307 | 3.6 | 6,657 | 4.5 |
| Republicans | 2,024 | 5.1 | 4,197 | 2.7 | 8,316 | 2.4 |
Page 1 of 1
Cooperative Election Study (CES/CCES), presidential-year waves 2008–2024 · voting-almanac aggregates
Preview
How to read it
The solid line is the series the claim is about, the dashed line its comparison, and the fill is the gap — tinted where the primary is higher, neutral where it dips below. Panels share one y axis and one cursor.
When to use it
Claims of the form “A stays above B”, over time and across groups: a local minority against aligned partisans, a treated group against its comparison.
Watch out for
A gap between two estimates is not a test of their difference. Keep the panels on one y domain; independent scales make small gaps look large.
Data shape & units
panels: { key, label, color, rows: { x, primary, comparison, primaryN?, comparisonN? }[] }[], with primaryLabel and comparisonLabel naming the two lines.
Missing values
A row missing either value is dropped from its panel, breaking the fill rather than inventing a gap.
Controls & accessibility
Hover, tap or arrow through the years: every panel’s crosshair follows, and the status line prints each panel’s gap.
Use the component
Install from the CTZN registry, then pass your prepared rows. Examples below illustrate the component contract.
npx shadcn add @ctzn-viz/difference-lines<DifferenceLines panels={panels}
primaryLabel="Local minority" comparisonLabel="Aligned"
formatValue={{ kind: "rate", digits: 1 }}
ariaLabel="Crossover by party and county alignment" />