Public data, drawn so you can check the claim
Figures on American elections, campaign money, public opinion, health and housing, with a few from Europe. Each makes one claim and gives you the control that would break it: move the date of a break, change how donors are weighted, or select counties on a scatter and find them on the map.
The site has two aims: to show data on subjects we want to understand, and to build reusable TypeScript chart components that other projects can install. Every figure here is drawn with them.
By Vishal Singh and Uma Huggins
Featured · Health
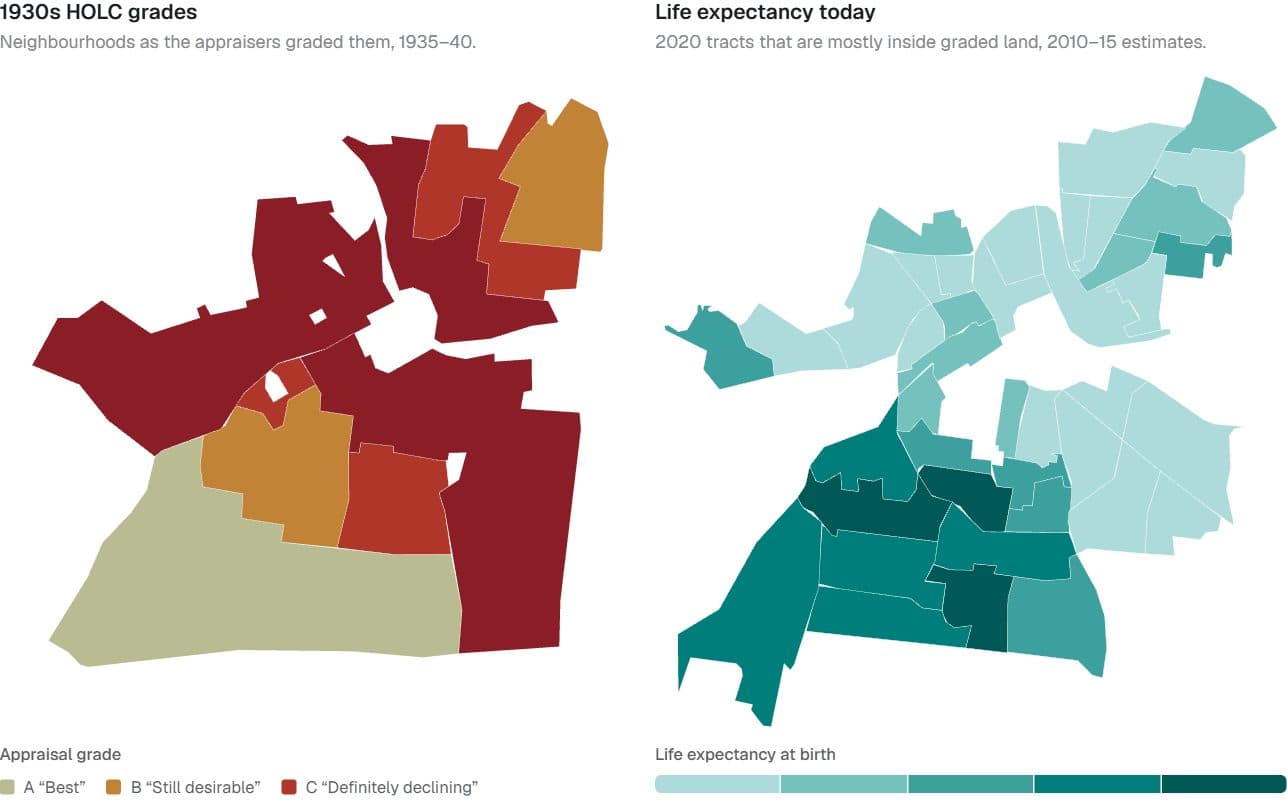
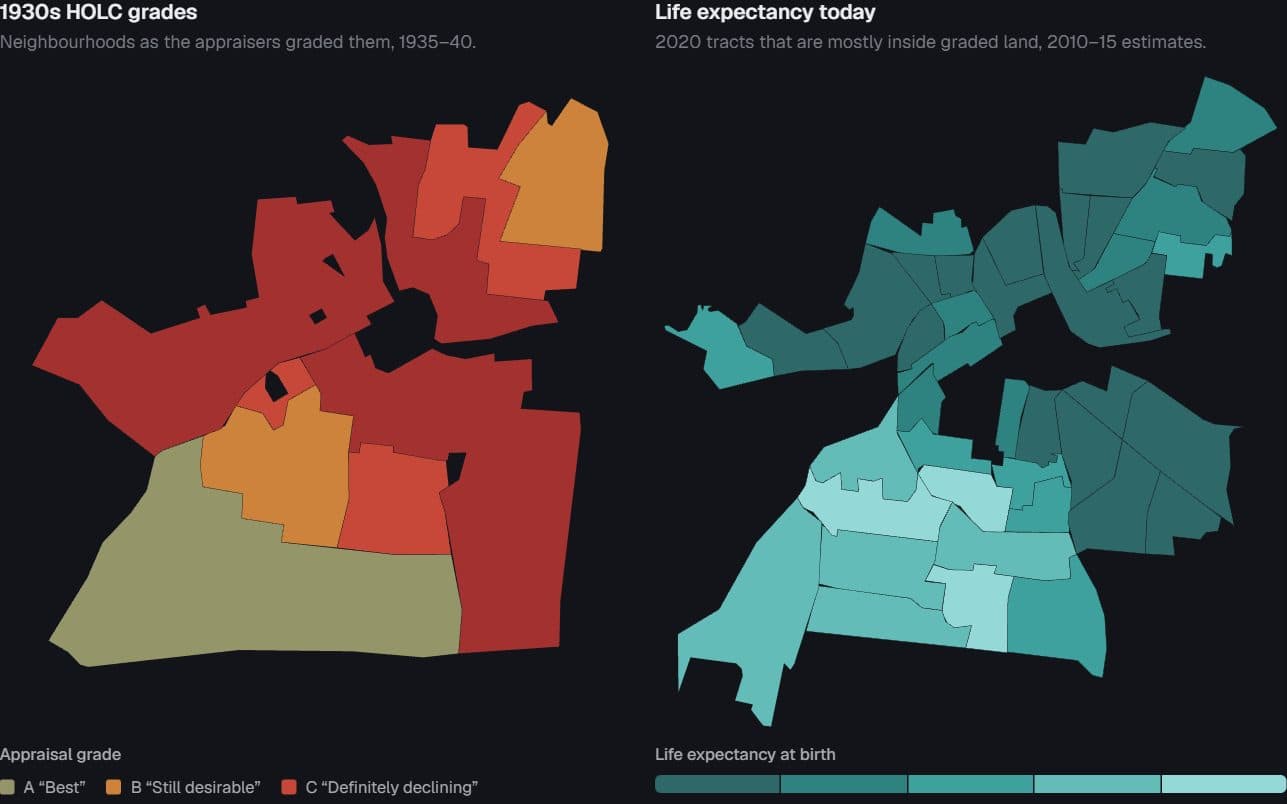
US cities · 1930s redlining maps and NCHS tract life expectancy, 2010–15
Redlined then, shorter lives now
Do neighbourhoods the 1930s appraisers graded “hazardous” still live shorter lives?
Hides: Cause. Appraisers drew red lines around neighbourhoods that were already poorer and more often Black.
Try it: Switch cities · Point at a place on either map
Open the figure
Findings
Each picture is a capture of the live figure. Under it: the place, the dataset and the years, and the one thing the figure cannot tell you. The full caveats are on the figure’s page.
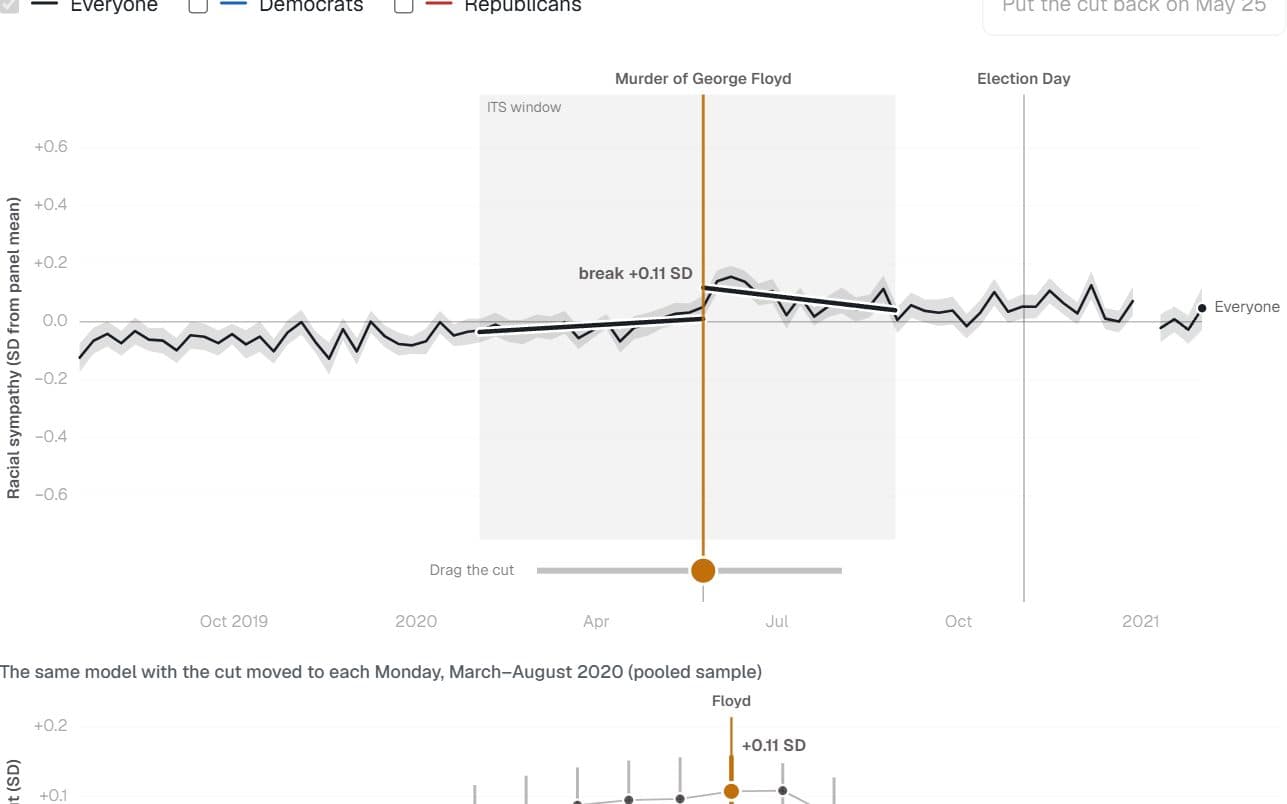
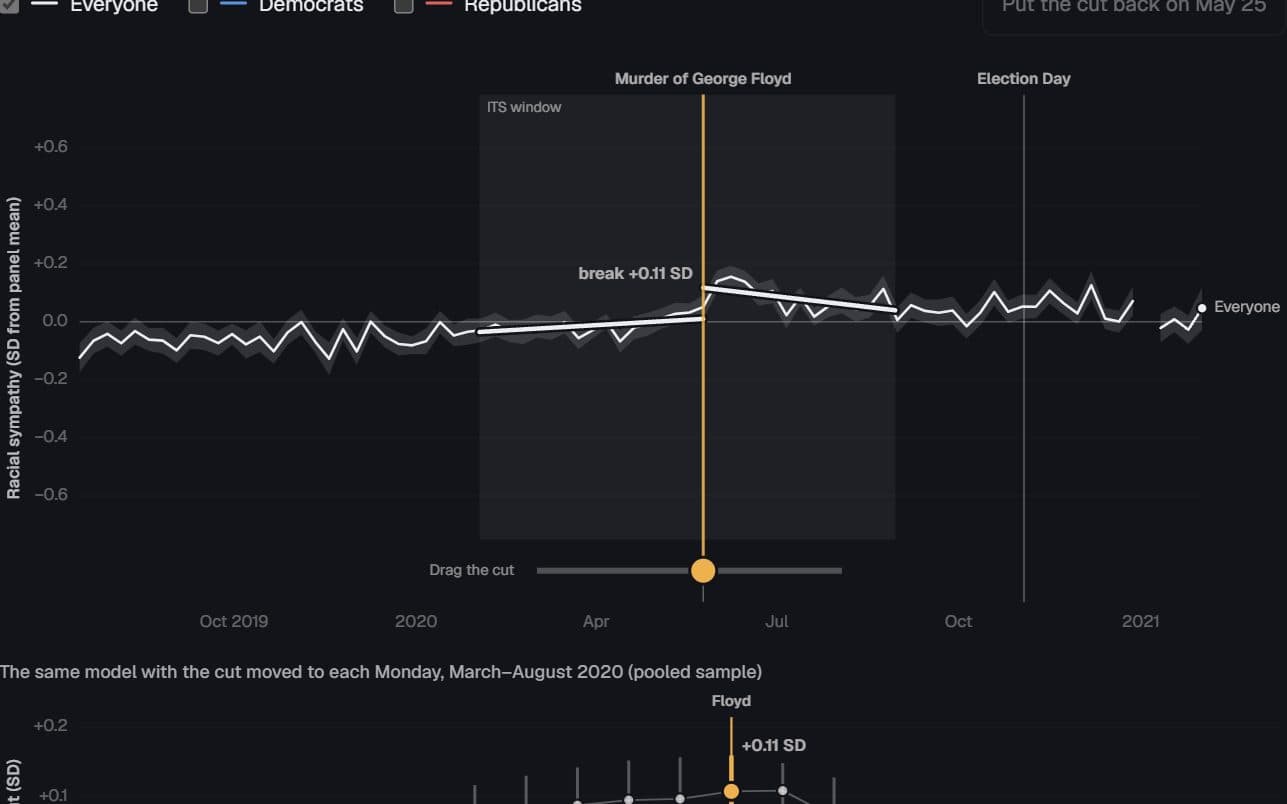
US adults · Nationscape weekly survey, 2019–2021
Sympathy broke the week of the murder
Did racial sympathy really jump when George Floyd was killed, or would a break appear wherever the cut was placed?
Hides: What caused the break. The model dates it to the week but cannot separate the video, the protests and elite cues.
Try it: Drag the cut to any week
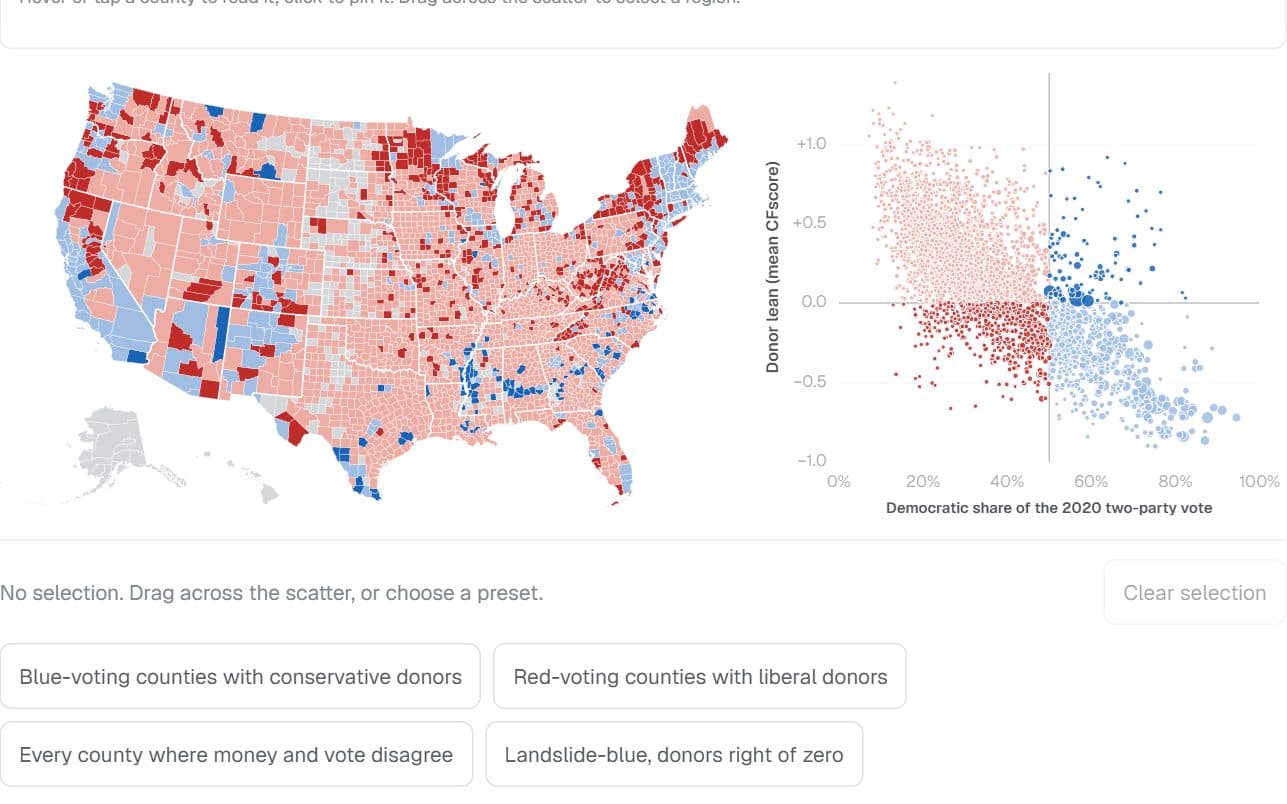
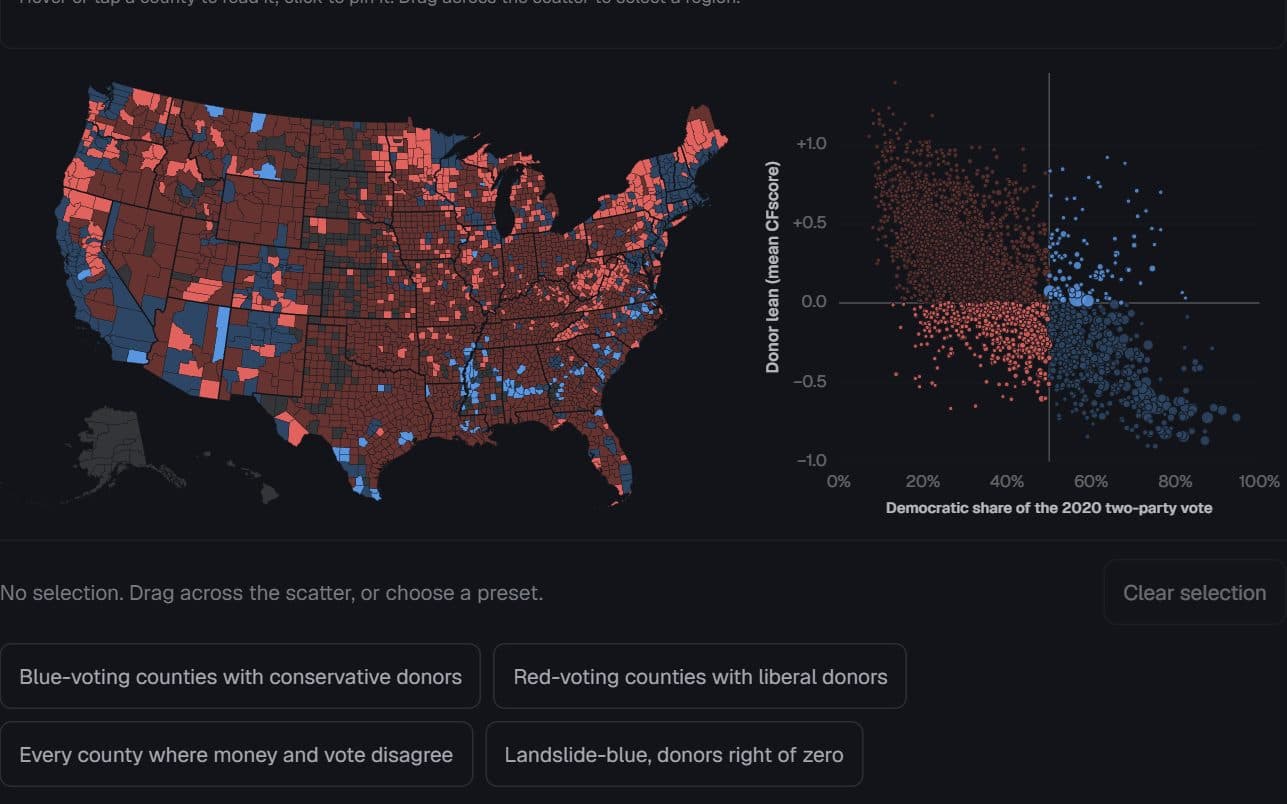
2,839 US counties · Stanford DIME donors and 2020 presidential returns
Where the money and the vote disagree
Which counties vote one way while their reliable donors lean the other — and who lives there?
Hides: Individuals. A county’s donor average says nothing about any one resident, and the national donor pool leans left.
Try it: Select counties on the scatter
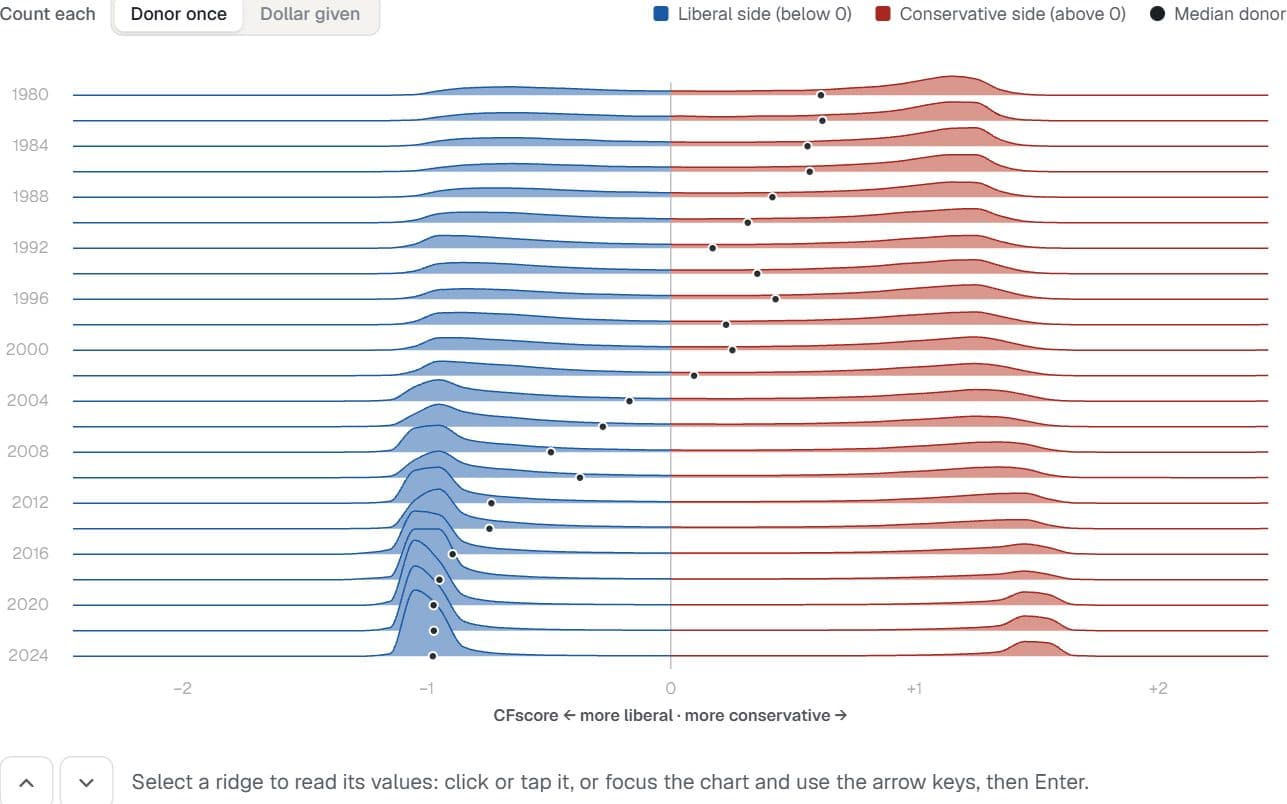
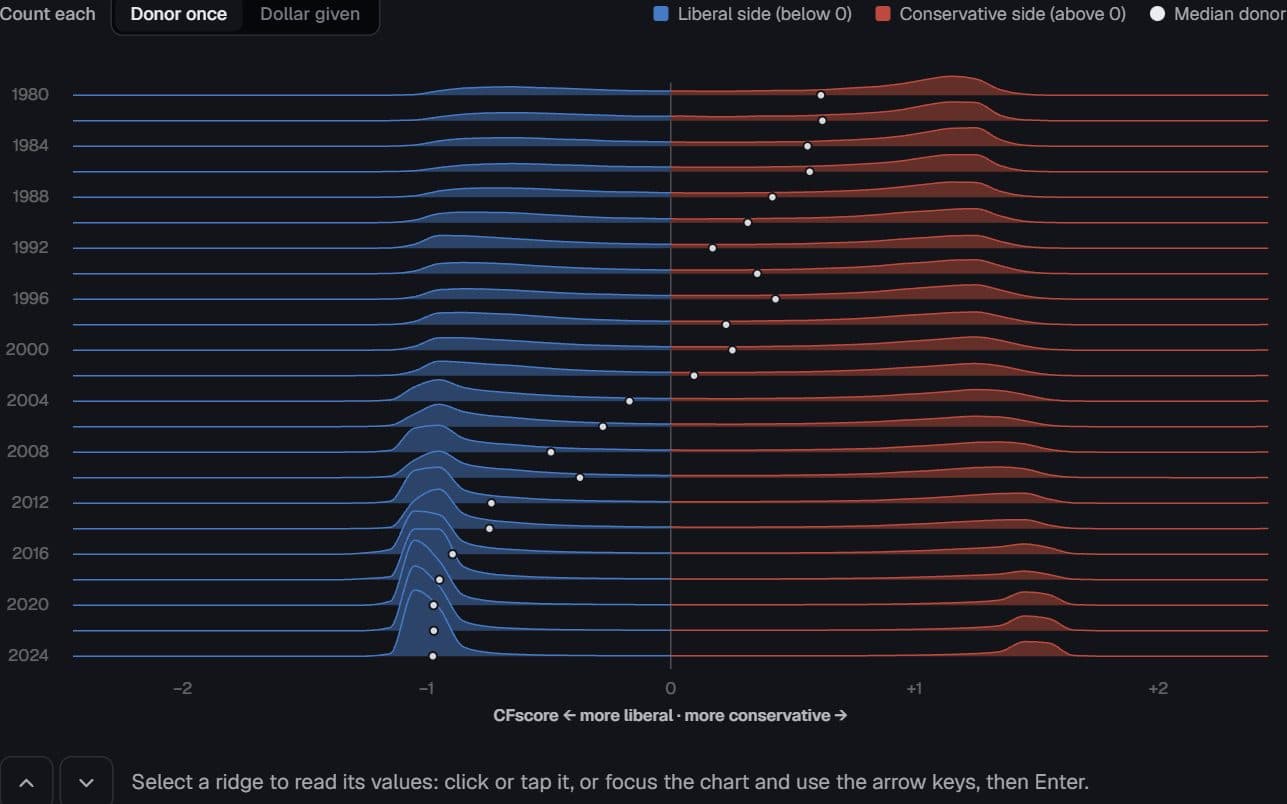
US federal donors · Stanford DIME, 1980–2024
The donor centre emptied first
Where do reliable campaign donors sit on the left–right scale in each election cycle, and did the middle empty out?
Hides: Donors changing their minds. Each donor’s score is fixed; the ridges show who was giving each cycle.
Try it: Switch donor weighting
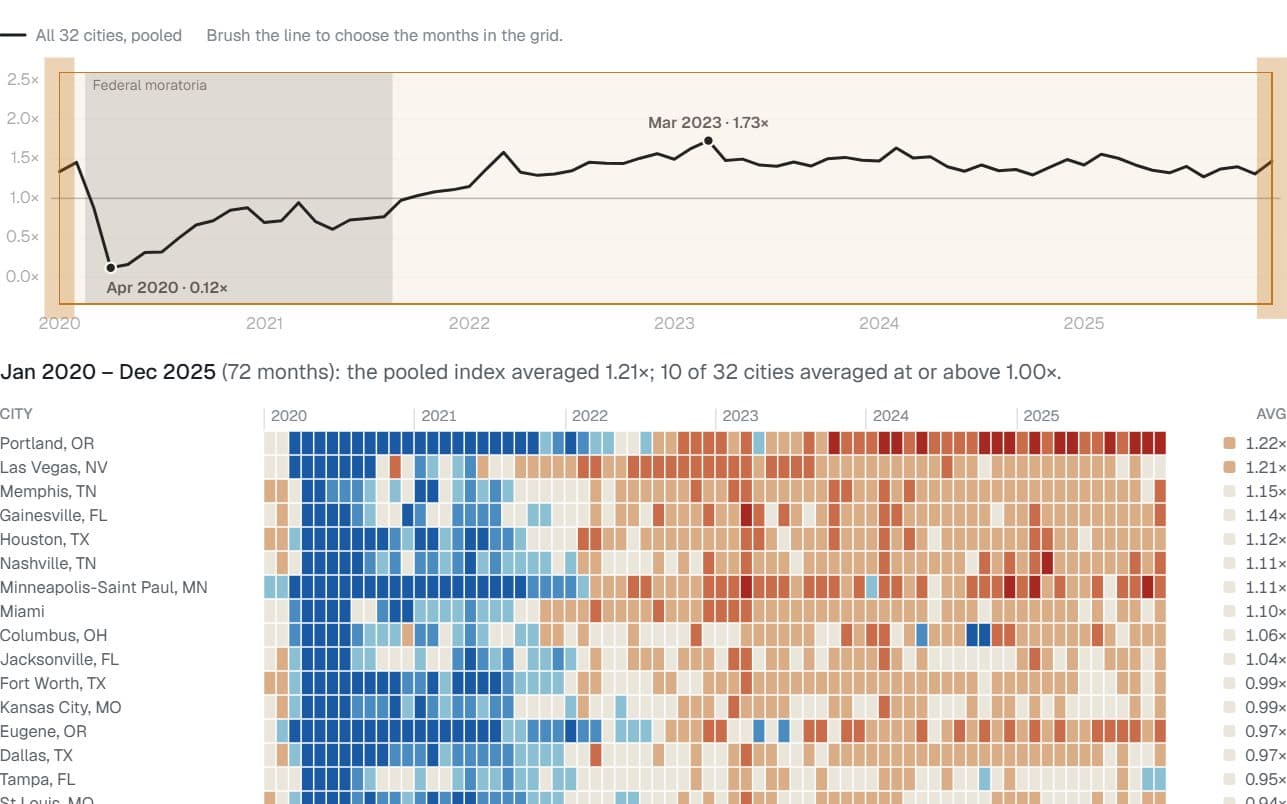
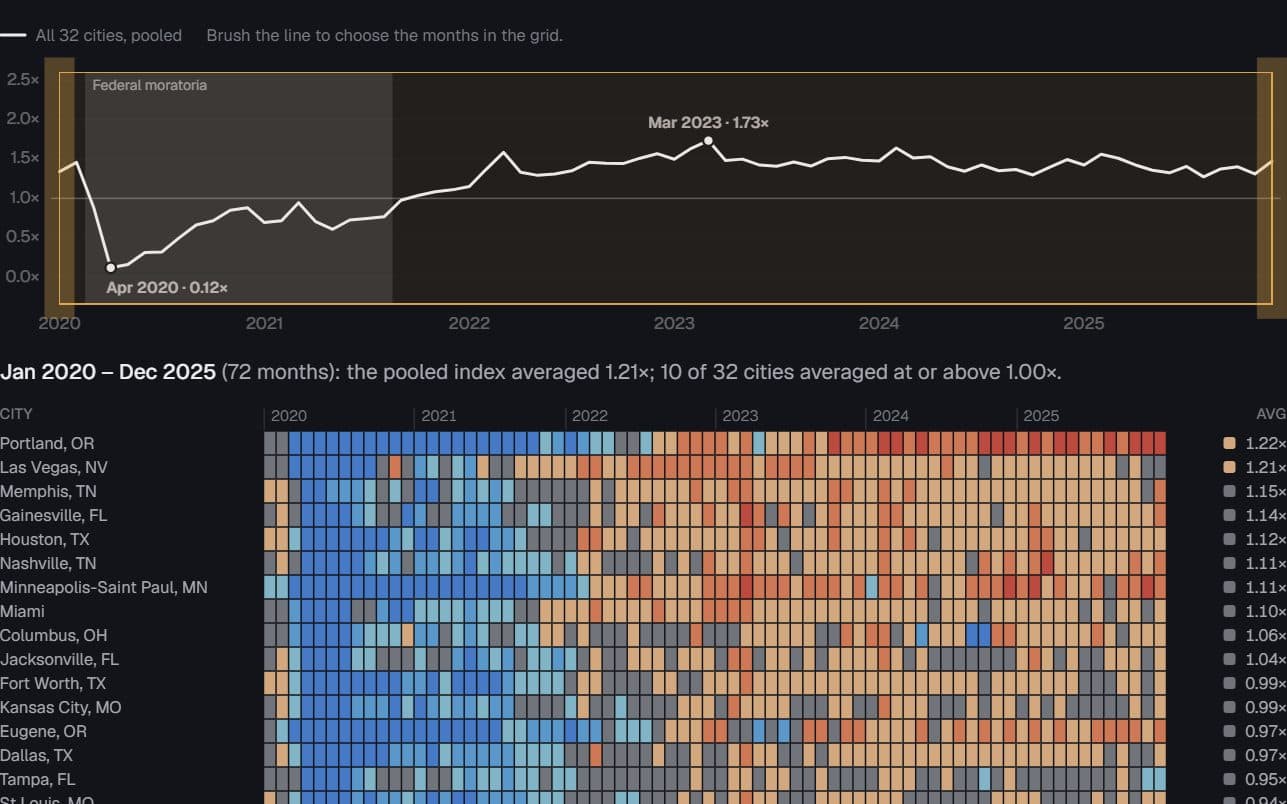
32 US cities · Eviction Lab filings, 2020–2025
Filings froze, then overshot
When did each city’s eviction filings fall below, and later climb past, its own pre-pandemic normal?
Hides: Comparable rates. Each city is measured against its own baseline, so a high index can mean a low baseline.
Try it: Select months on the timeline
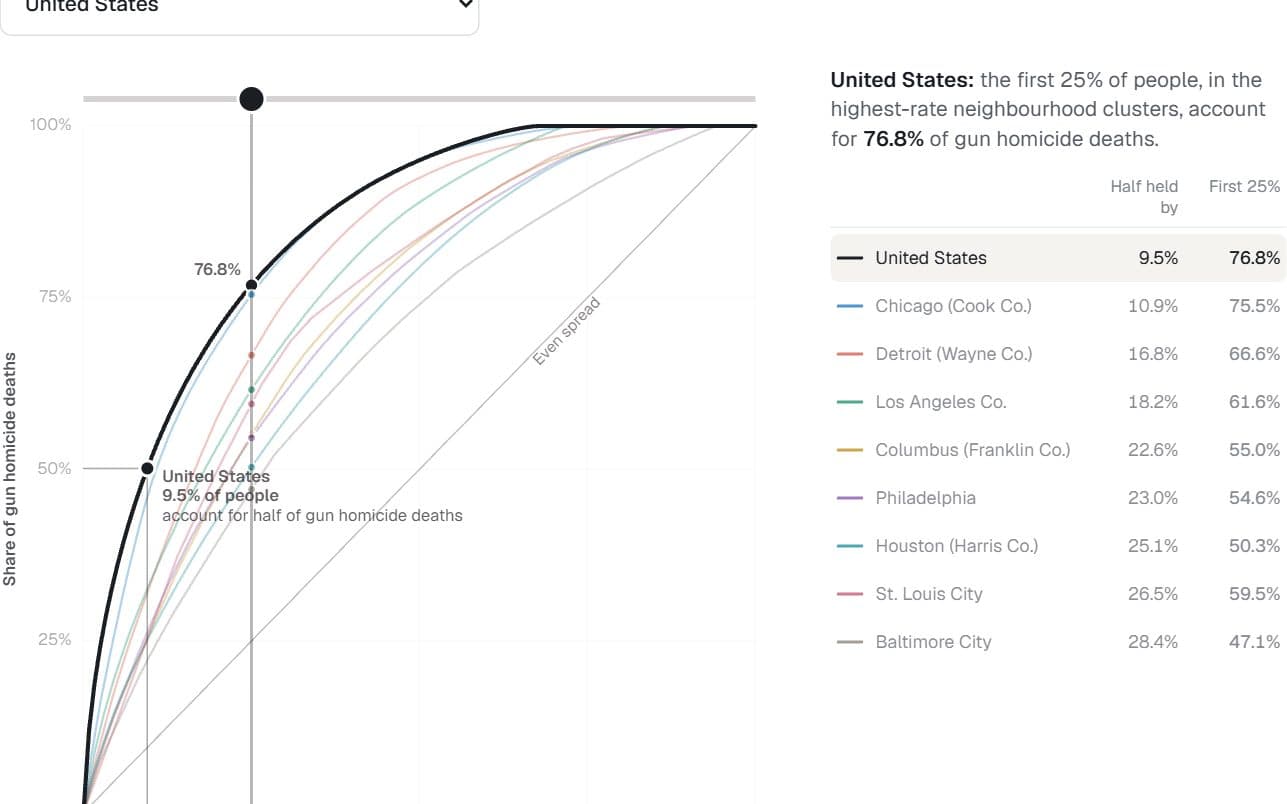
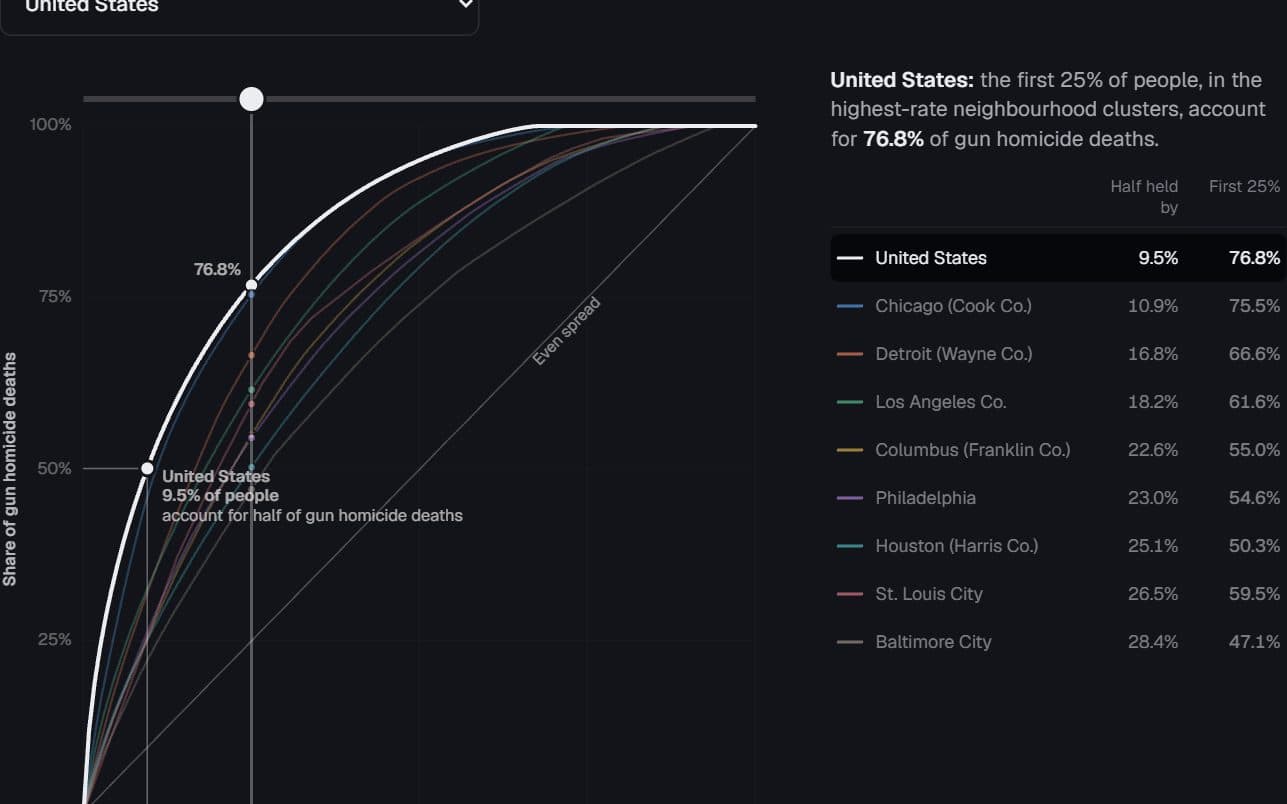
US and eight large jurisdictions · CDC firearm homicide, 2022–2024
Half the deaths, a sliver of the map
What share of people account for half of gun homicide deaths, nationally and within big cities?
Hides: The true concentration, which is higher: the finest unit published is a cluster of about five tracts.
Try it: Drag along the curve
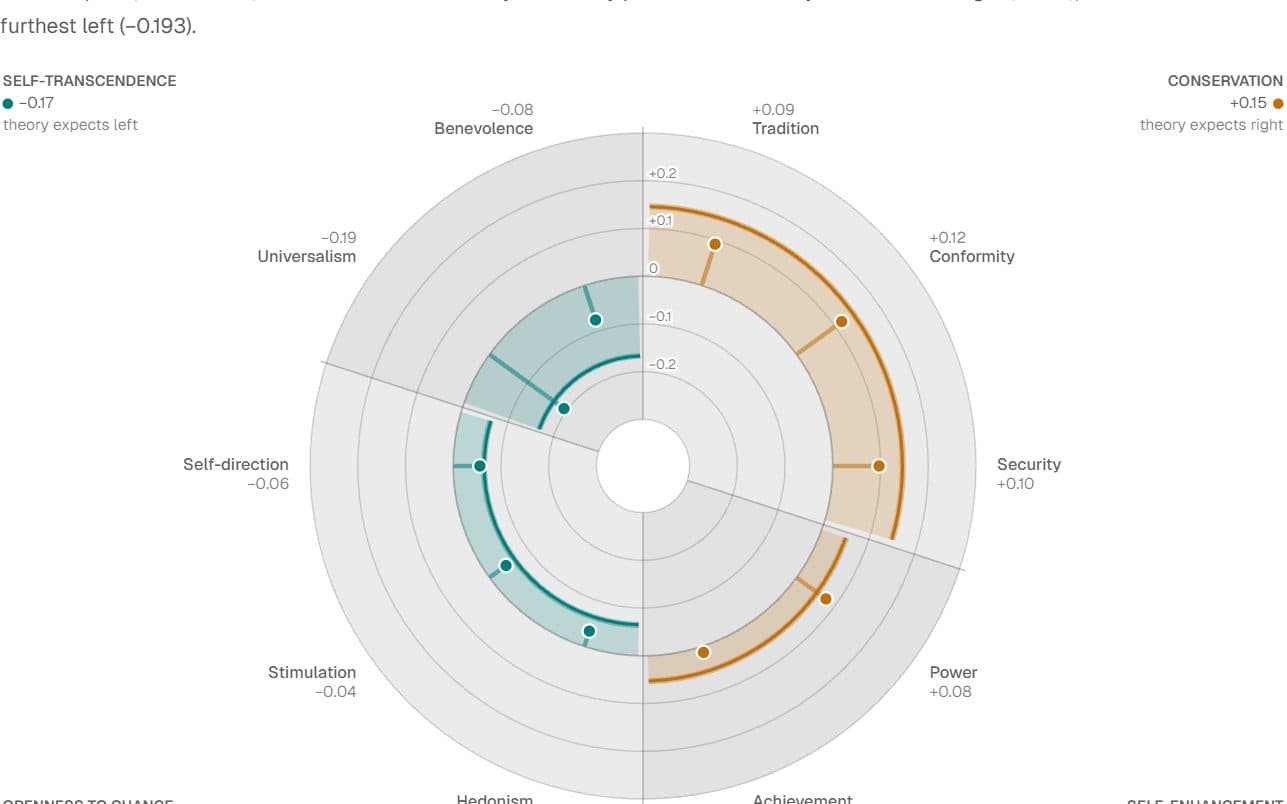
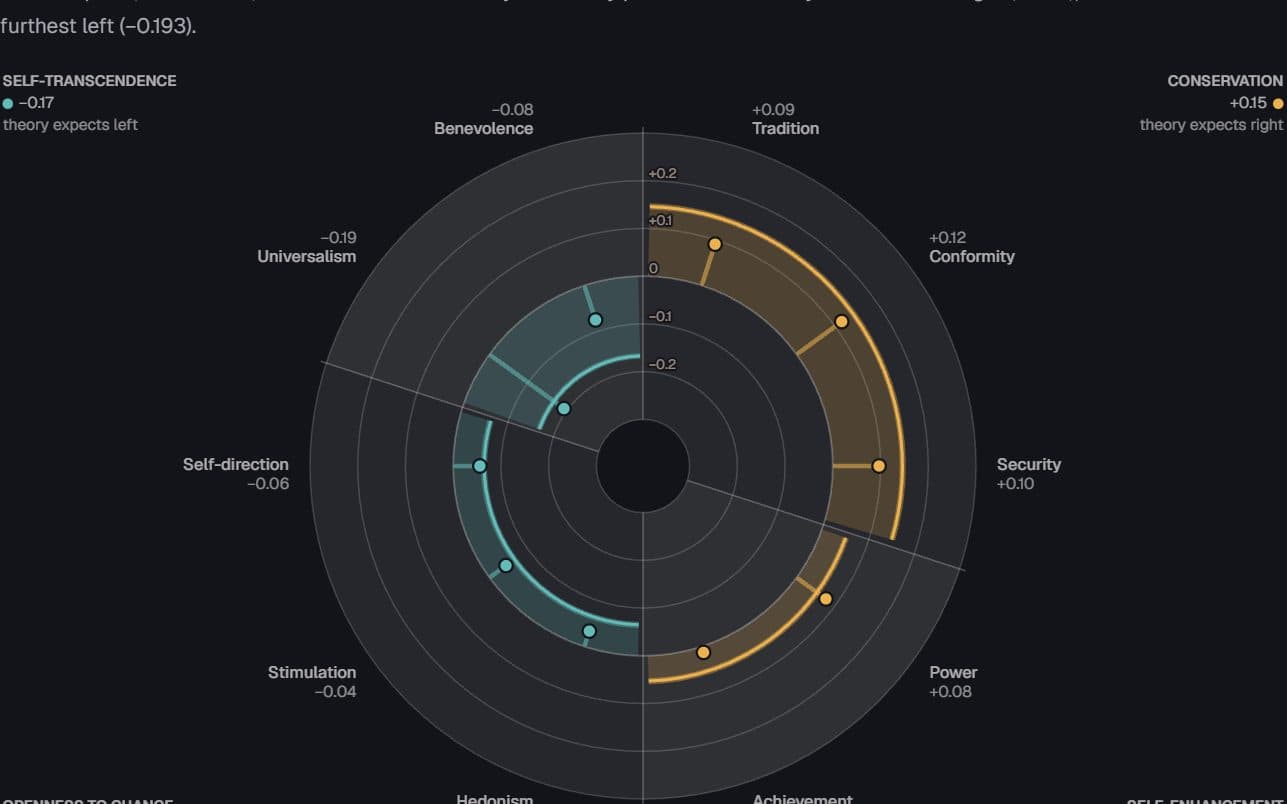
European countries · European Social Survey, 2002–2020
The value circle splits left from right — in the West
Which basic values go with placing yourself on the right or the left, and does the pattern hold in post-communist Europe?
Hides: Party or cause. These are associations with left–right self-placement, and the angles come from theory, not data.
Try it: Pick a country
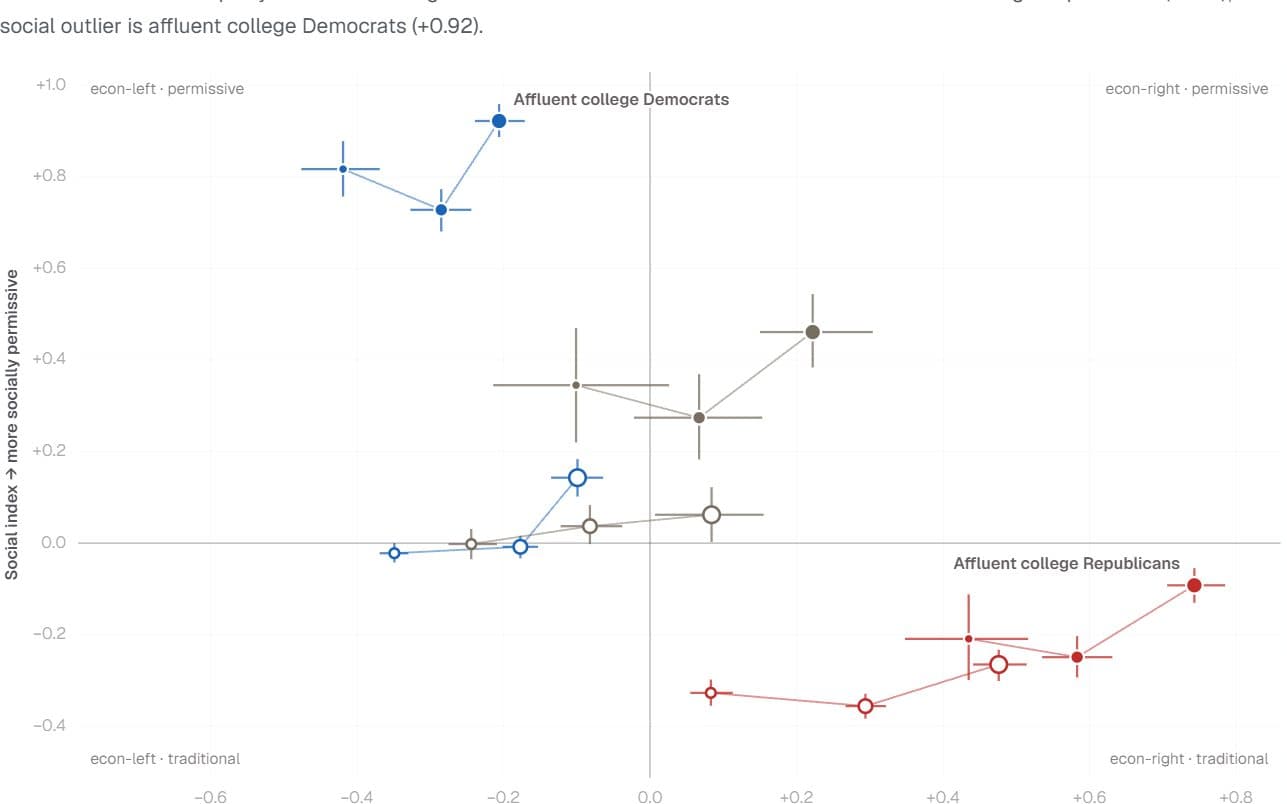
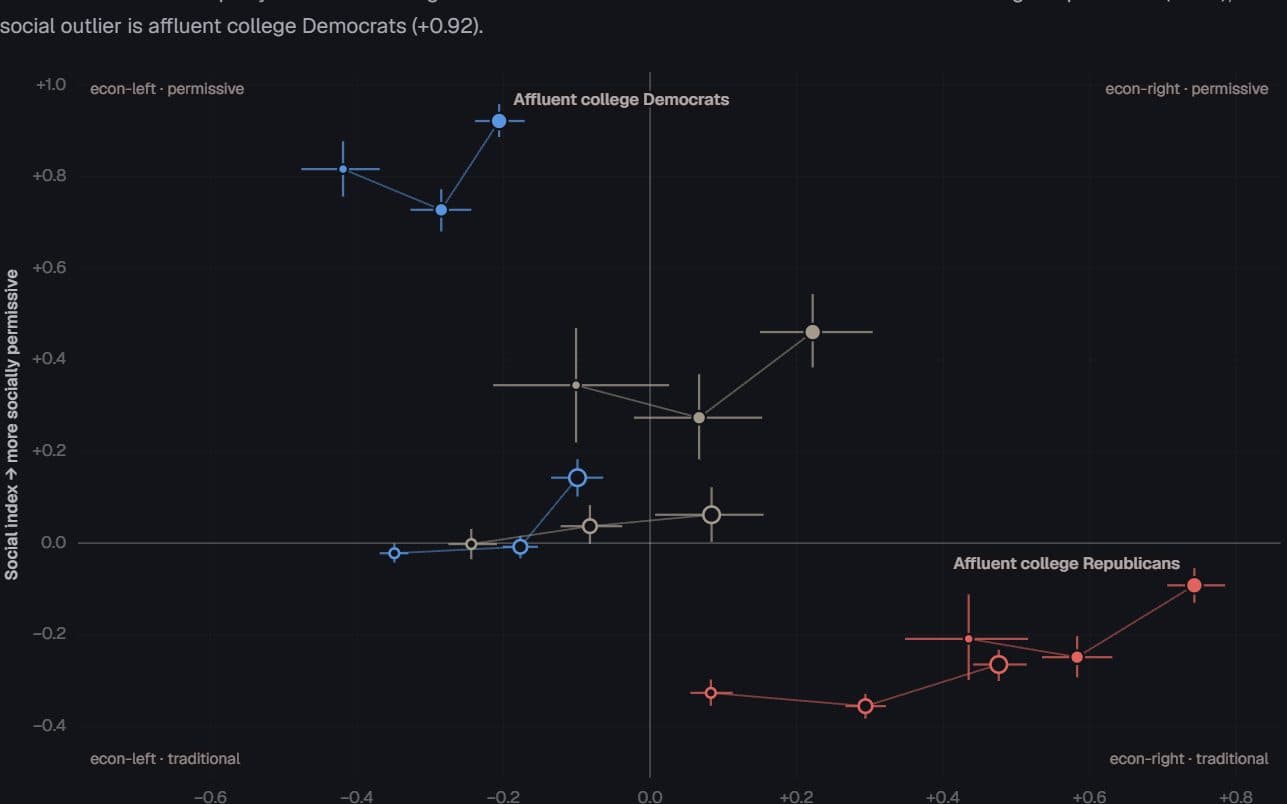
US voters · General Social Survey and ANES, 1948–2024
The outlier depends on the axis
Which slice of the electorate stands furthest from everyone else — and does the answer change between economic and social questions?
Hides: Design-based uncertainty. The intervals are bootstrap estimates, and the GSS moved online in 2021.
Try it: Switch survey items
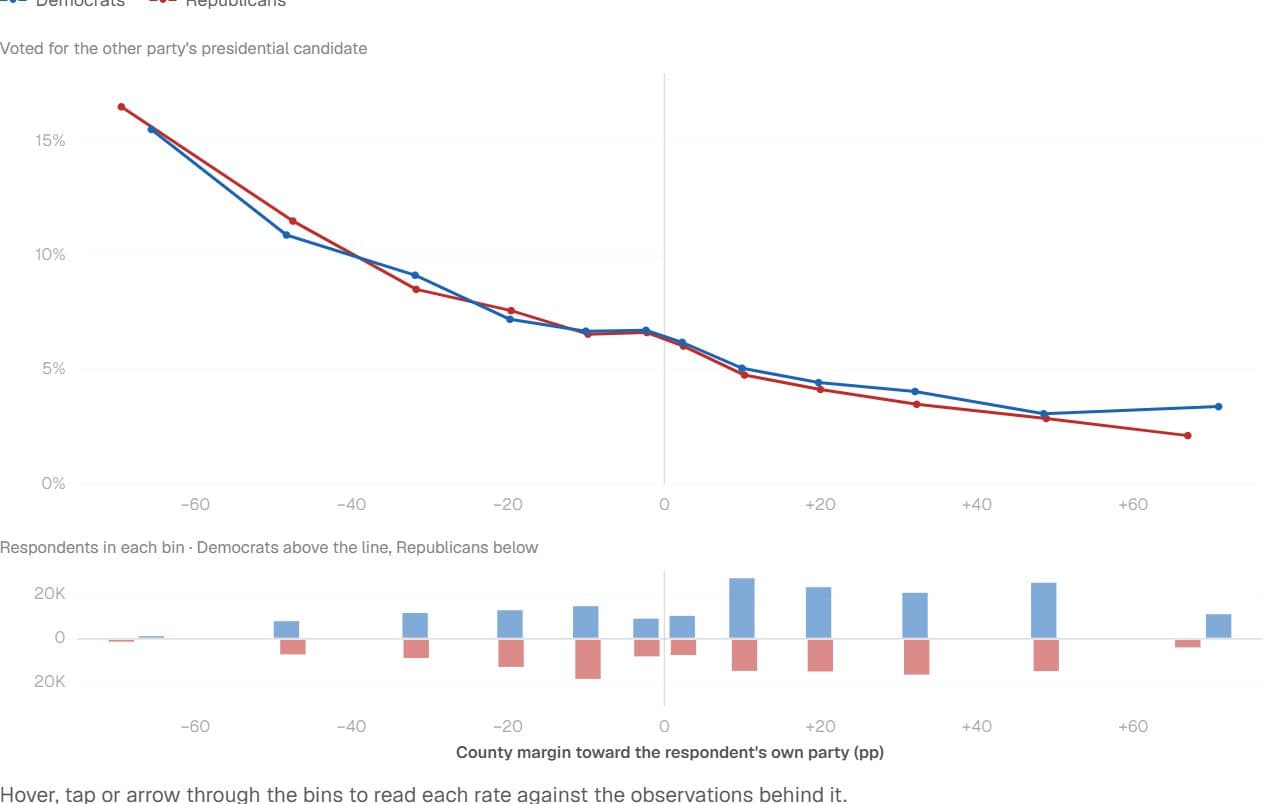
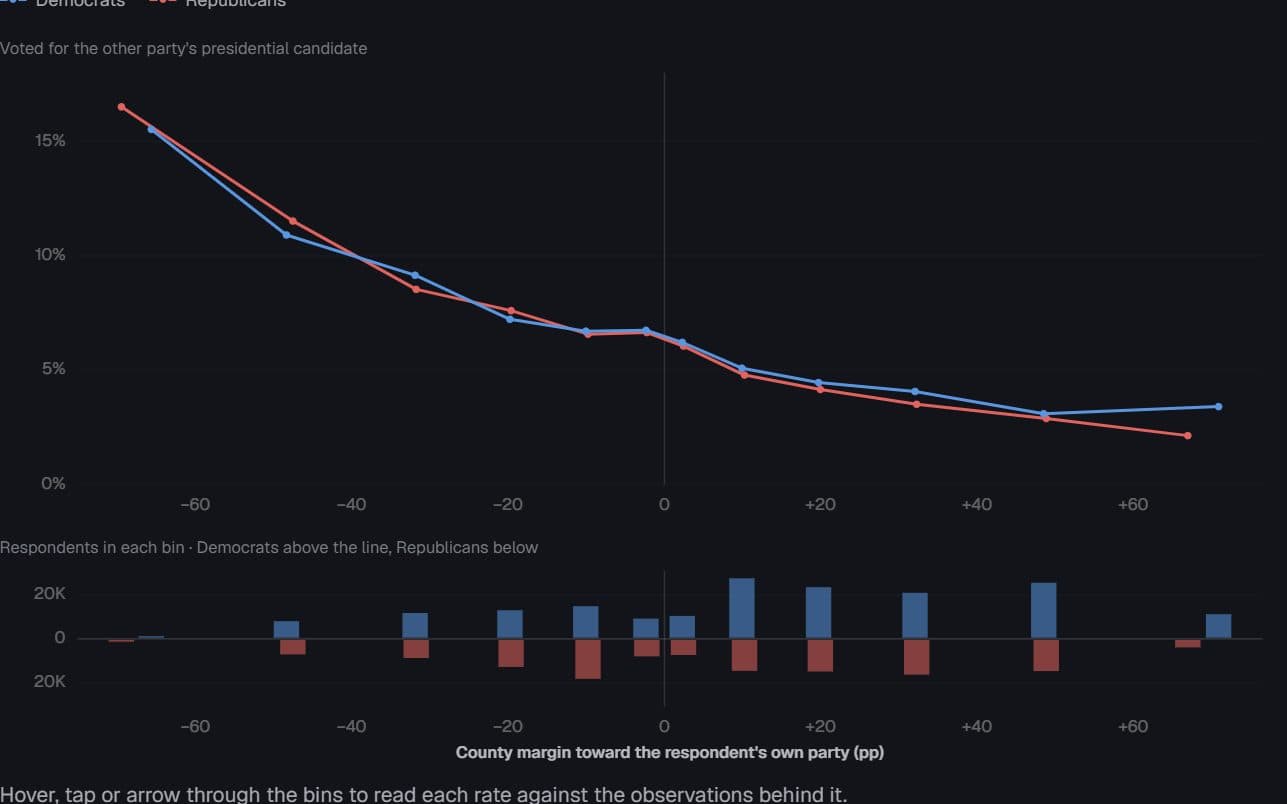
US voters · Cooperative Election Study, 2008–2024
Outnumbered, and defecting
How much more often do partisans vote for the other party when their county leans against them — and how many people live where that effect is steepest?
Hides: The thin ends. The most extreme rates come from the smallest groups of respondents.
Try it: Switch the axis
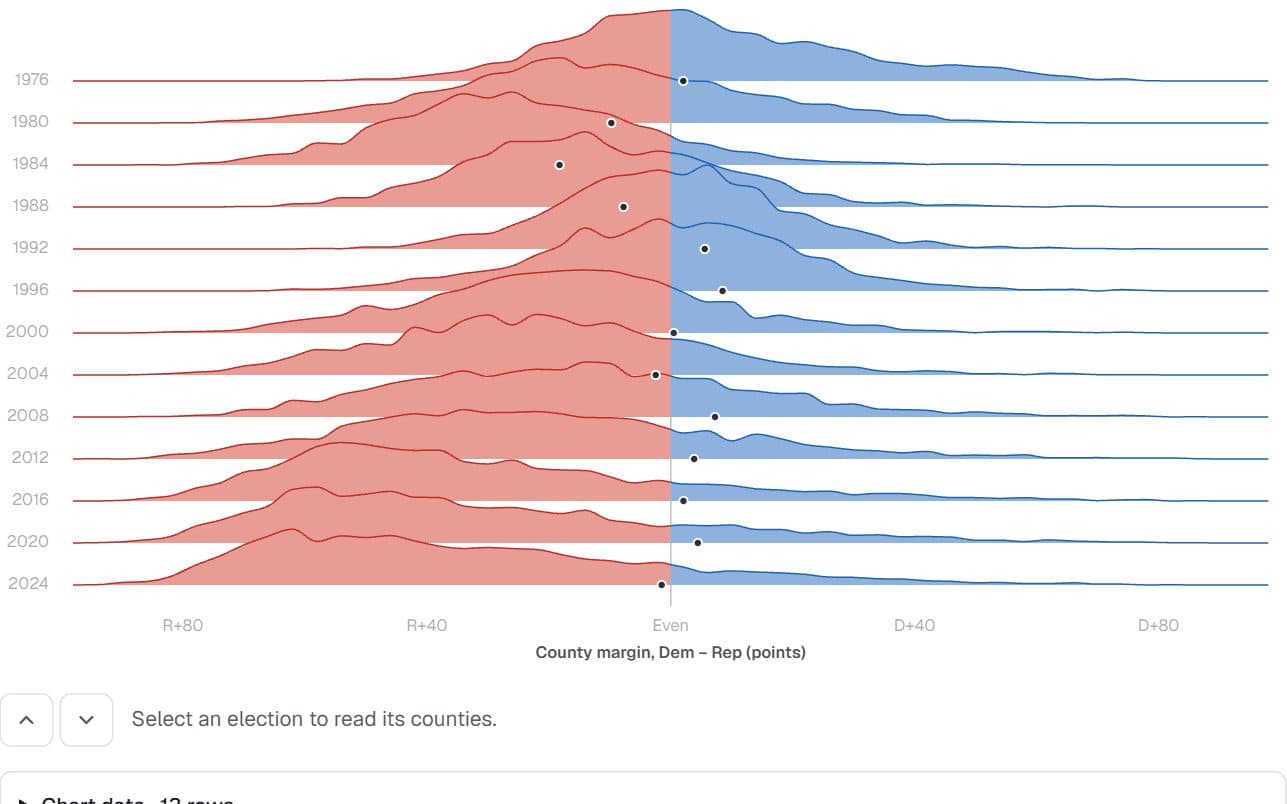
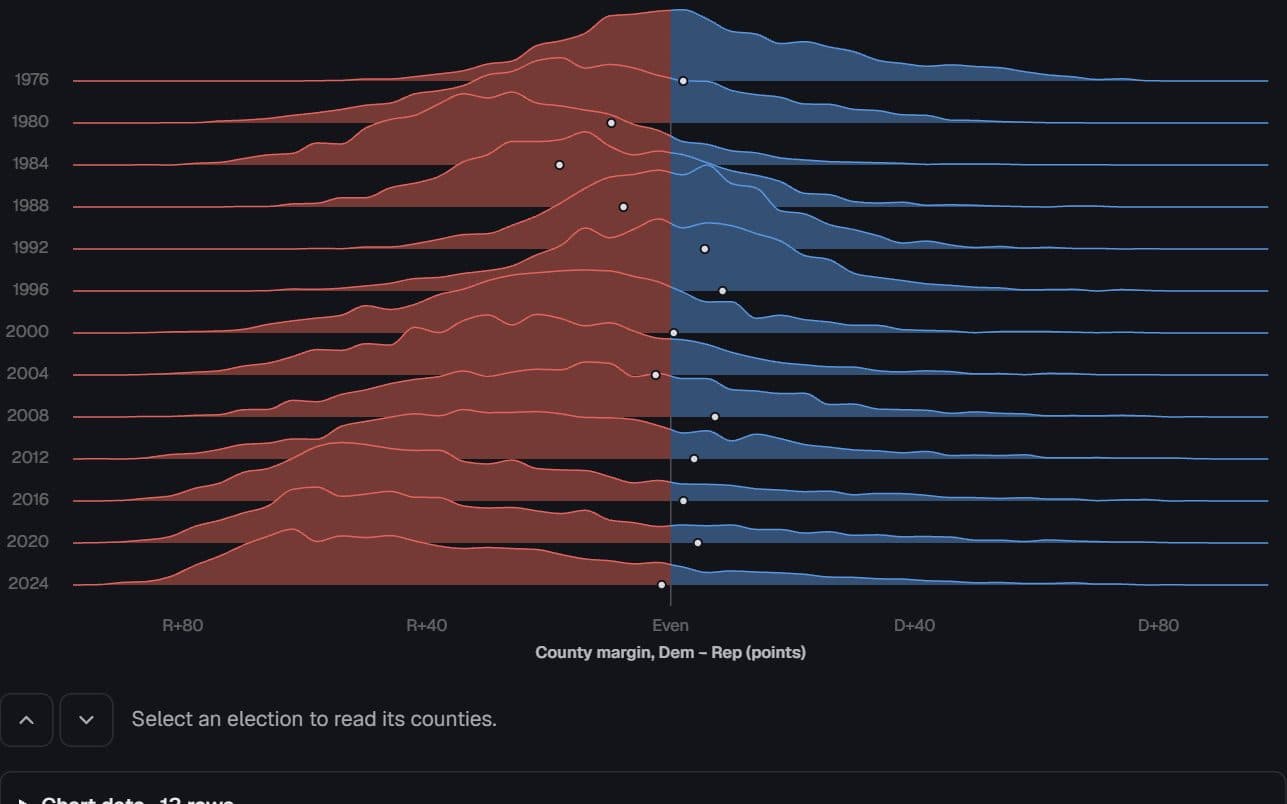
US counties · presidential returns, 1976–2024
Counties sorted into landslides
Between 1976 and 2024, did counties drift apart gradually or sort into landslides — and how far did the county map part from the national vote?
Hides: Population. Every county counts once, so the ridges describe the map rather than the vote.
Try it: Thirteen elections
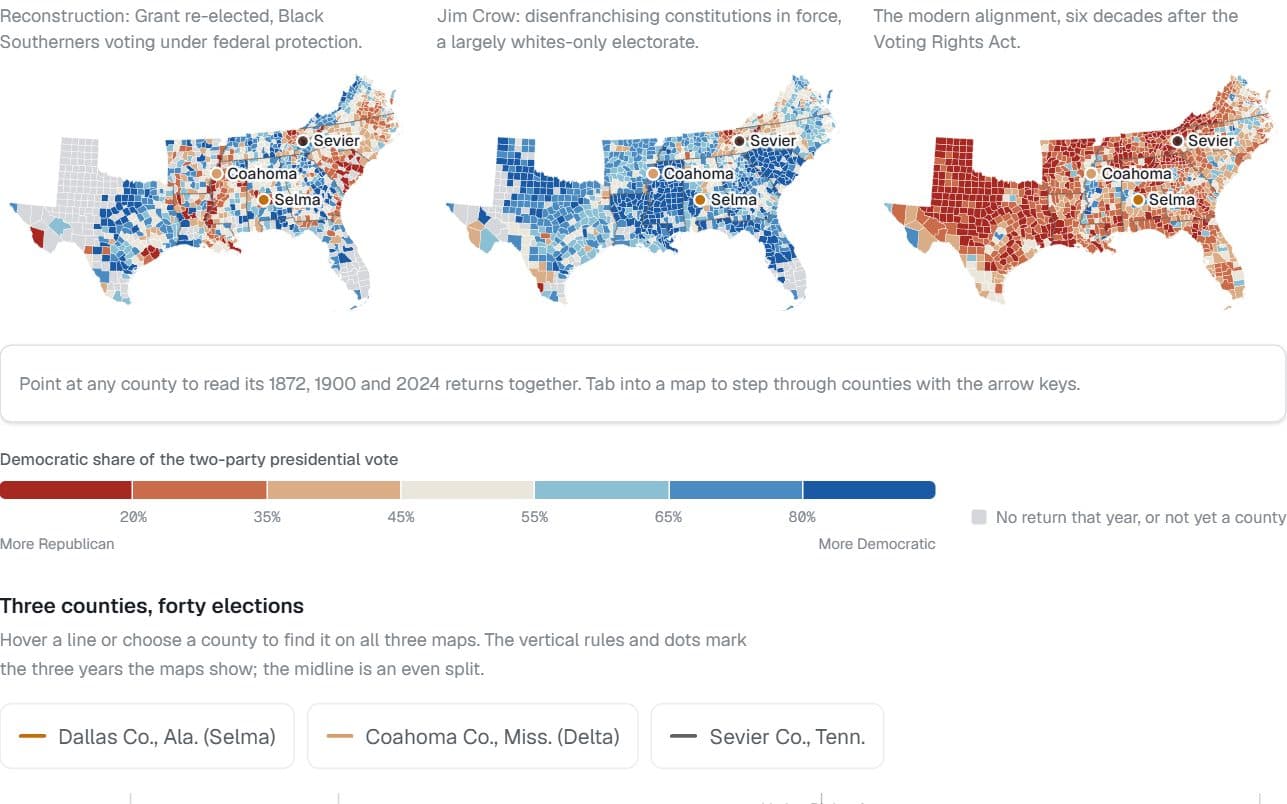
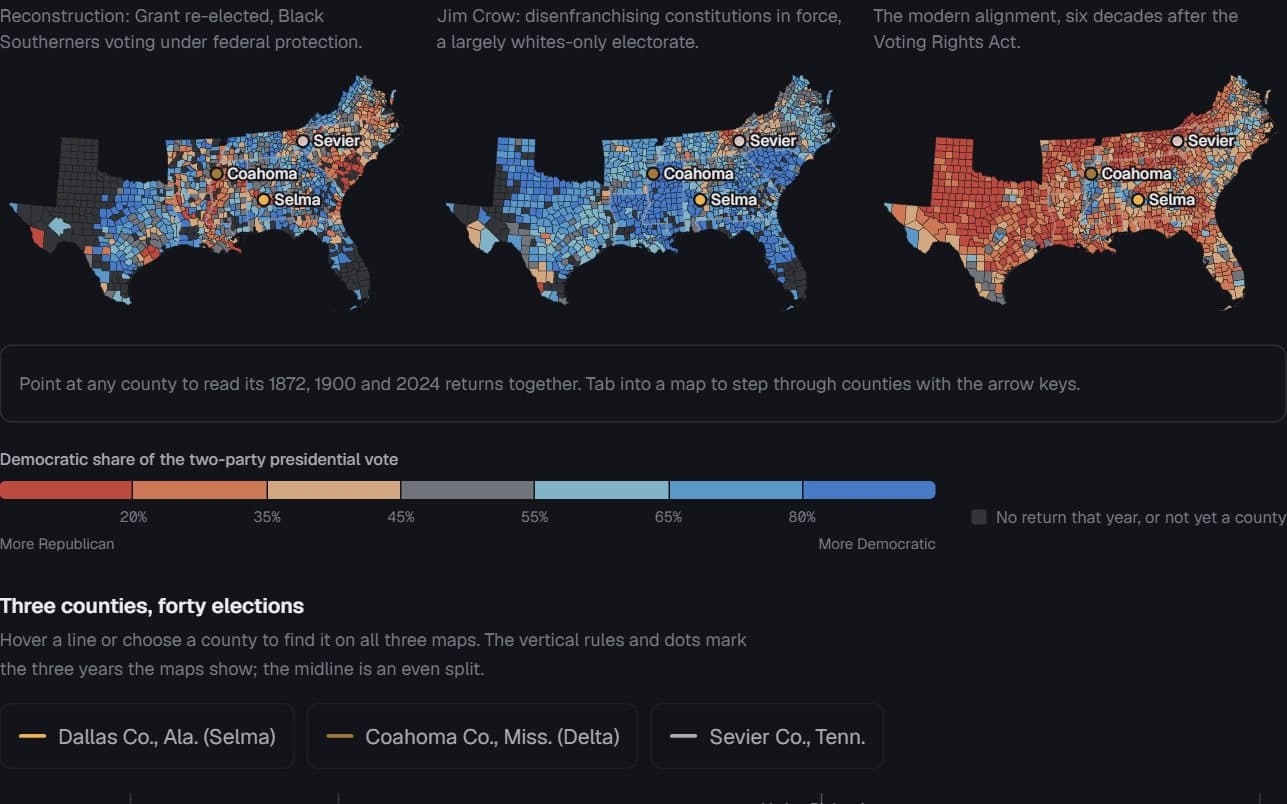
Eleven former Confederate states · county presidential returns, 1872, 1900, 2024
The map remembers, upside down
Does the South’s 1872 county map still predict how its counties vote?
Hides: Who could vote. Jim Crow–era Democratic shares describe a largely whites-only electorate.
Try it: Point at a county
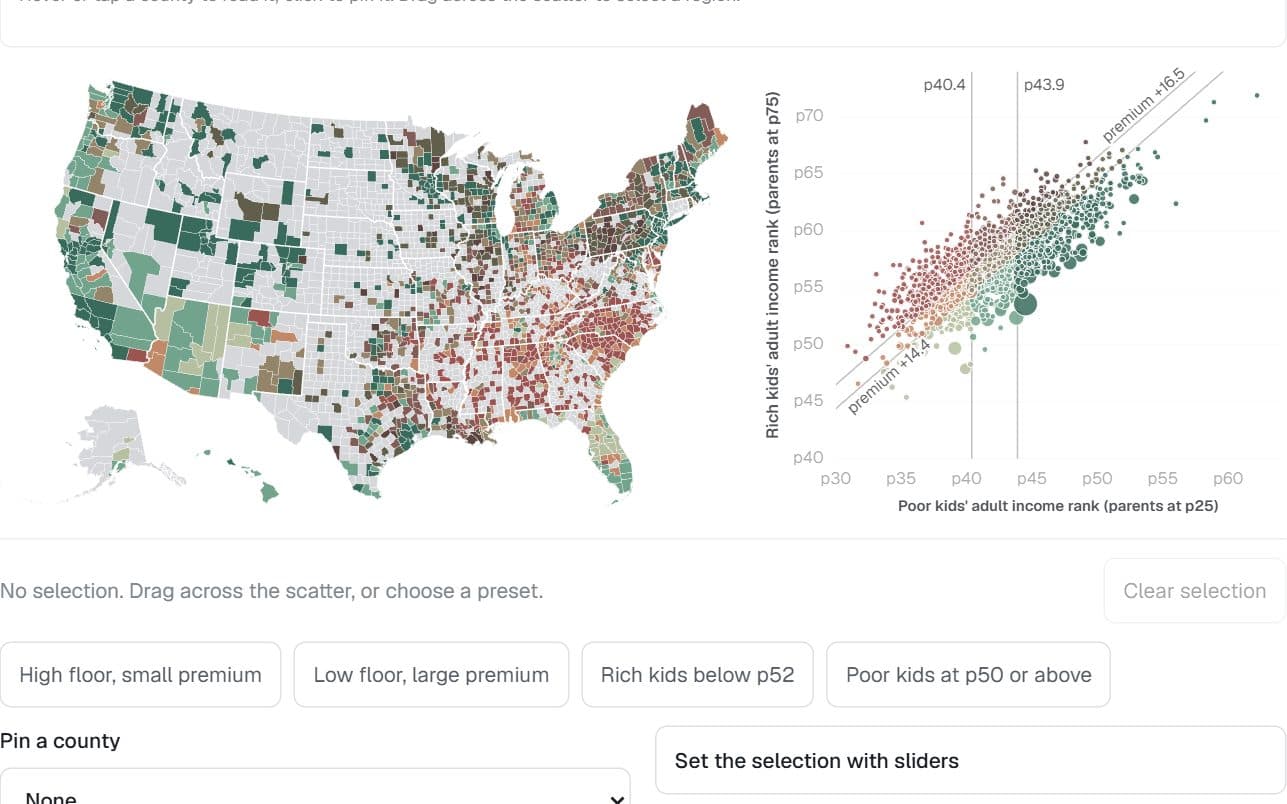
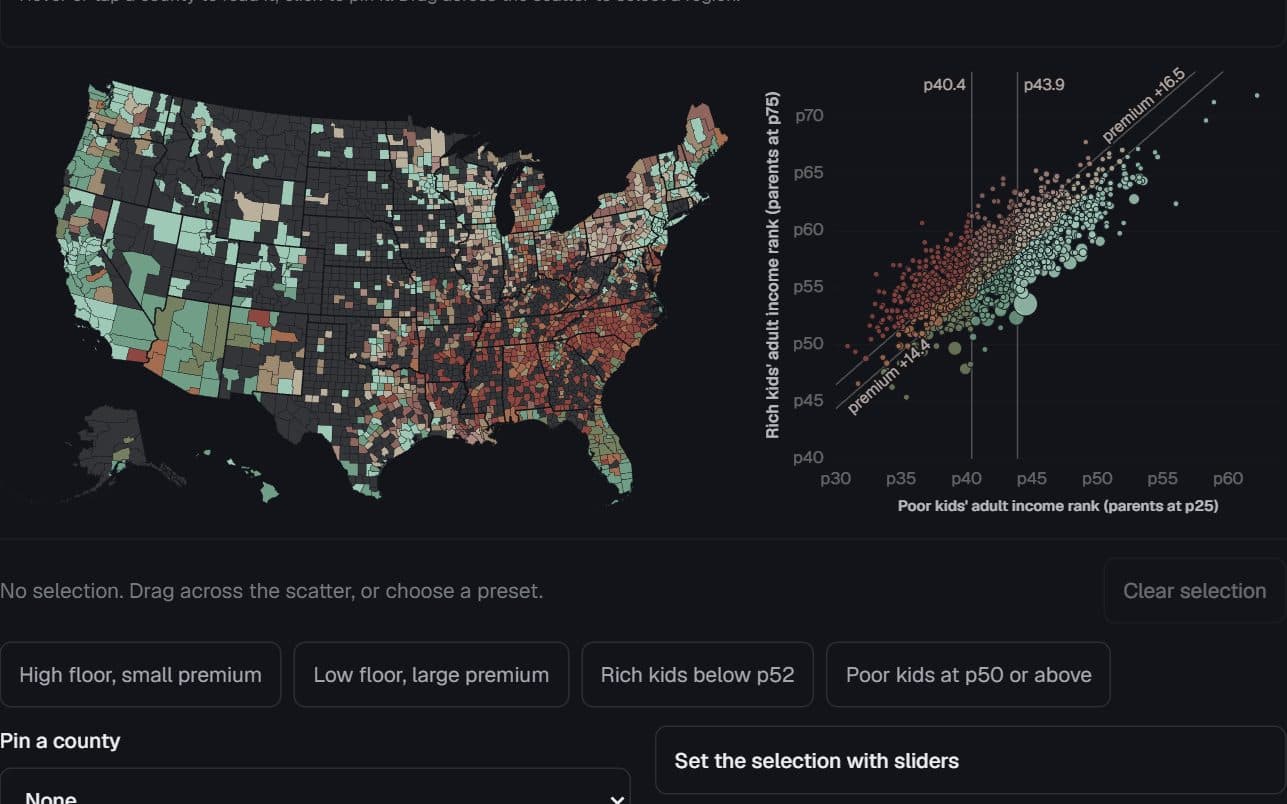
1,581 US counties · Opportunity Atlas, children born 1978–83
Where birth buys the most
Where does a comfortable birth buy the most extra adult income — and is a small premium good news?
Hides: What place does on its own. Effects of place are mixed with who lives there.
Try it: Select counties on the scatter
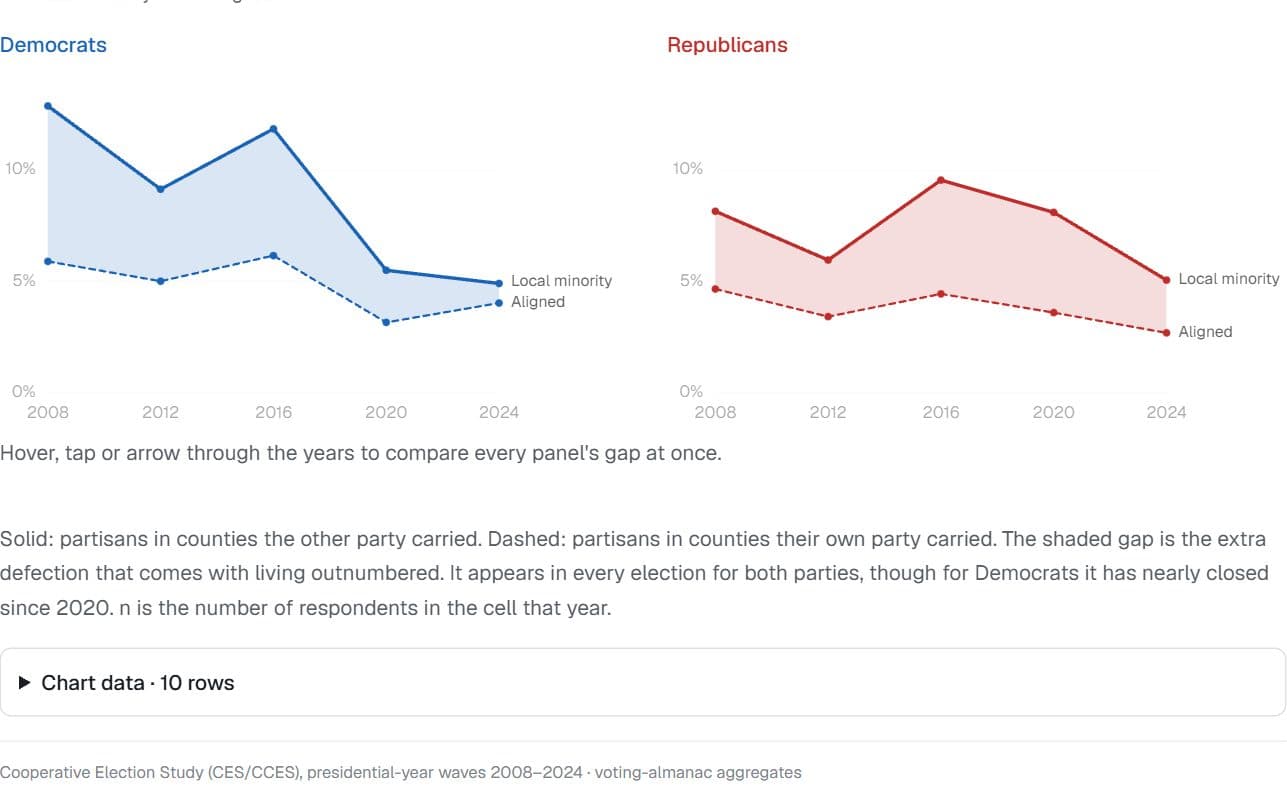
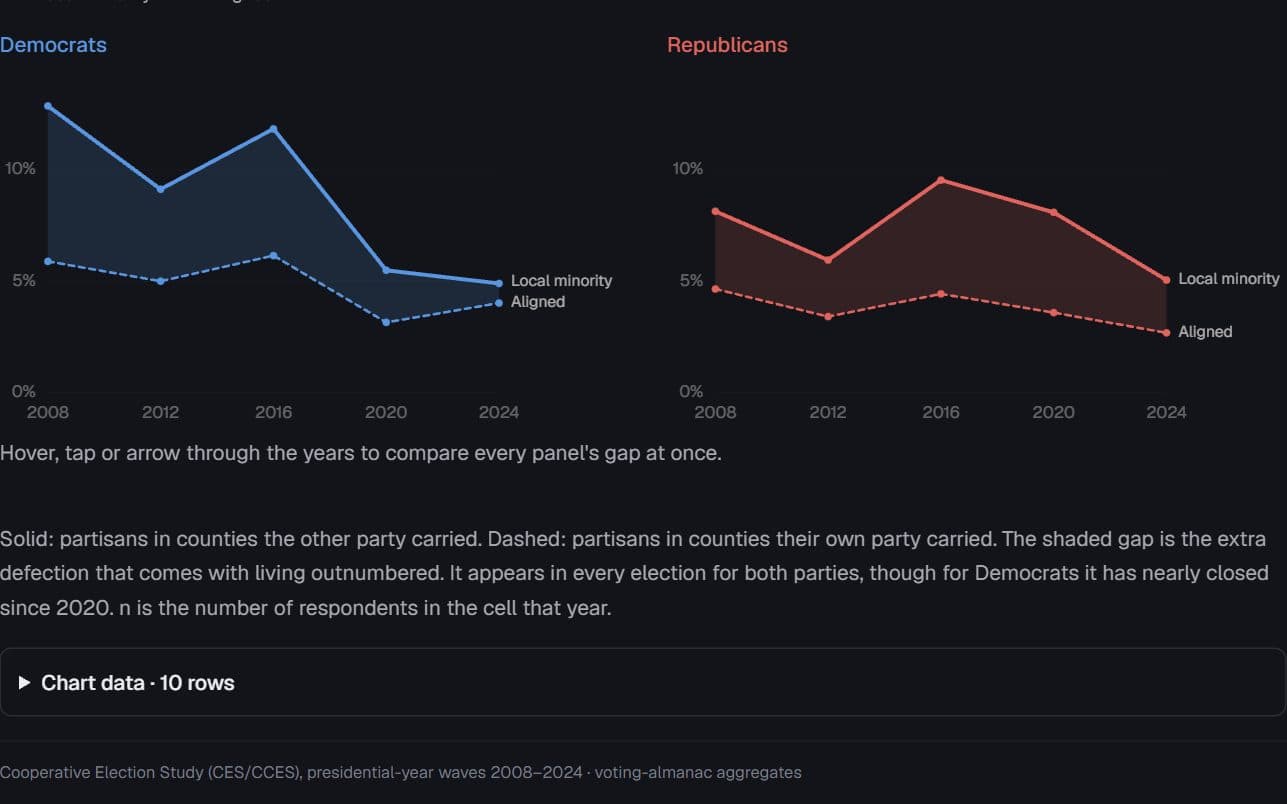
US voters · Cooperative Election Study, presidential years 2008–2024
The cost of living outnumbered
Does the extra defection among a party’s local minority hold up election after election?
Hides: Cause. Who moves where, and why, feeds the gap too.
Try it: Hover to read each election
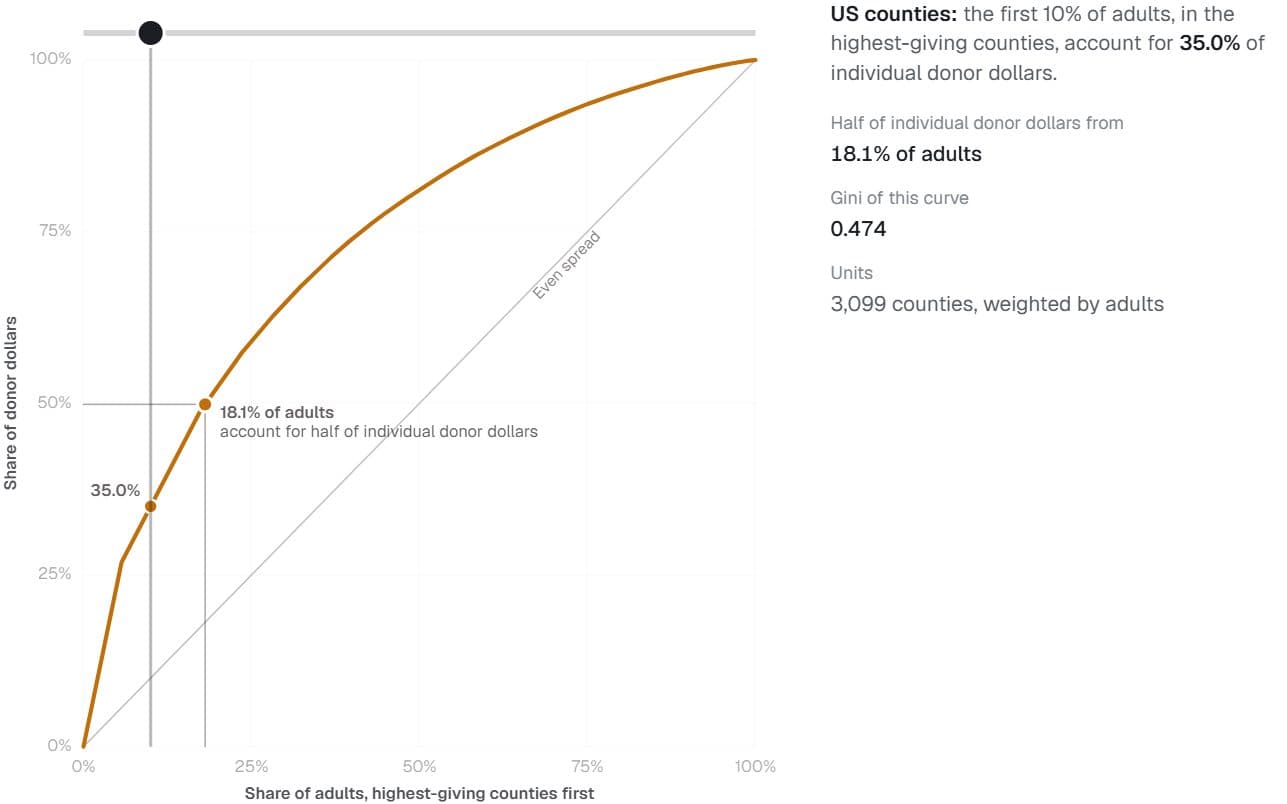
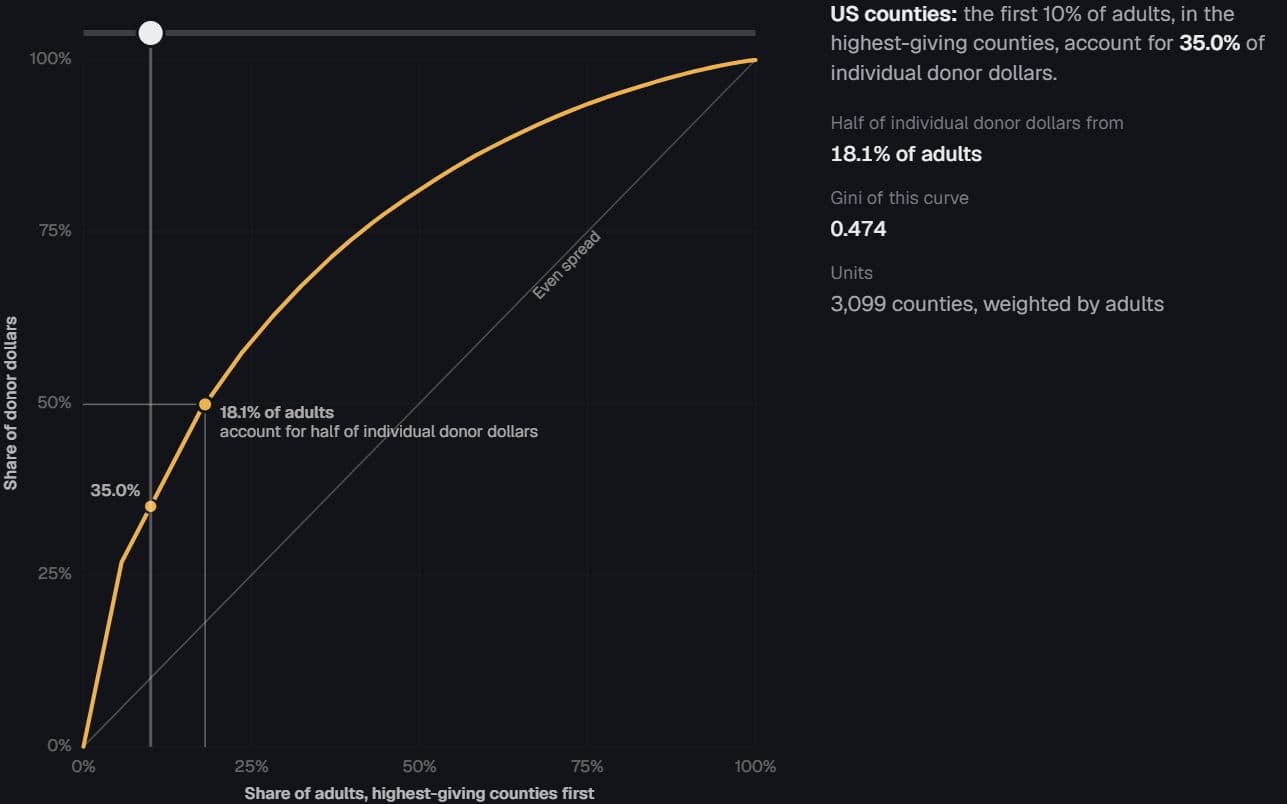
3,099 US counties · Stanford DIME donations and adult population
A sliver of the country funds the rest
What share of American adults supply half of all individual campaign donations?
Hides: Individual donors. Counties are the unit, so a curve over people would be steeper still.
Try it: Drag along the curve
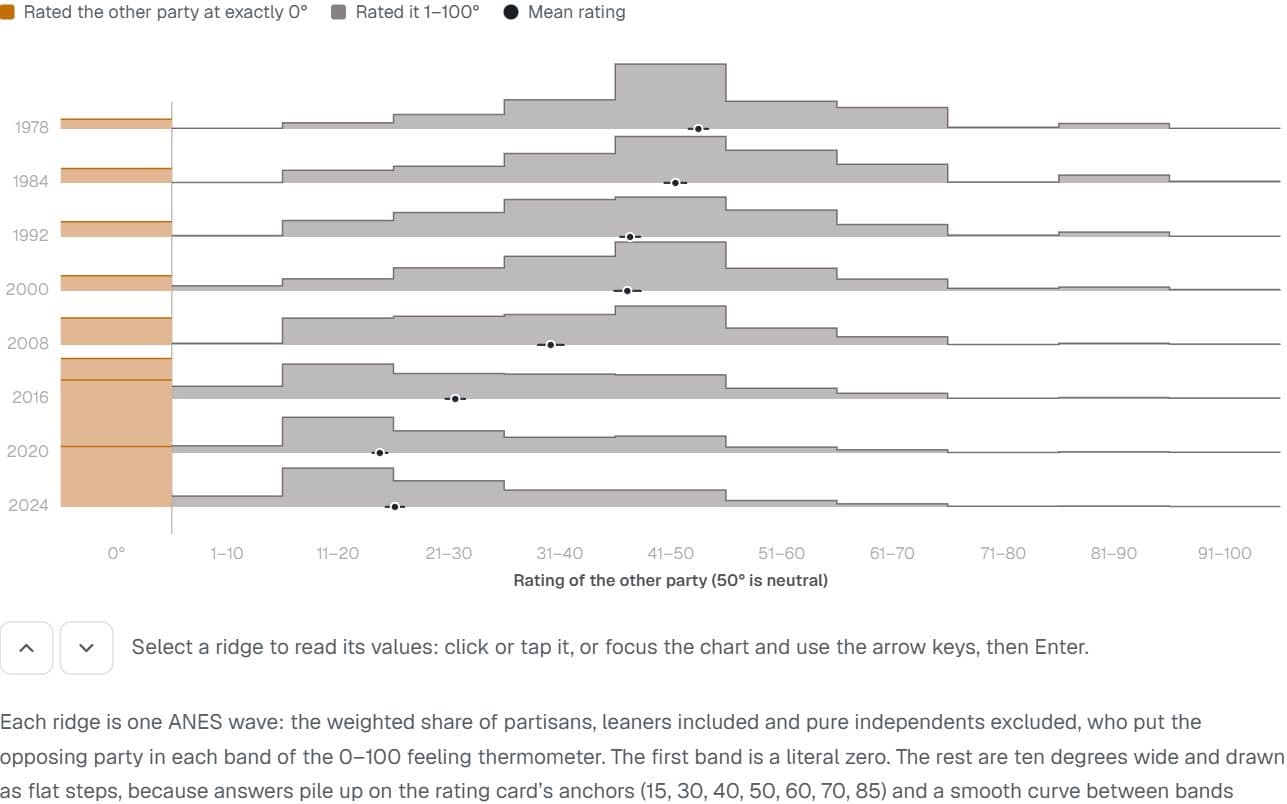
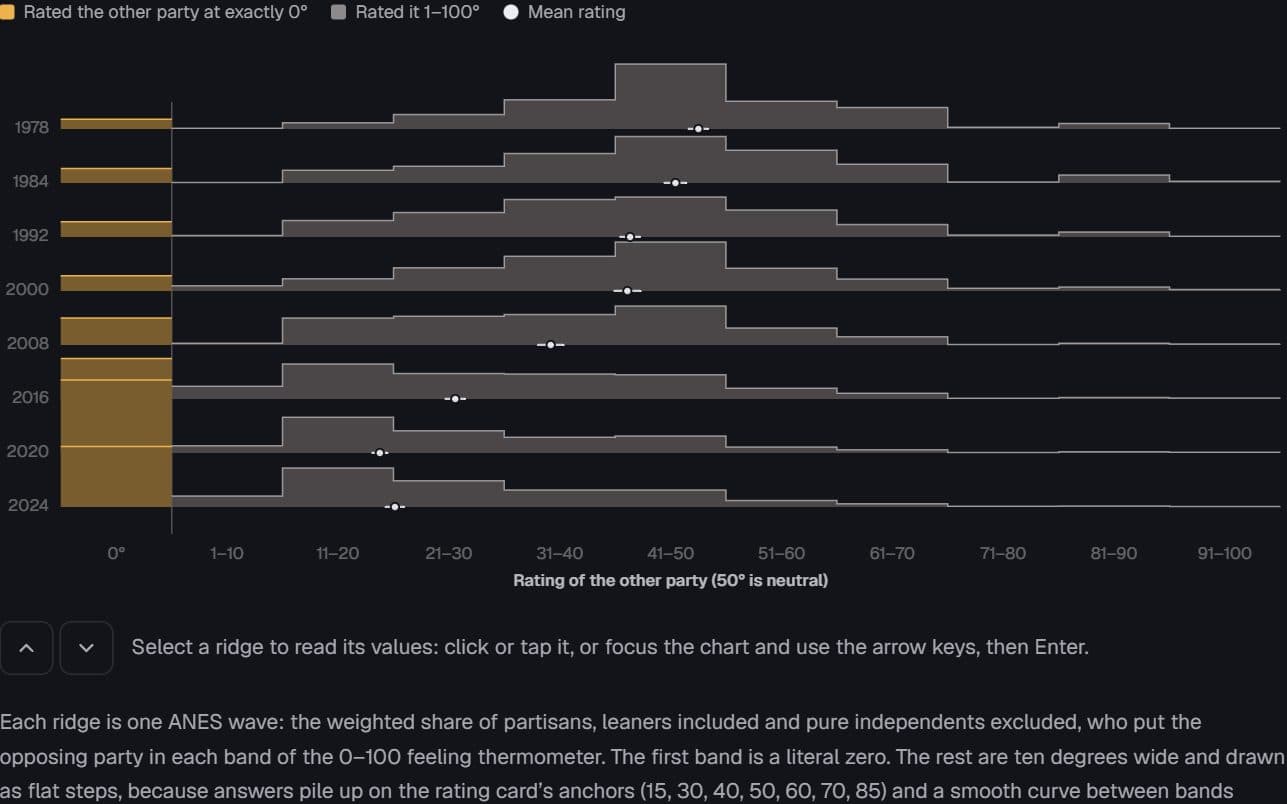
US partisans · American National Election Studies, 1978–2024
The cold mass at zero
How warmly do partisans feel about the other party, and how many now give it a literal zero?
Hides: How much is survey mode. Recent waves were mostly online, and online answers give more zeros.
Try it: Eight survey waves
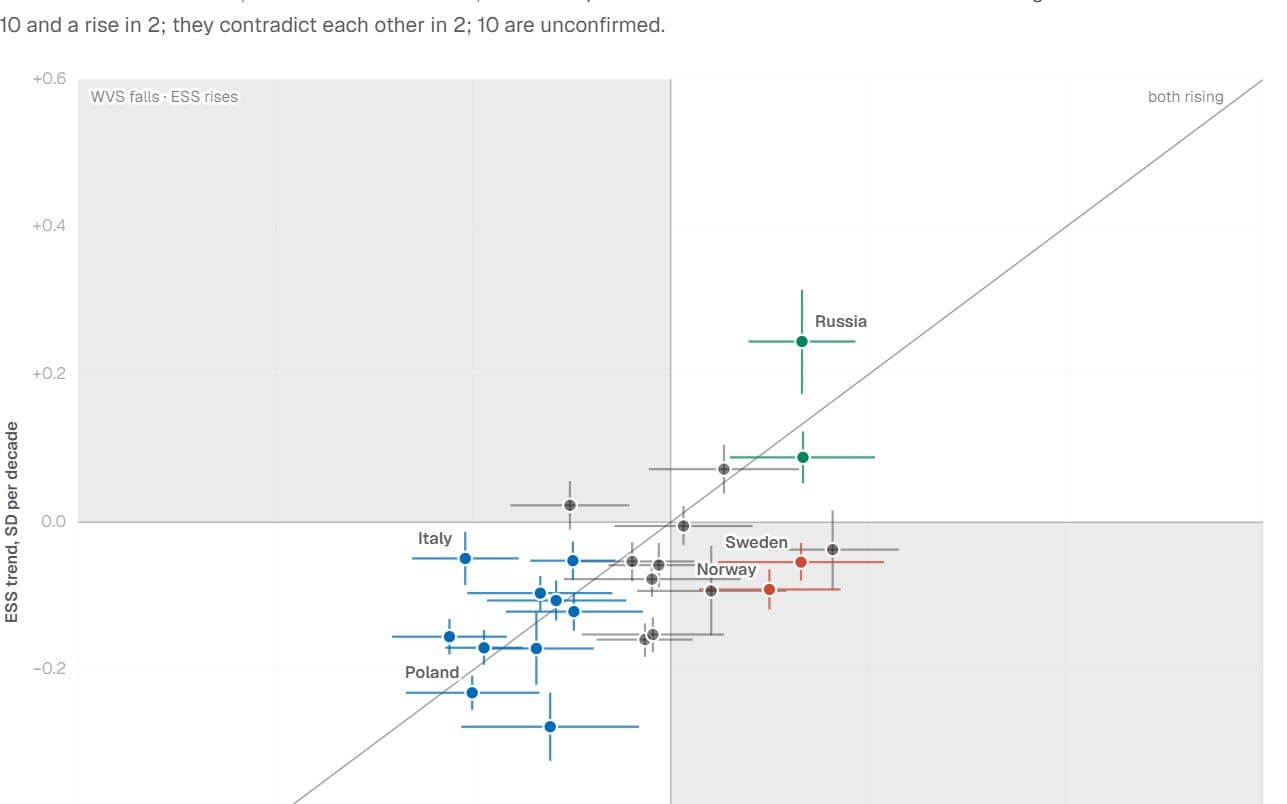
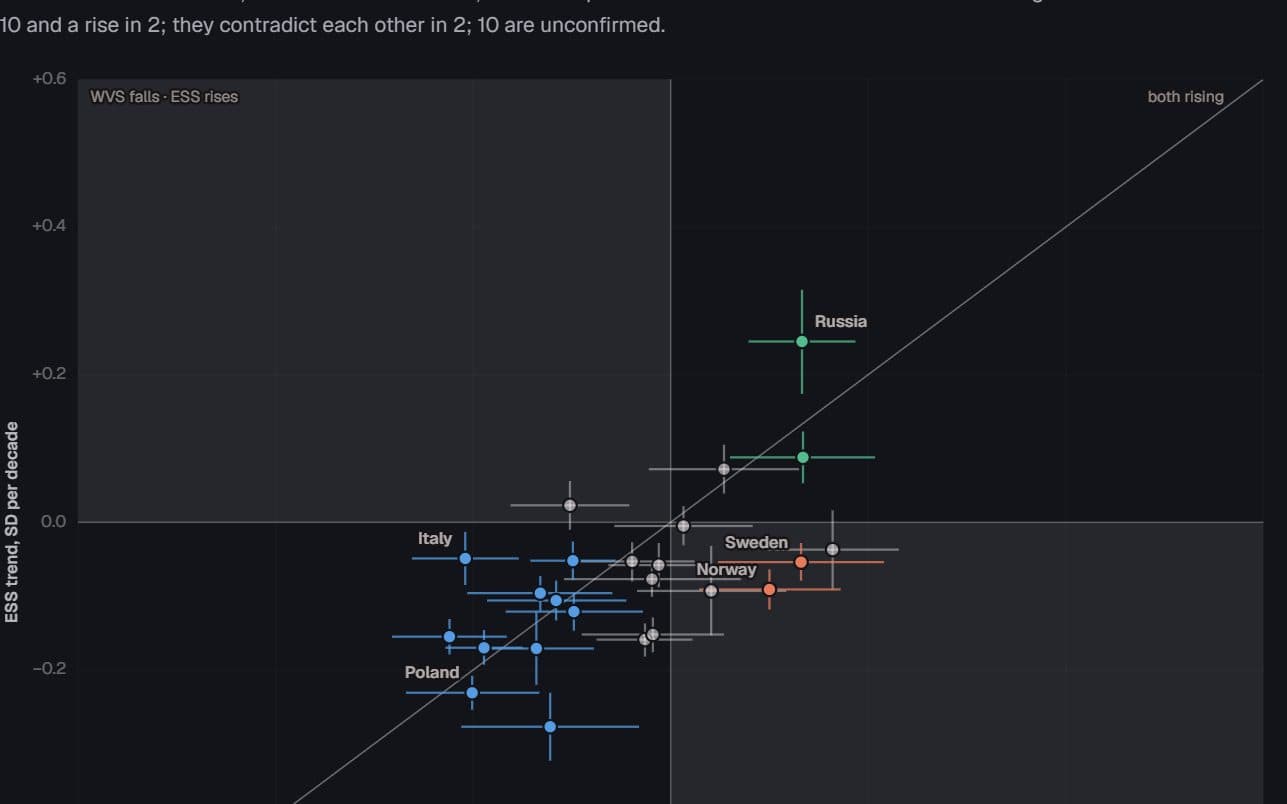
European countries · World/European Values Study and European Social Survey
Two instruments, one trend?
When two major surveys measure the same country, do they see religion changing in the same direction?
Hides: A pooled estimate. Each survey is analysed on its own, and the two are compared country by country.
Try it: Switch the trend compared
More figures
The rest of the collection. You can also browse every figure by subject, too.
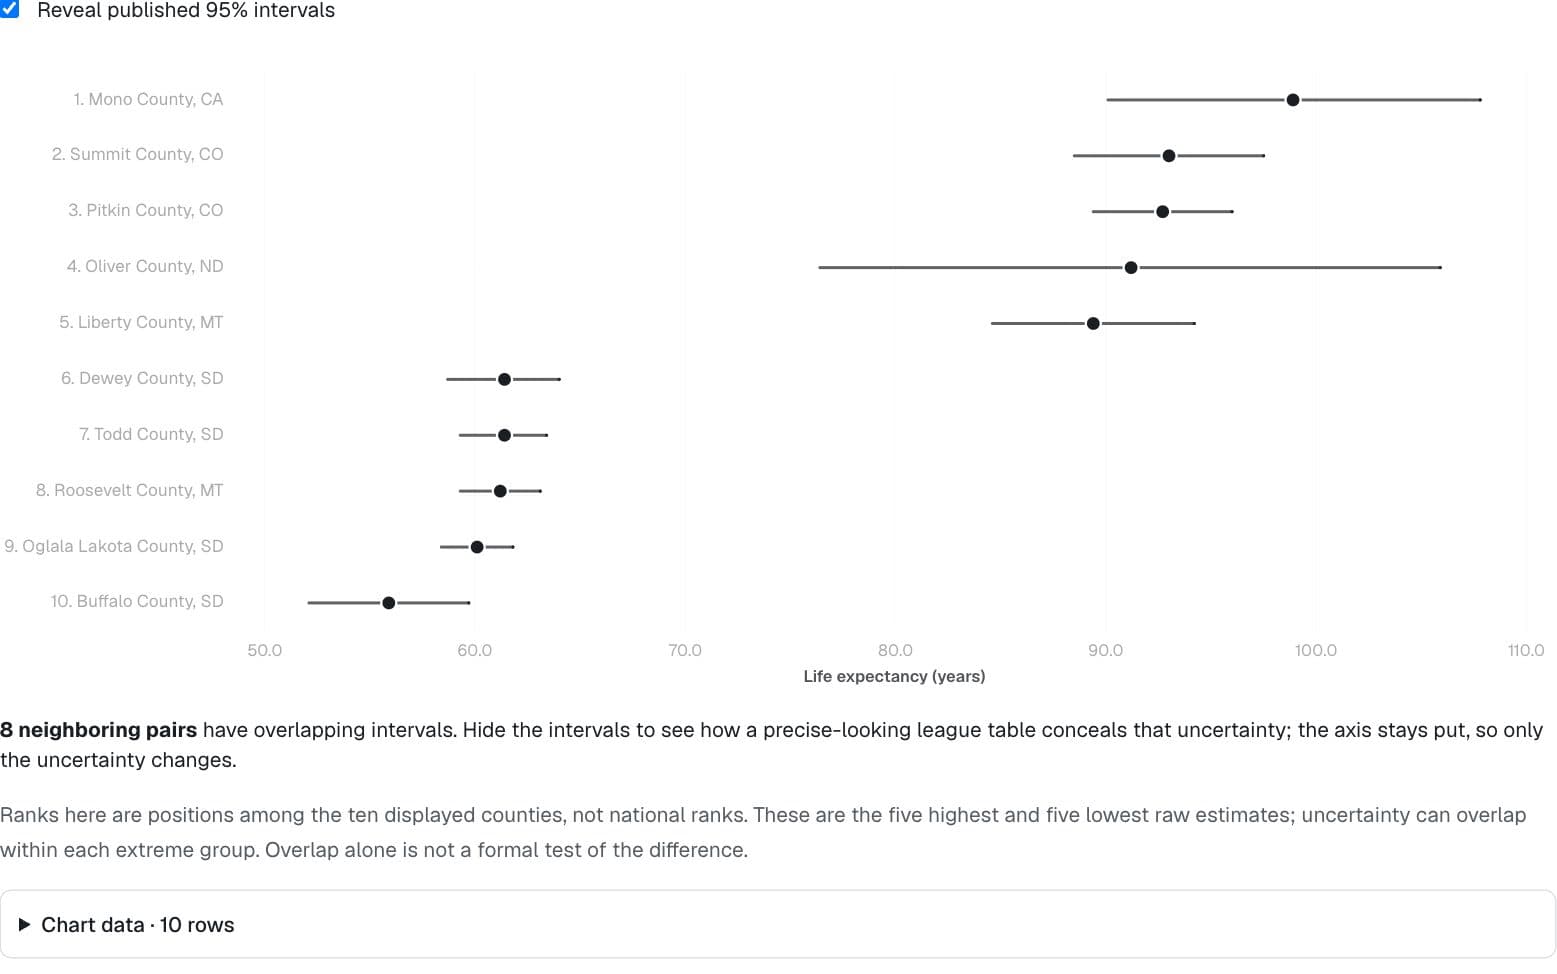
Health · County Health Rankings & Roadmaps 2024, UW Population Health Institute
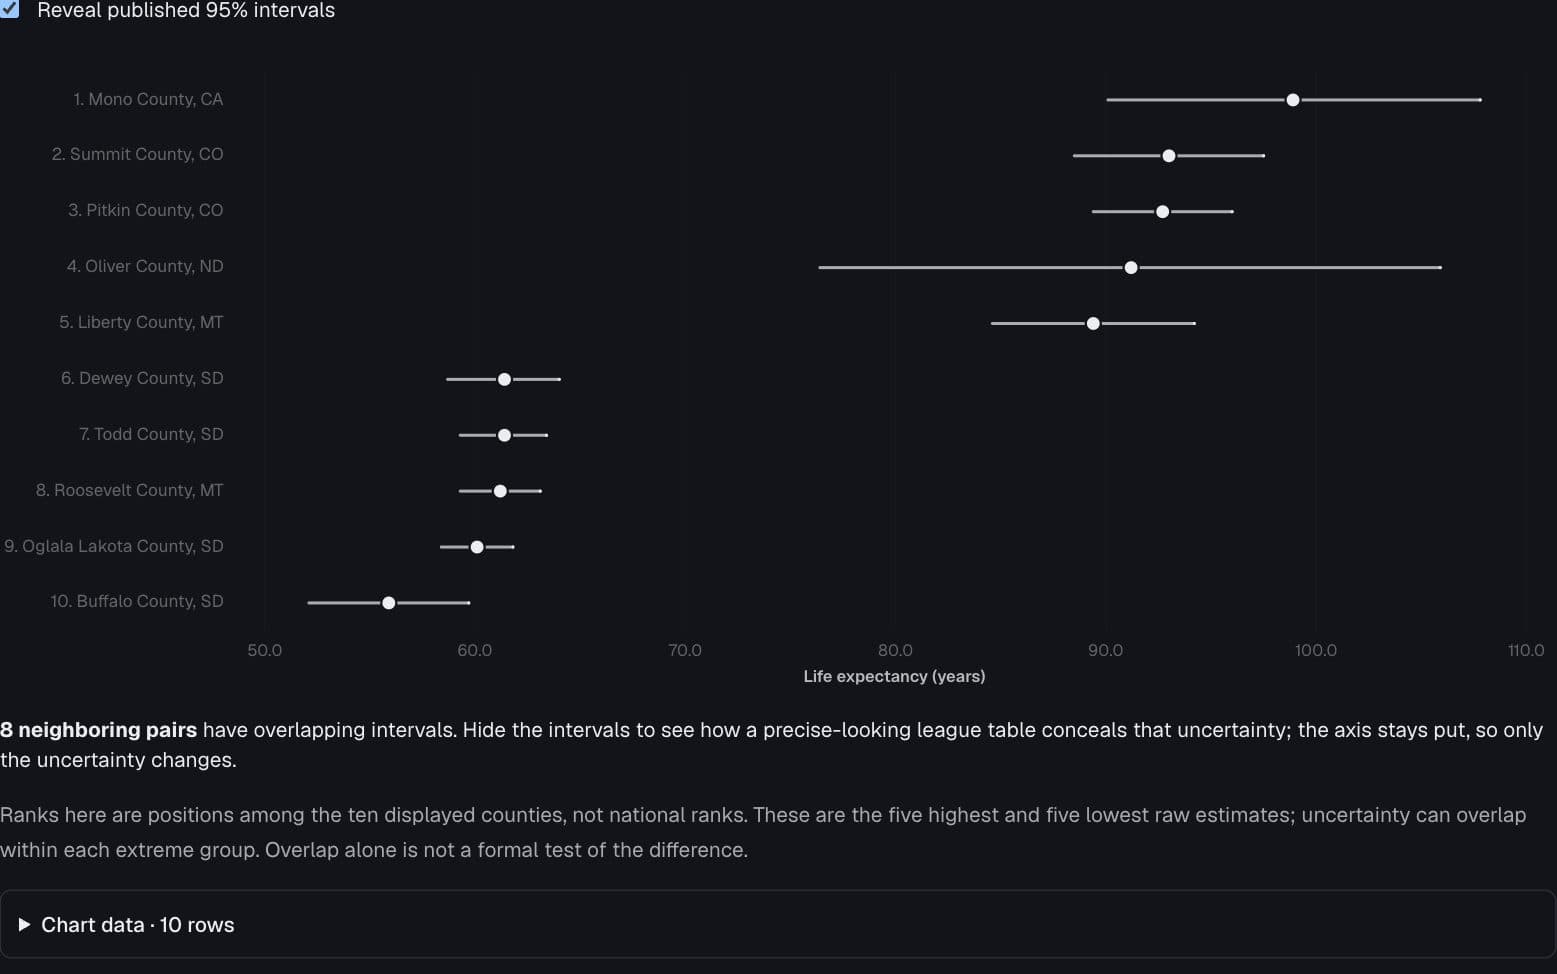
The league table dissolves
What happens to a confident ranking when its intervals appear?
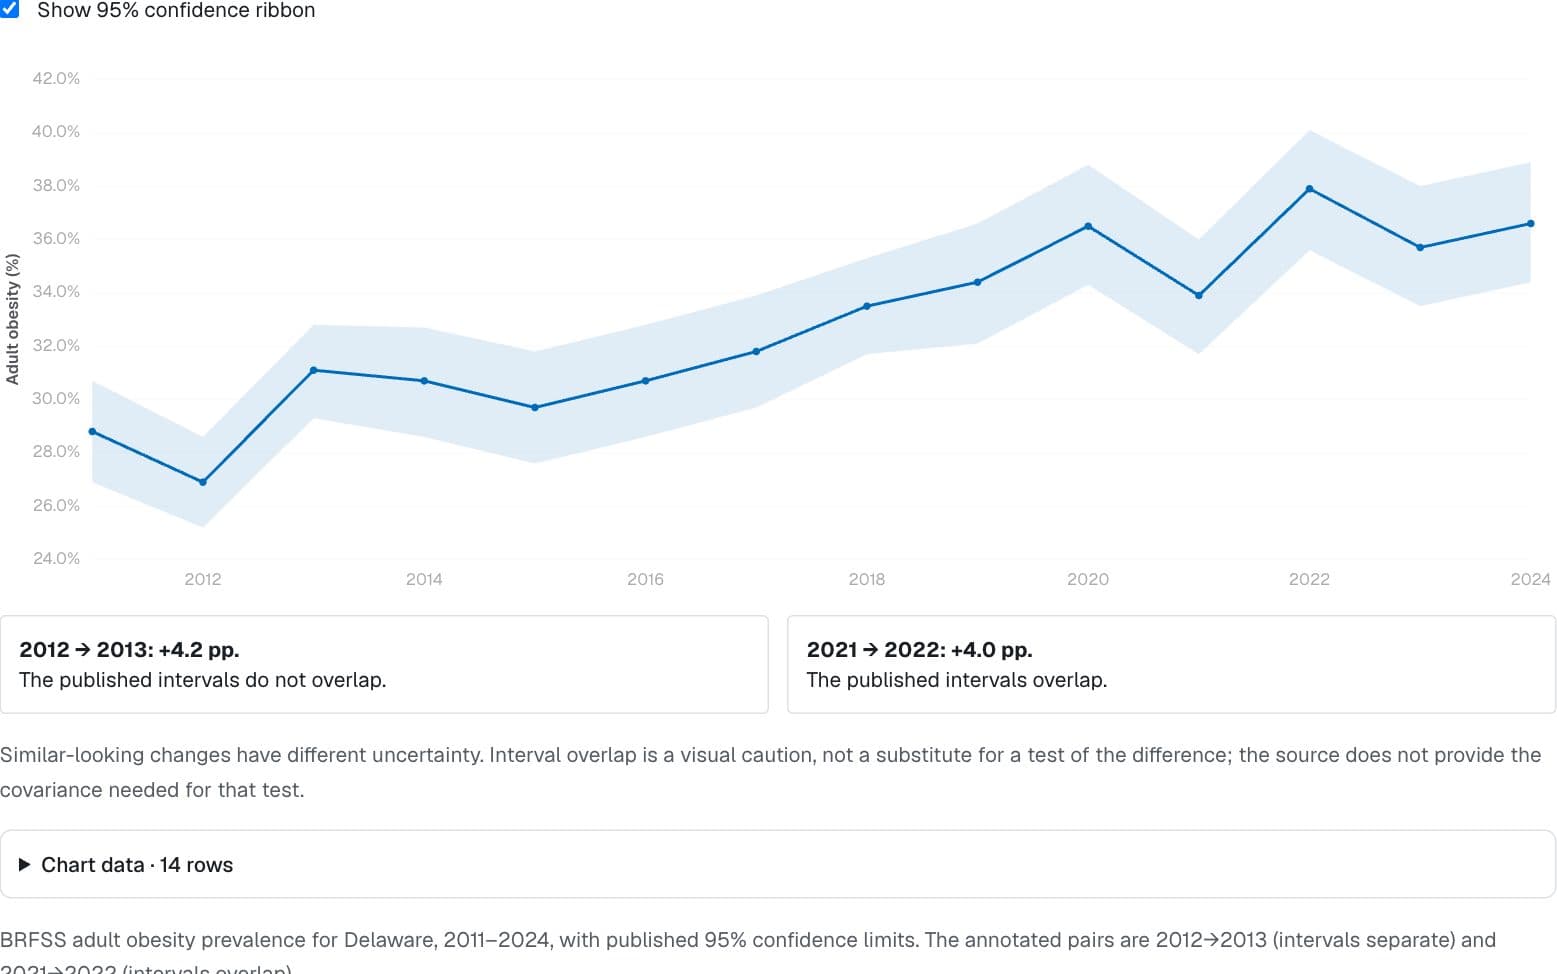
Health · CDC BRFSS Prevalence Data, 2011–present (data.cdc.gov dttw-5yxu)
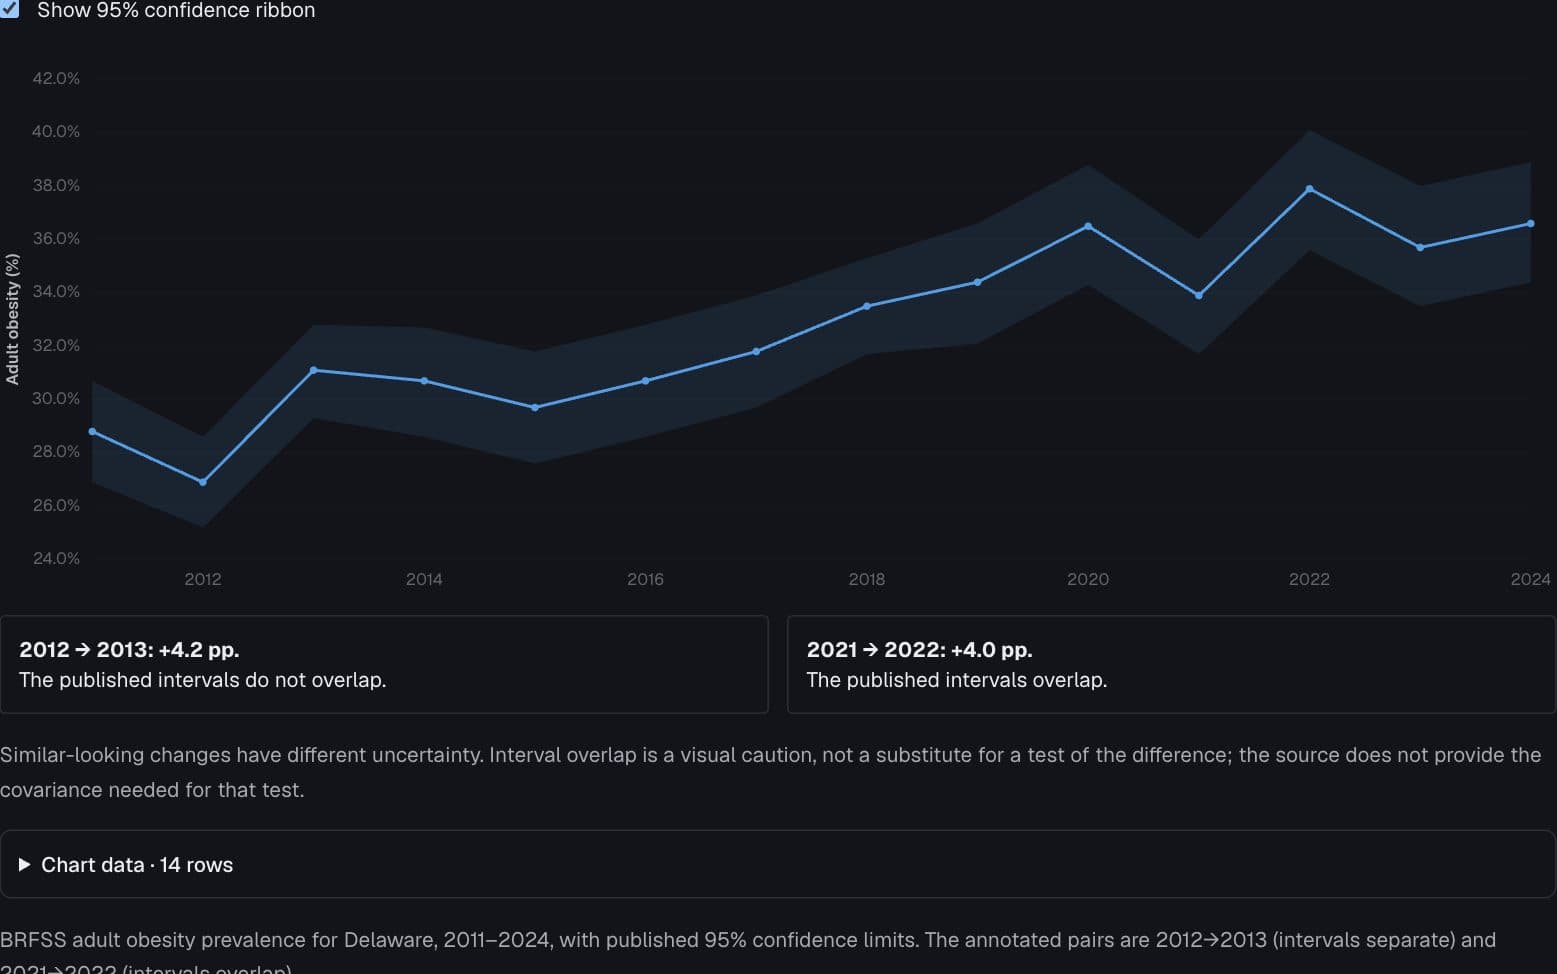
Similar jumps, different uncertainty
Why can two four-point jumps deserve different readings?
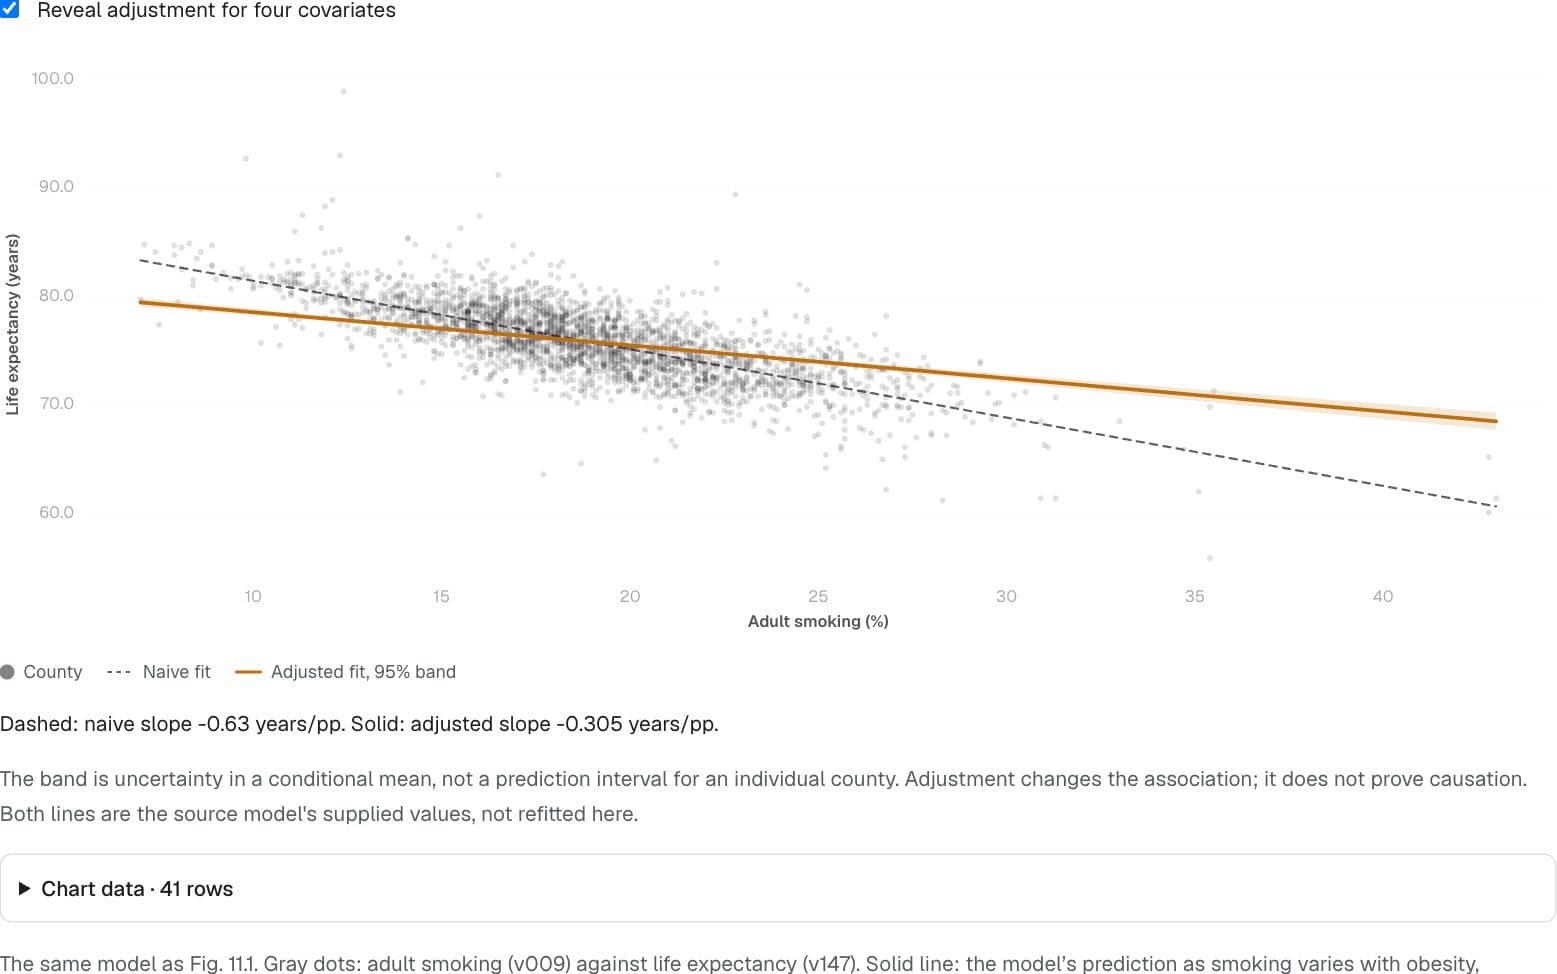
Health · County Health Rankings & Roadmaps 2024, UW Population Health Institute
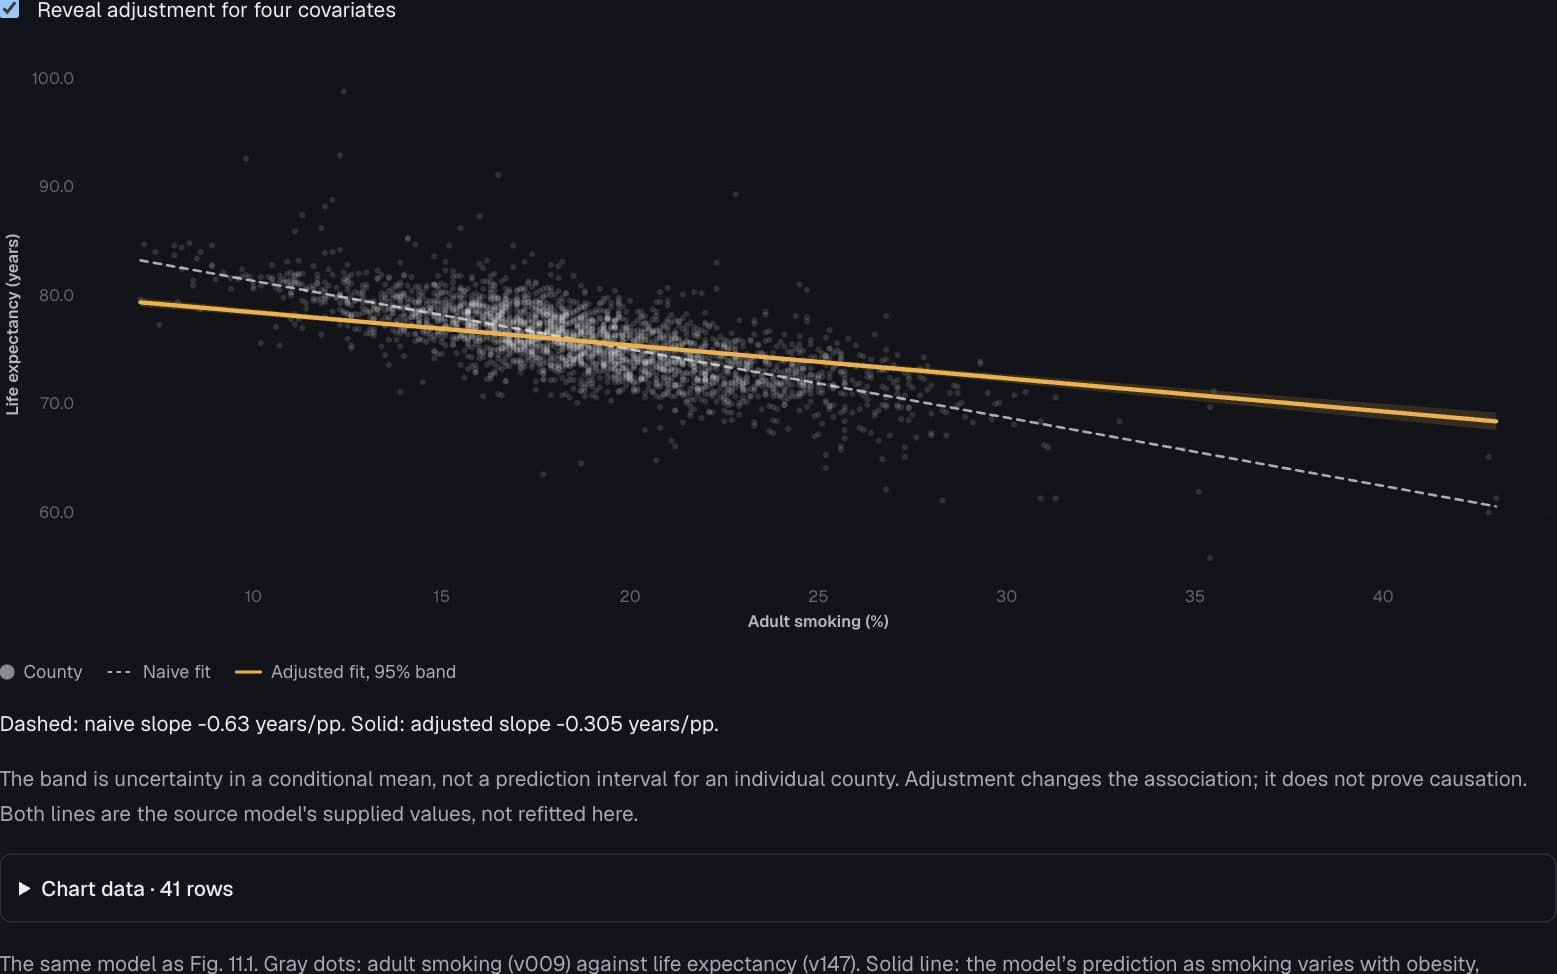
Adjustment changes the slope
How much of the smoking association remains with four covariates held fixed?
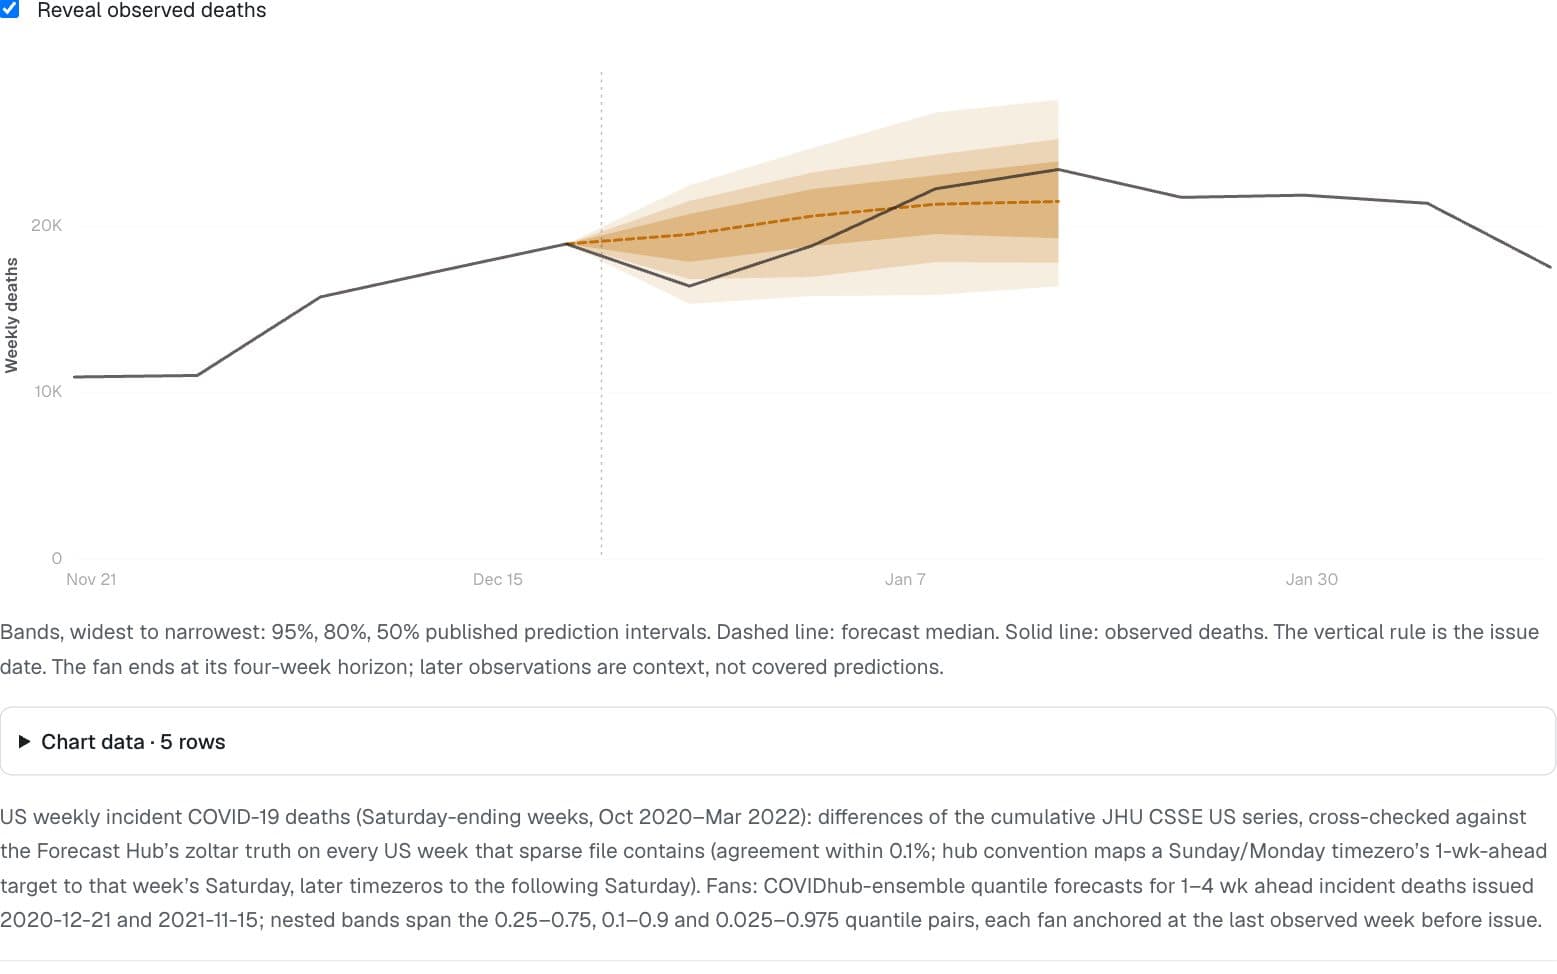
Health · Cramer EY et al. "The United States COVID-19 Forecast Hub dataset." Scientific Data 9, 462 (2022).
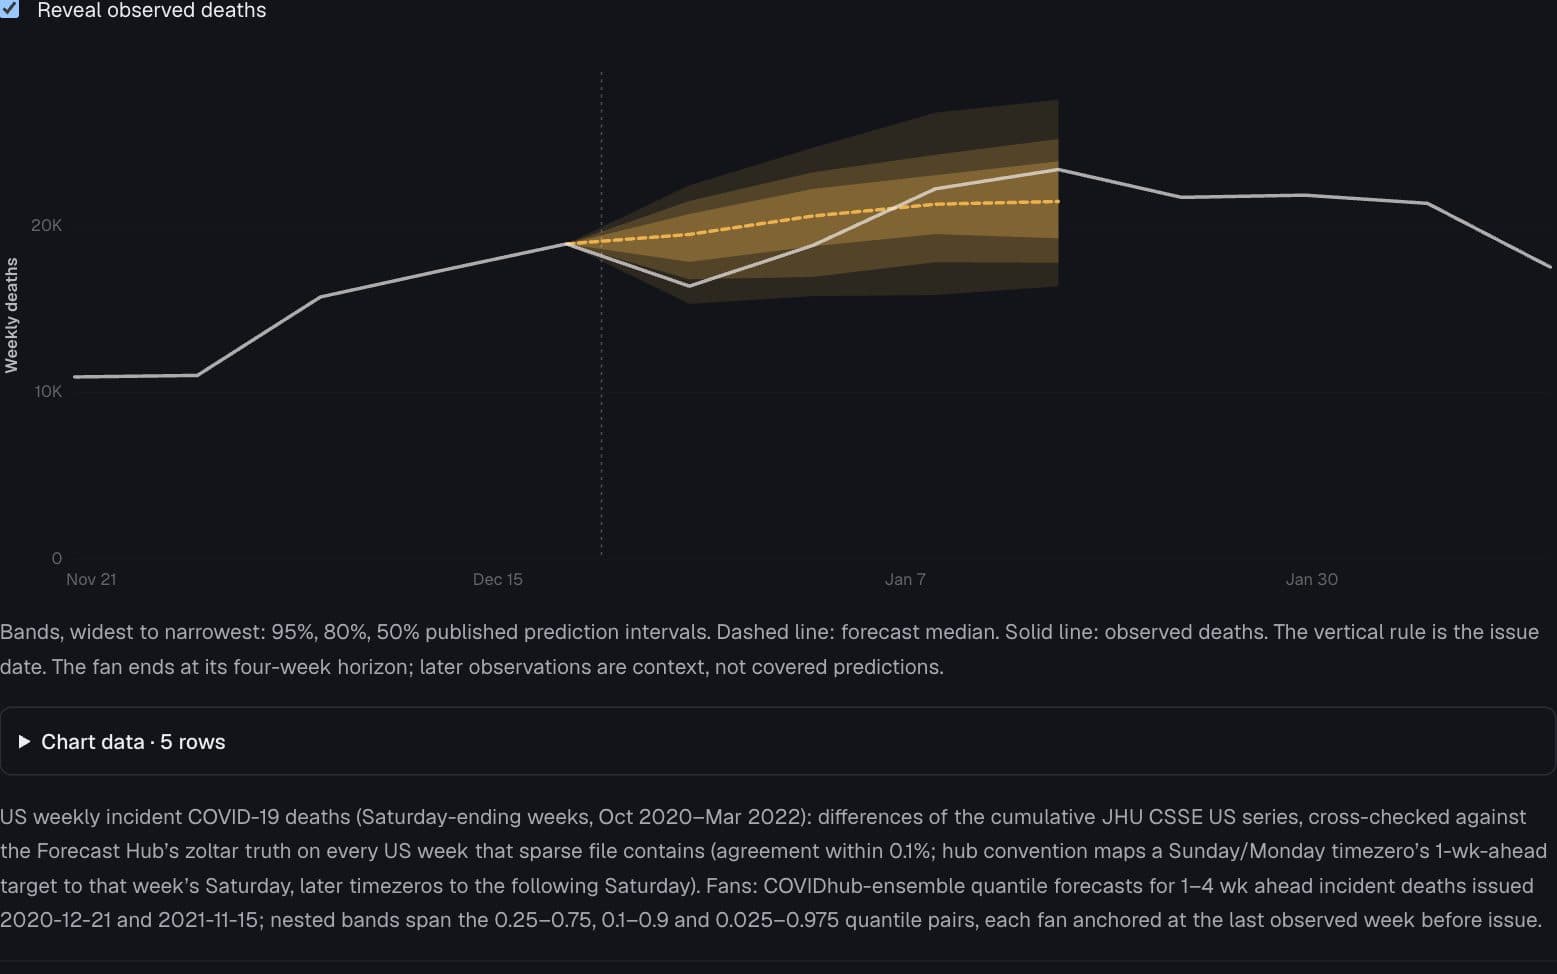
A forecast comes with doubt
Where did observed deaths land relative to published forecast intervals?
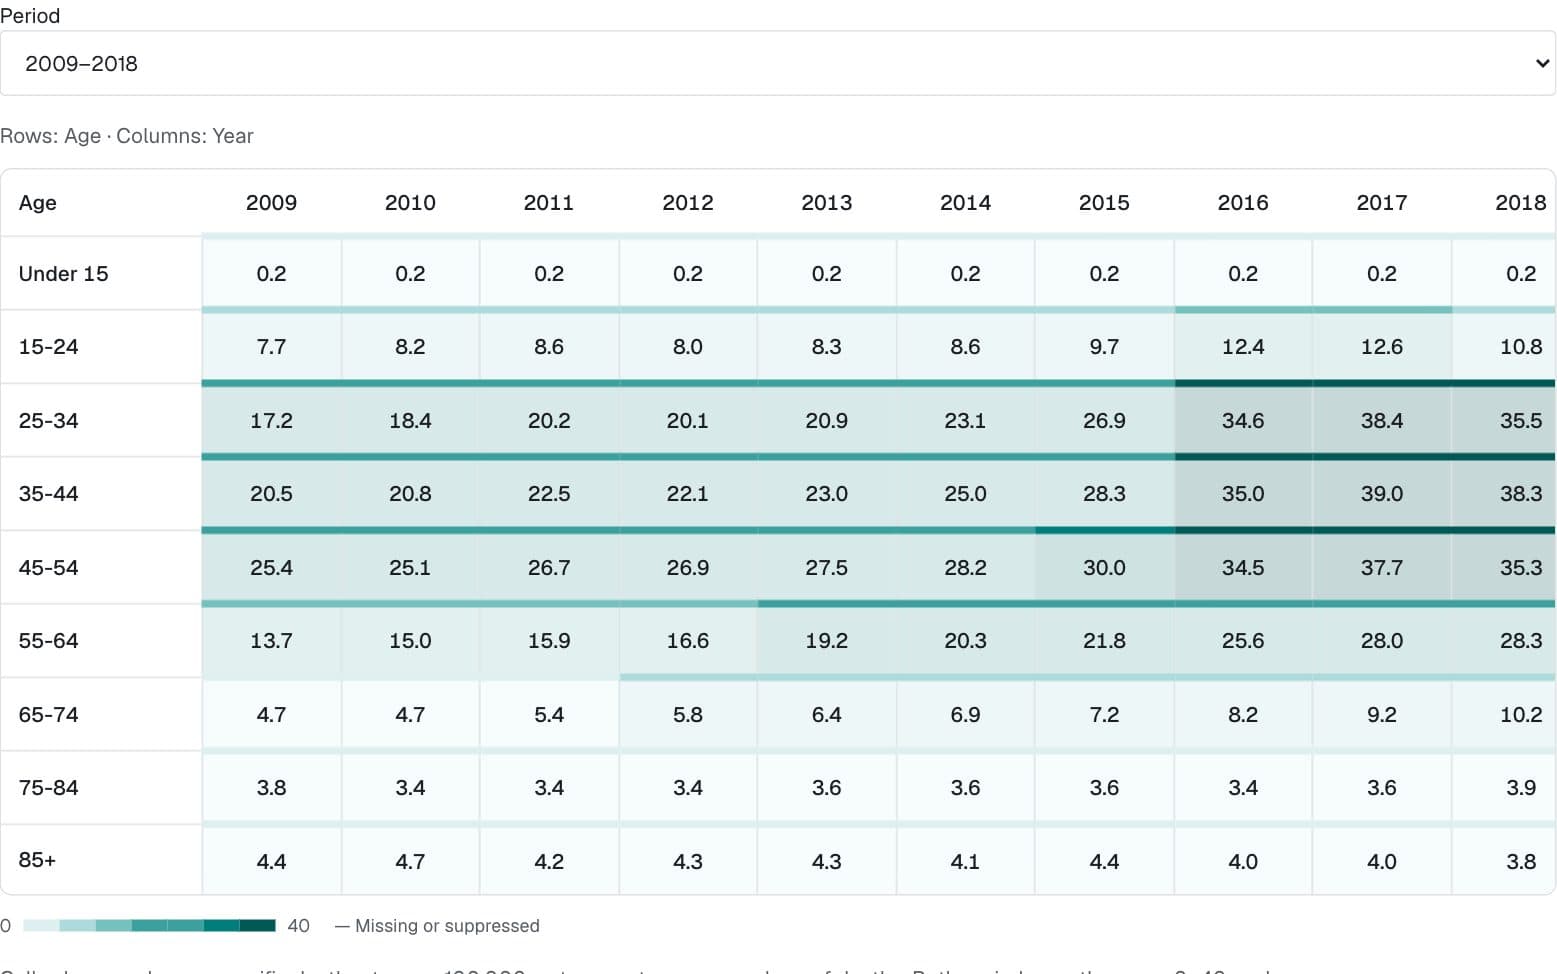
Health · NCHS, "Drug overdose death rates, by drug type, sex, age, race, and Hispanic origin: United States" (data.cdc.gov 95ax-ymtc)
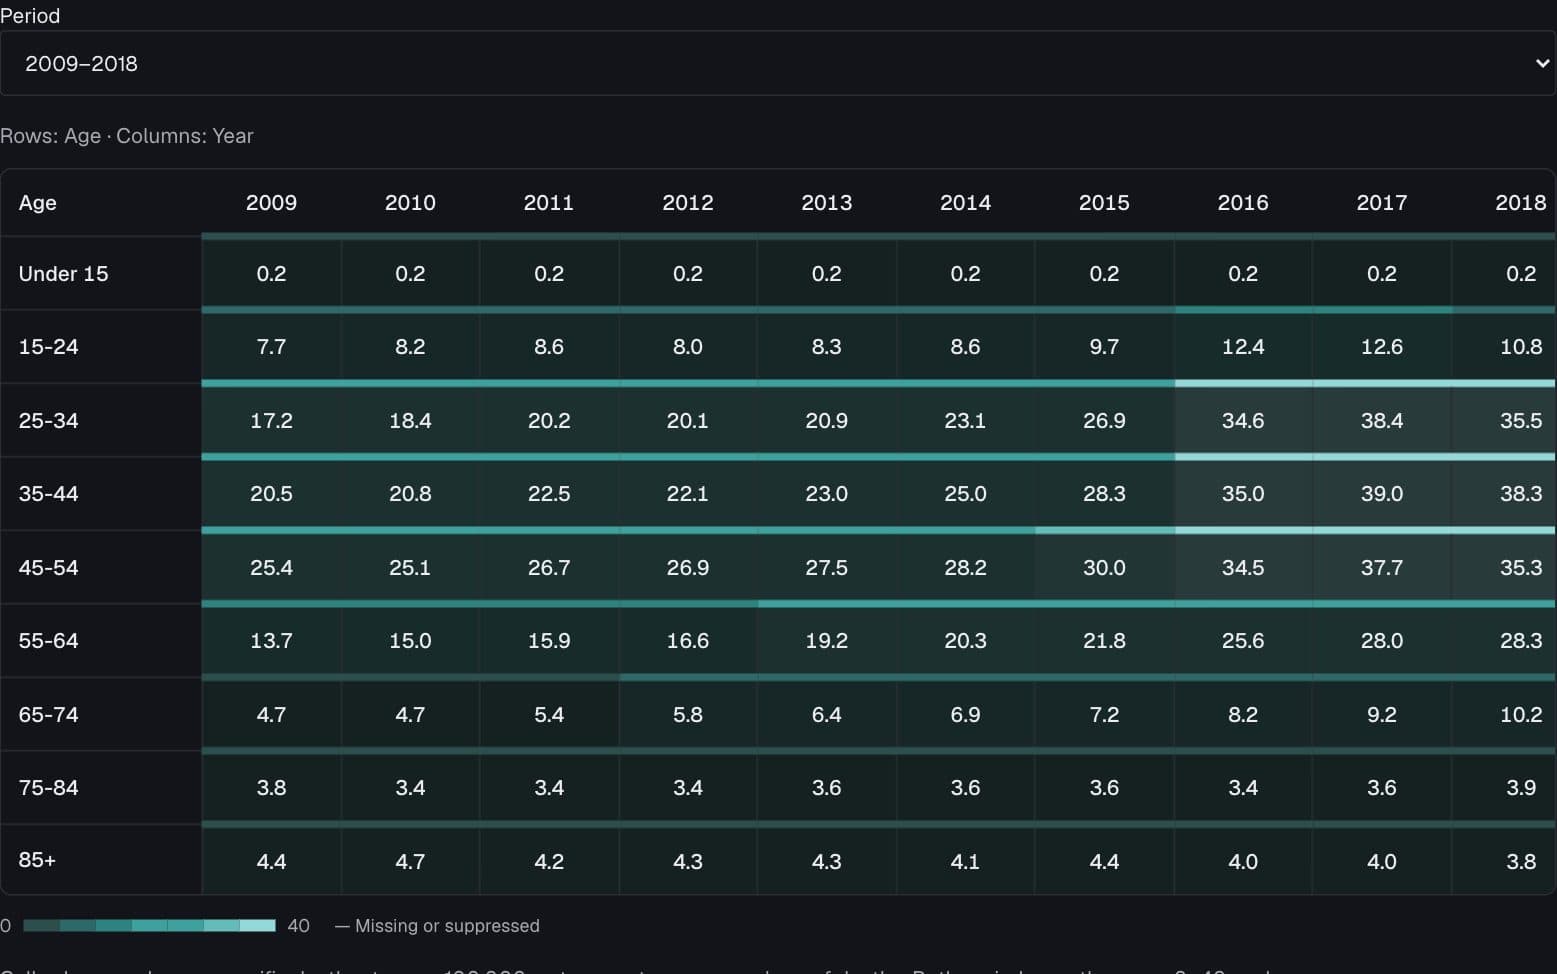
The overdose wave across ages
Which age groups saw the largest changes in overdose mortality?
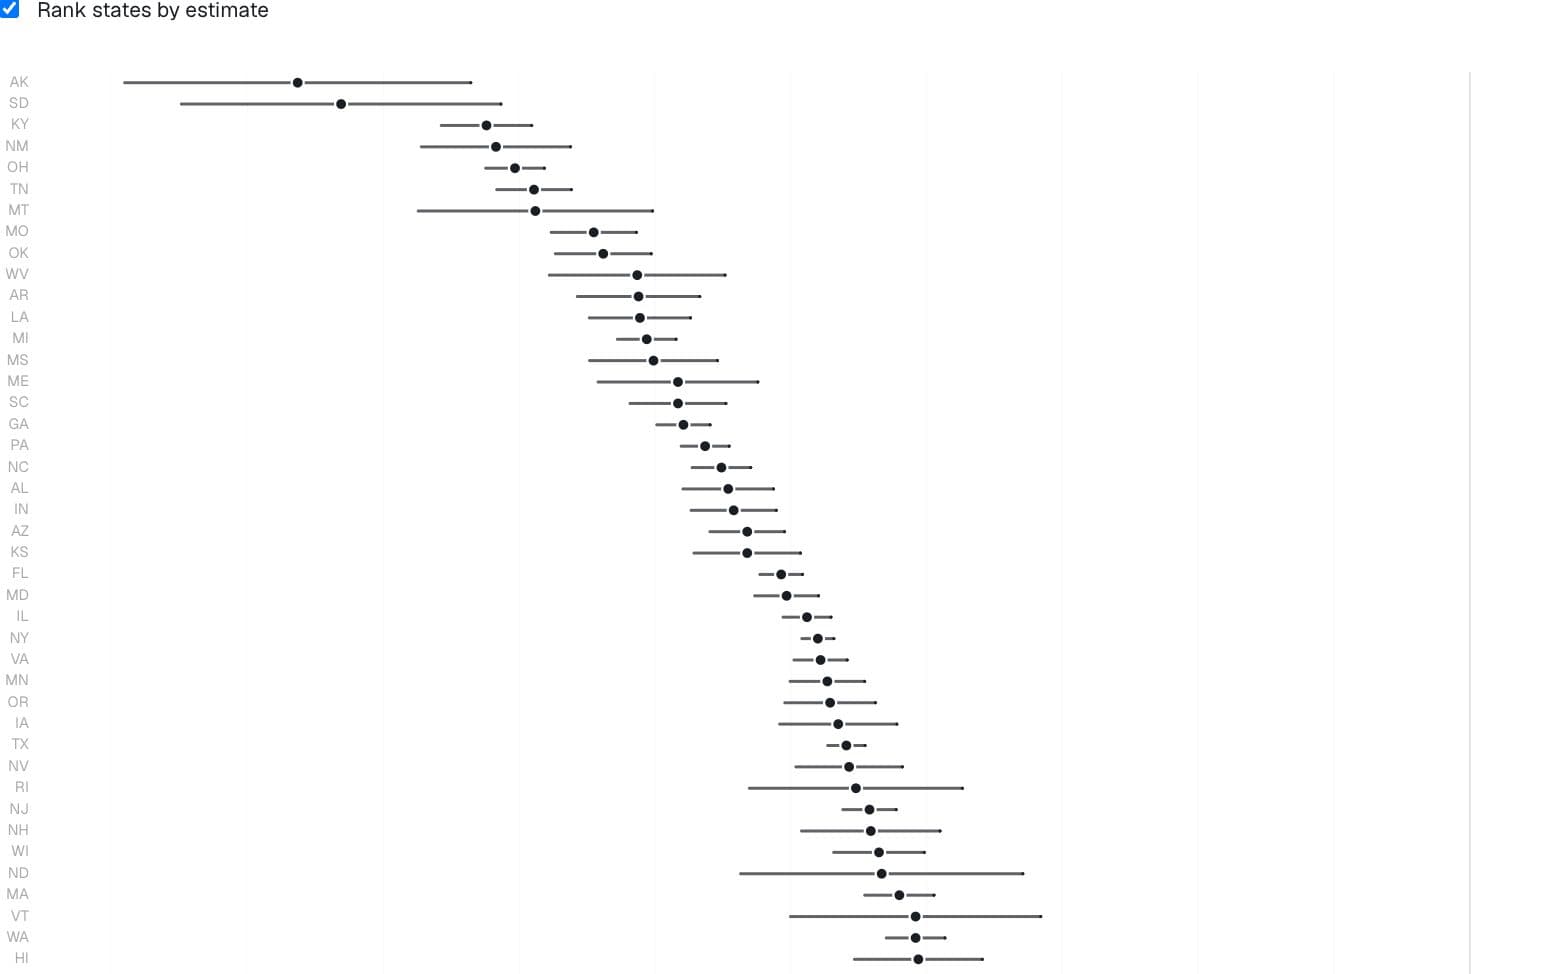
Health · Captured state income-gradient estimates
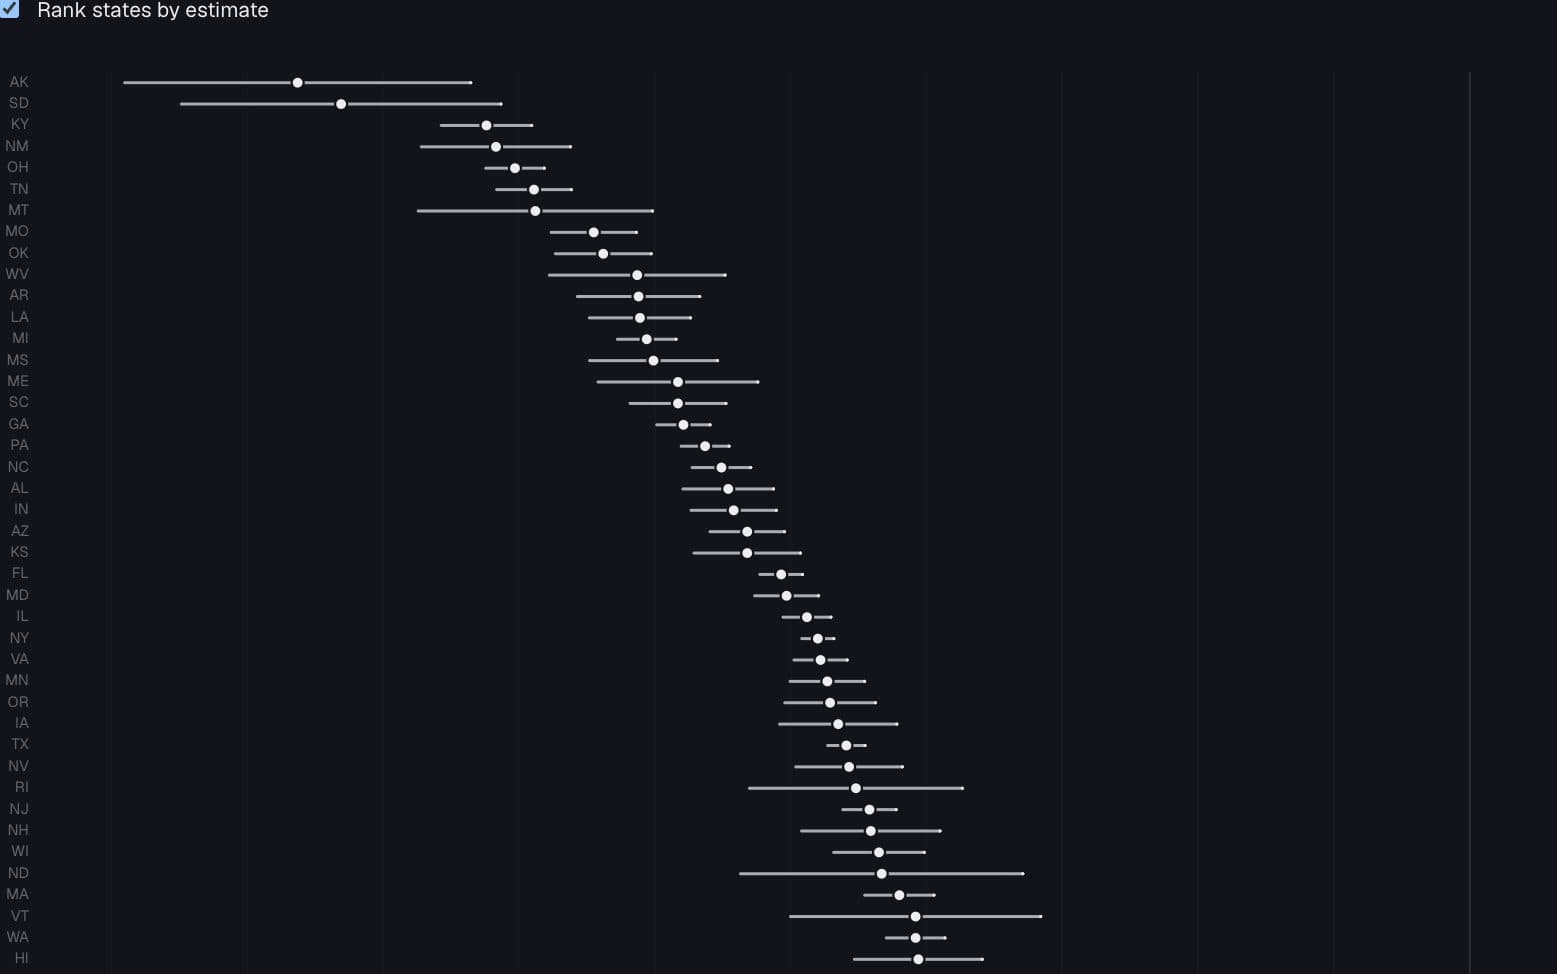
The rank is not the result
Do state income gradients remain distinct once uncertainty is shown?
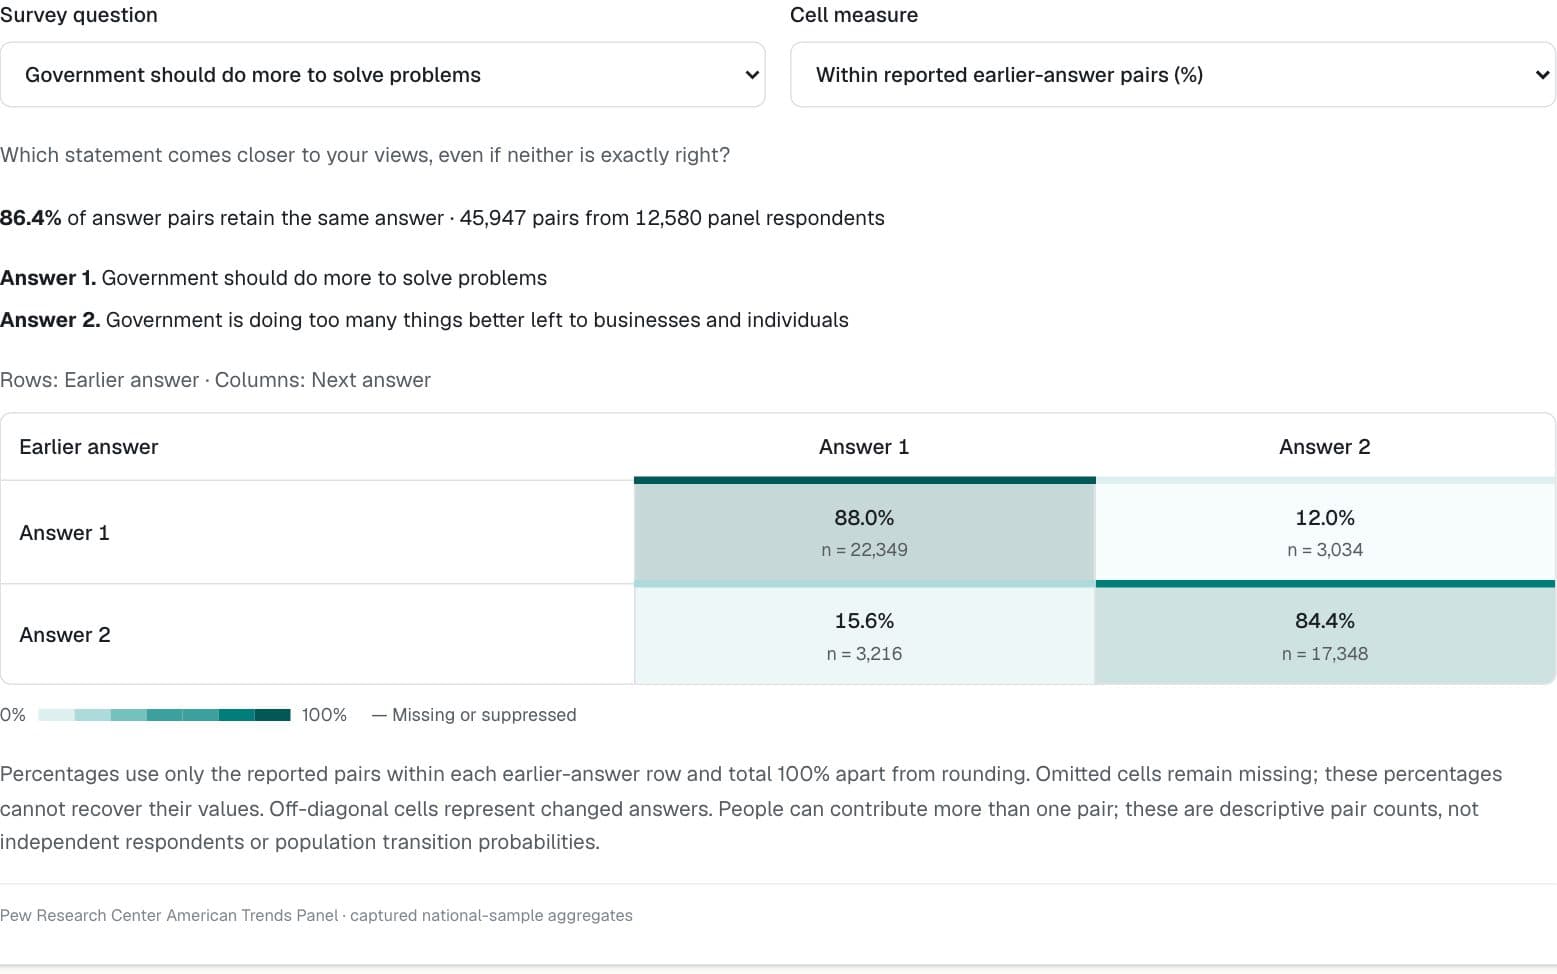
Politics & public opinion · Pew Research Center American Trends Panel
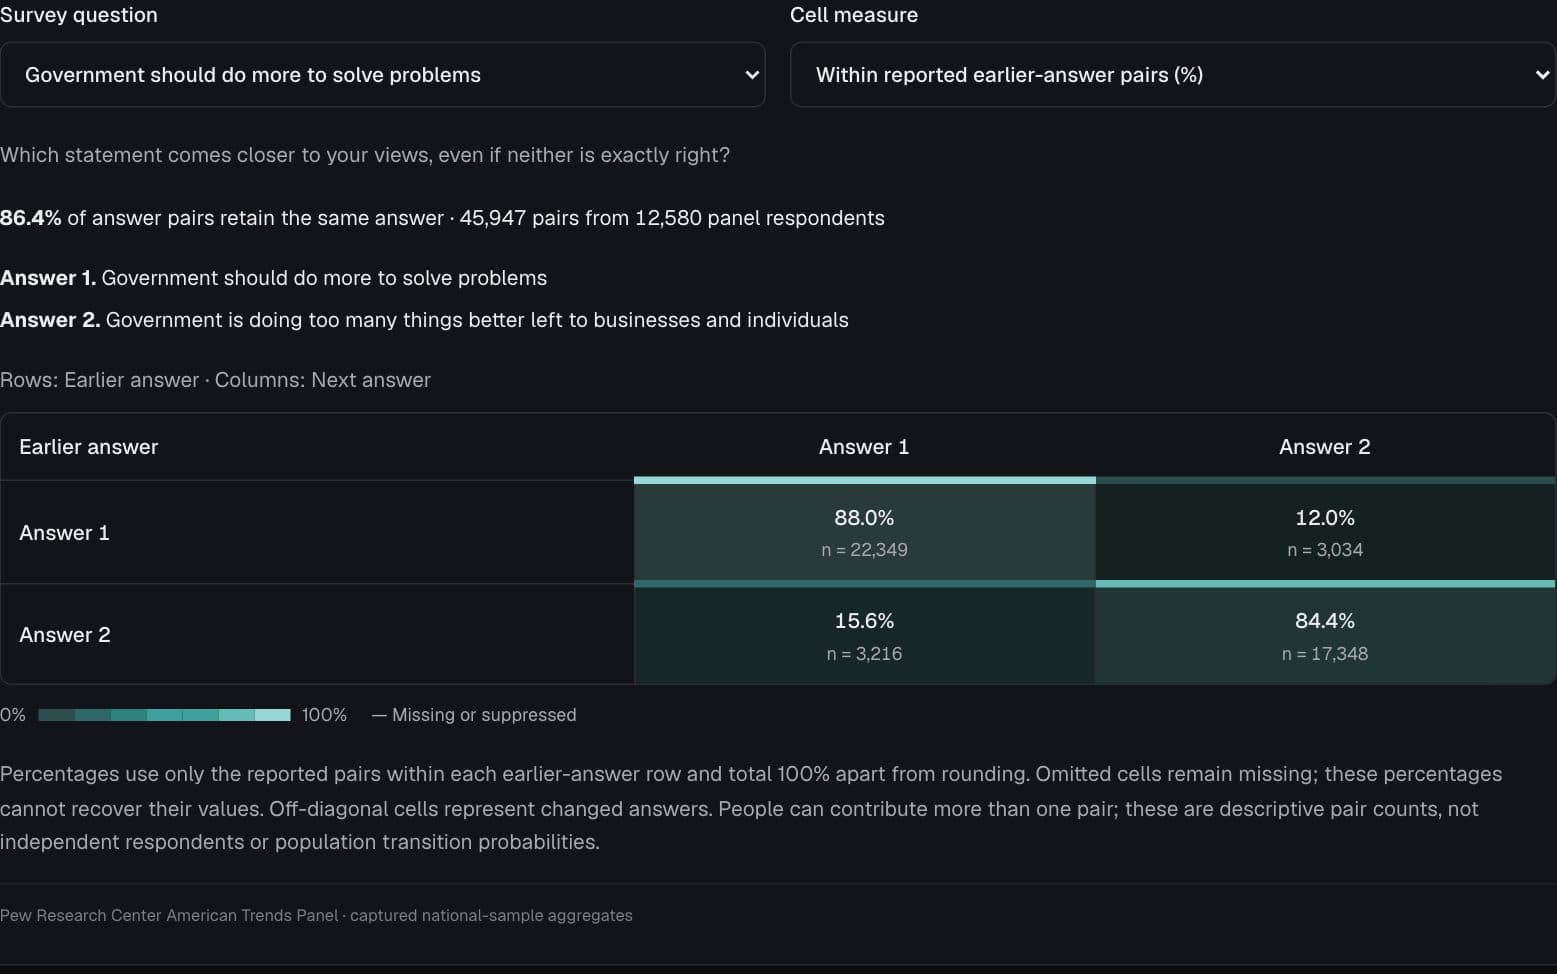
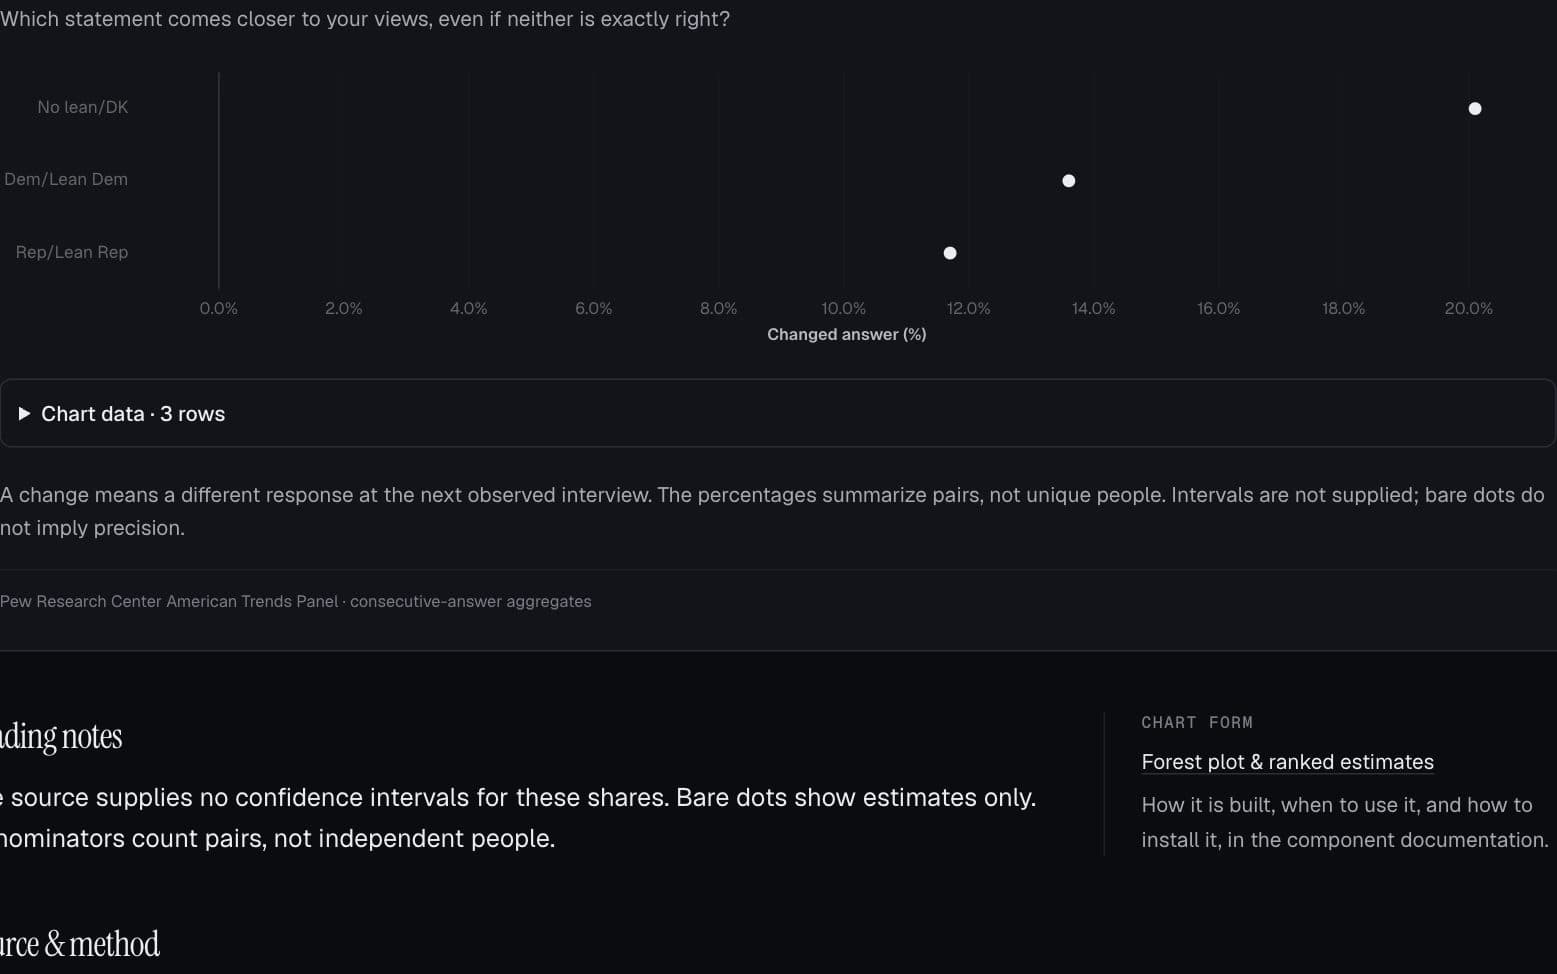
When people change their minds
Which answers persist, and which answers do people move toward at their next interview?
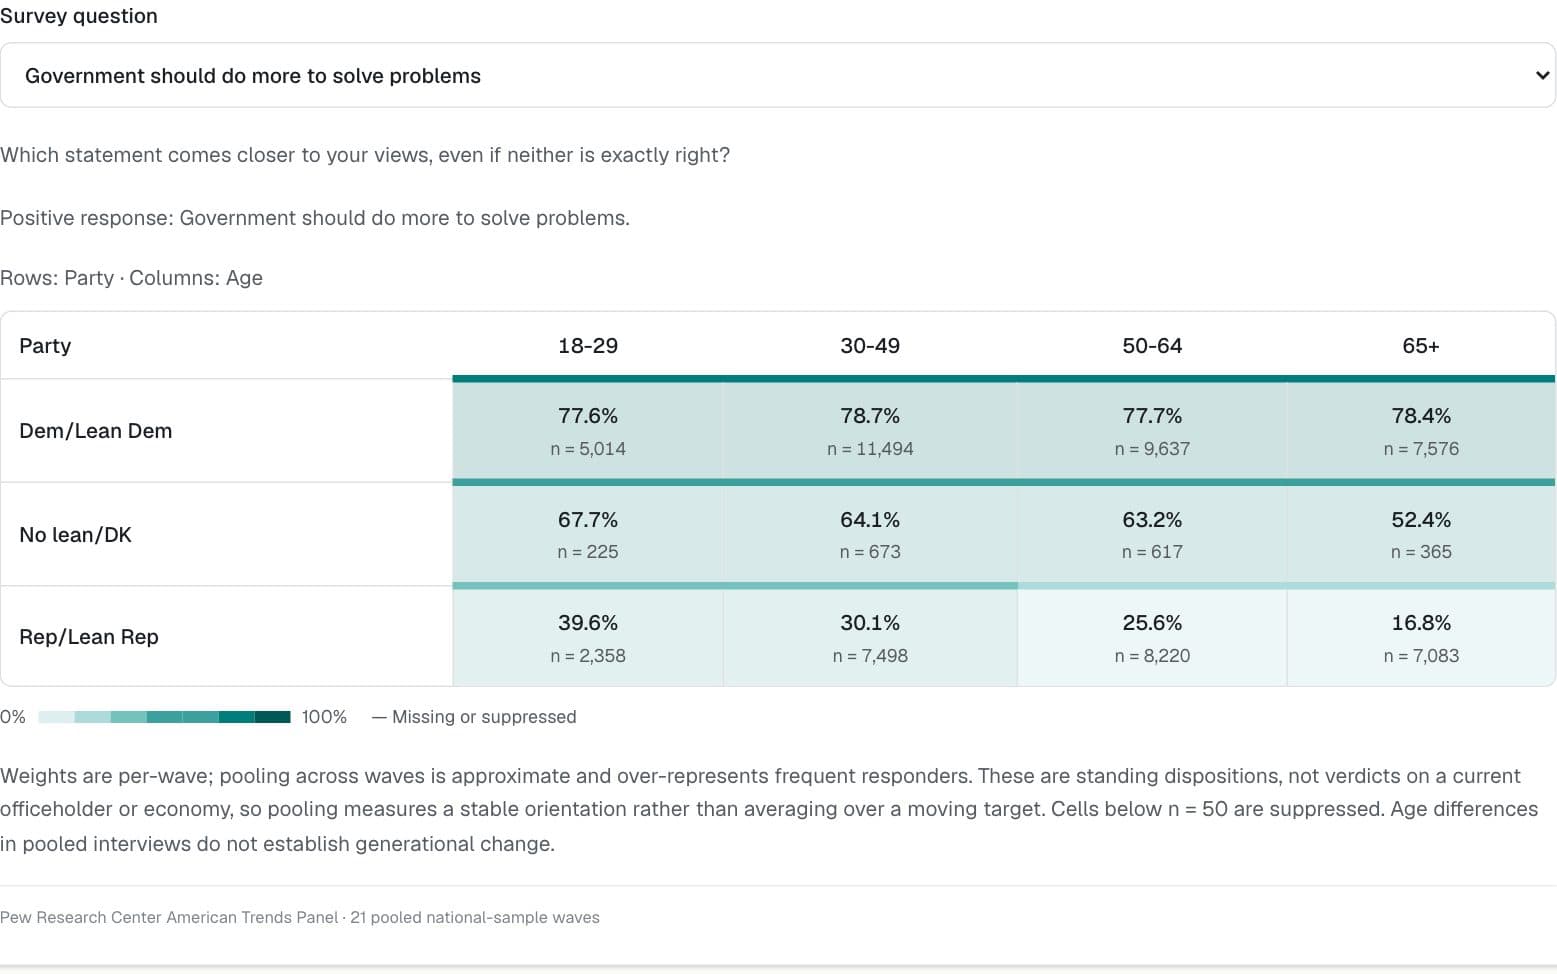
Politics & public opinion · Pew Research Center American Trends Panel
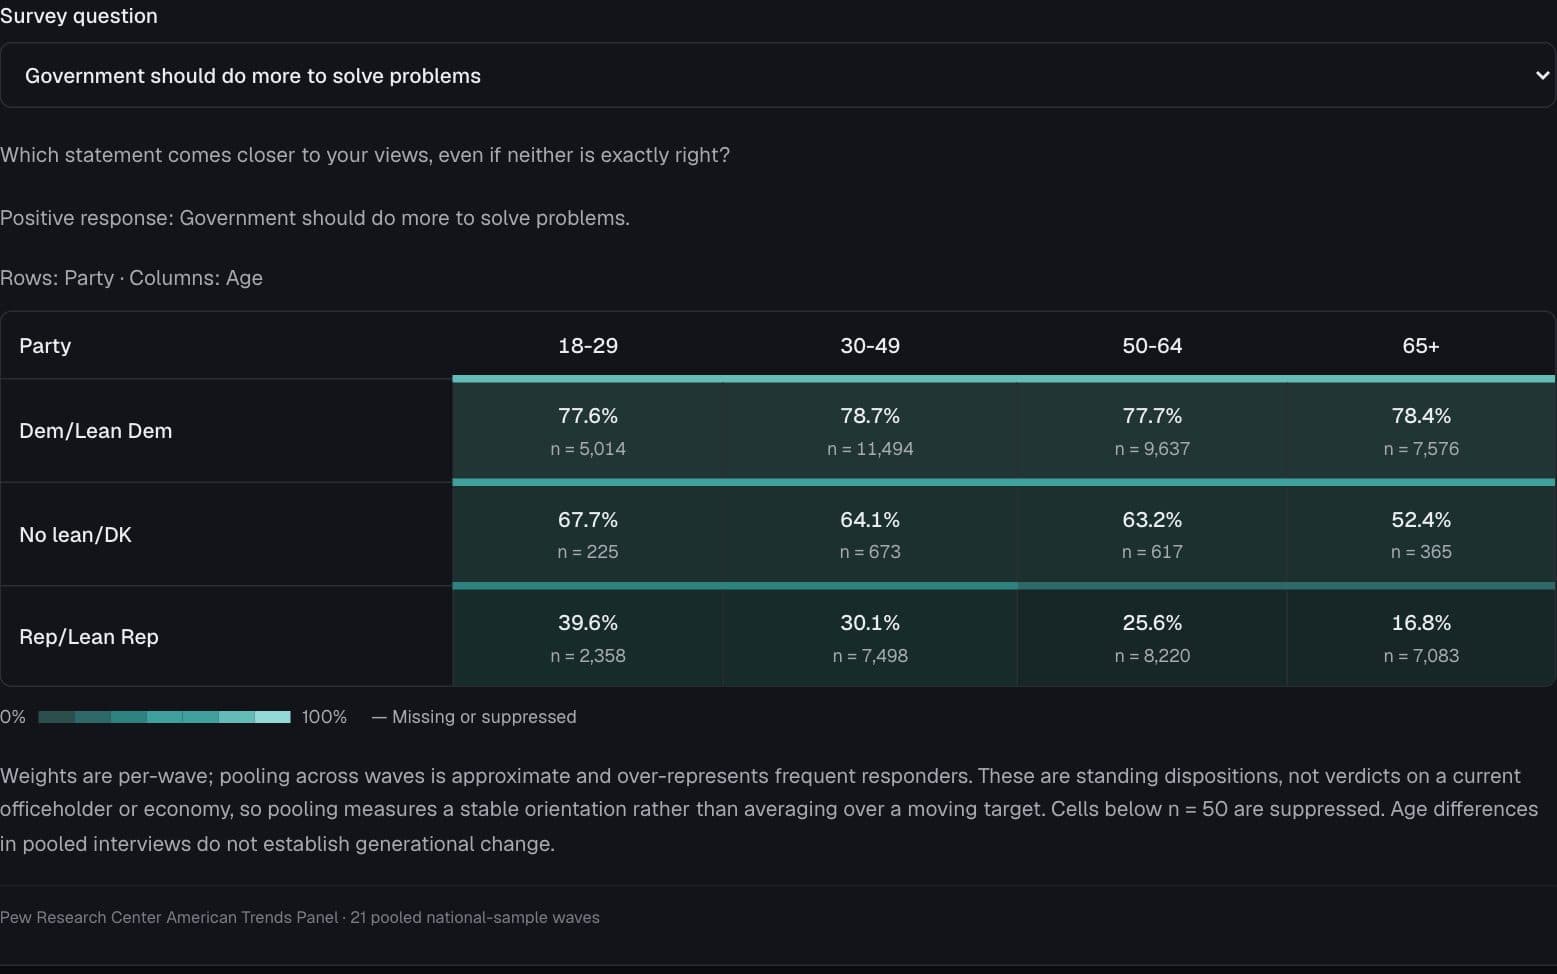
Age divides, within party lines
Do age differences look the same among Democrats and Republicans?
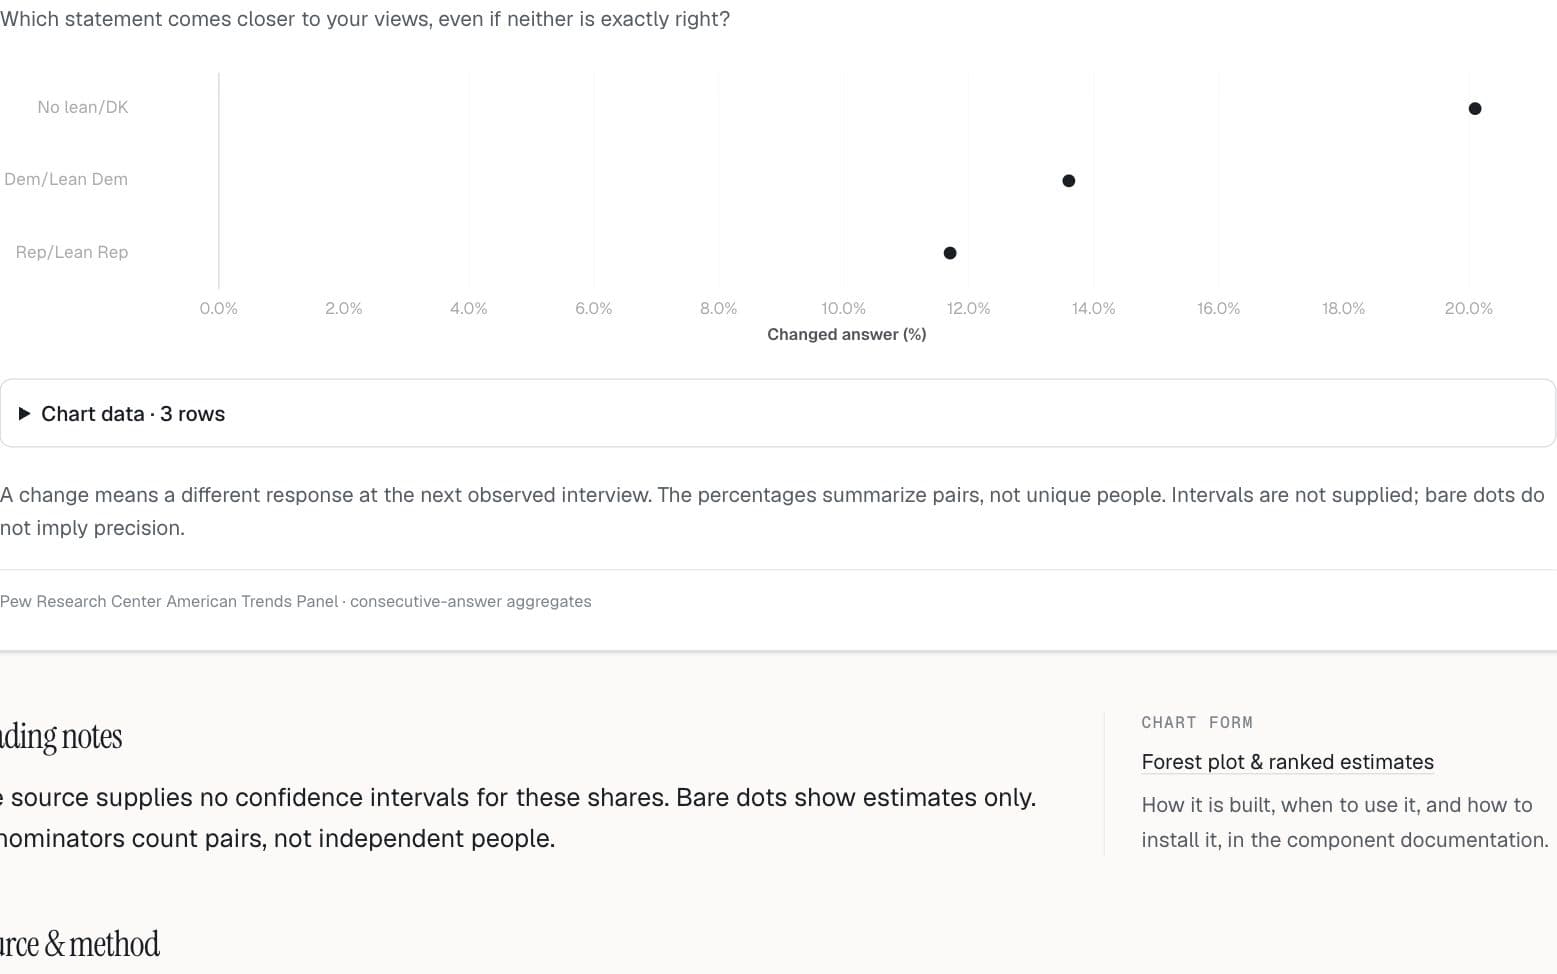
Politics & public opinion · Pew Research Center American Trends Panel
Who gives a different answer next time?
How does the frequency of changed answers vary across demographic groups?
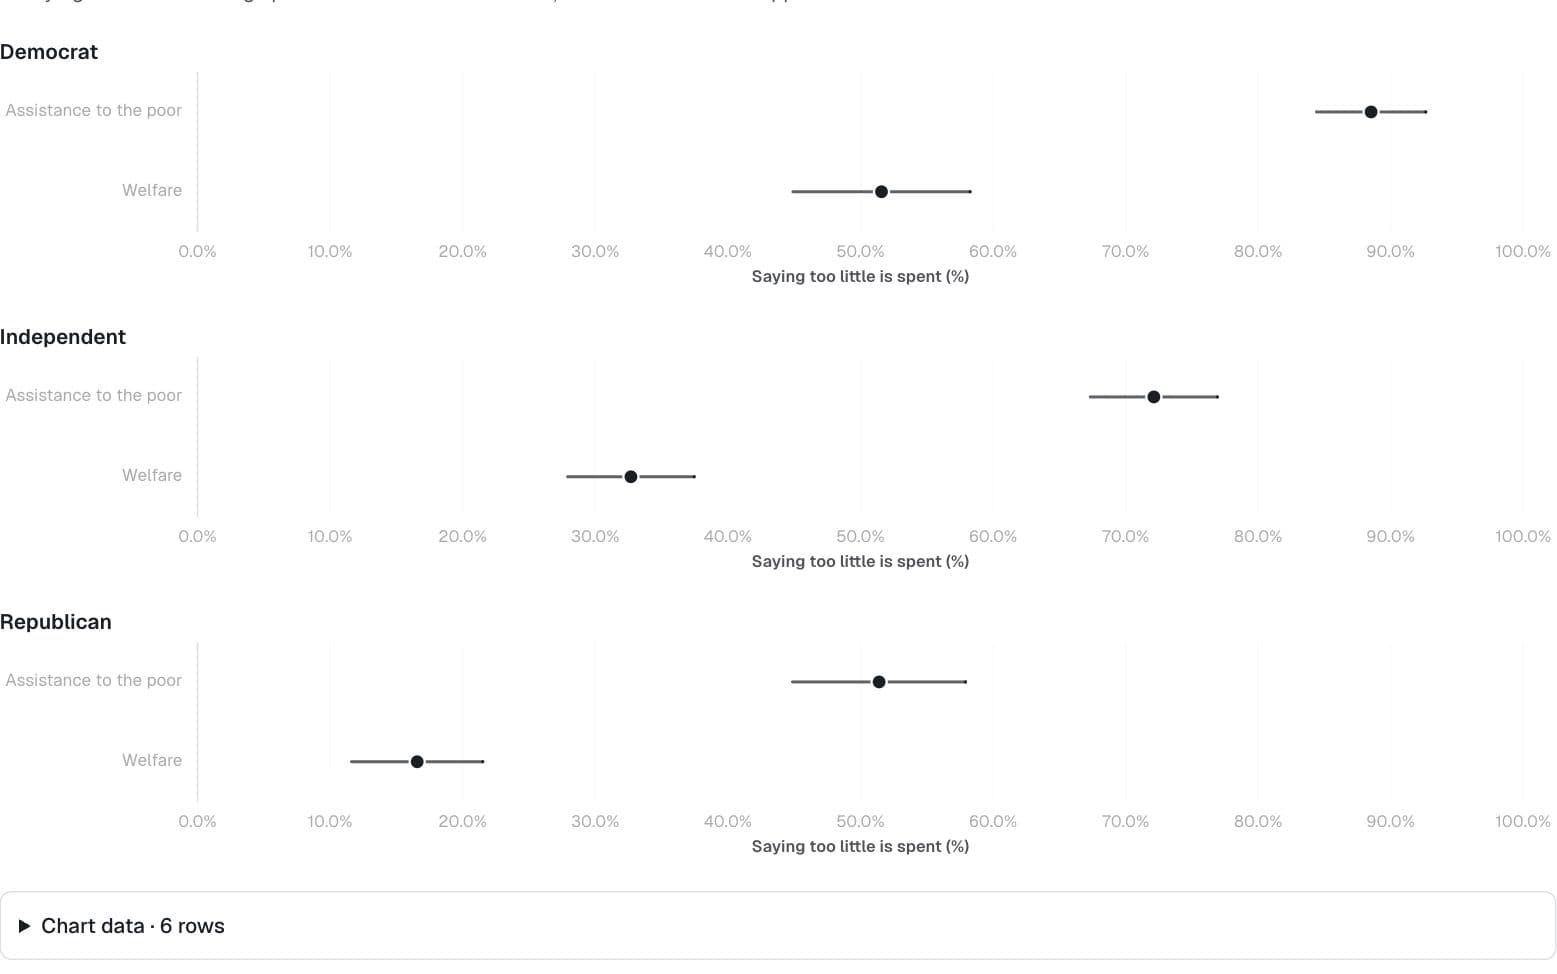
Politics & public opinion · General Social Survey
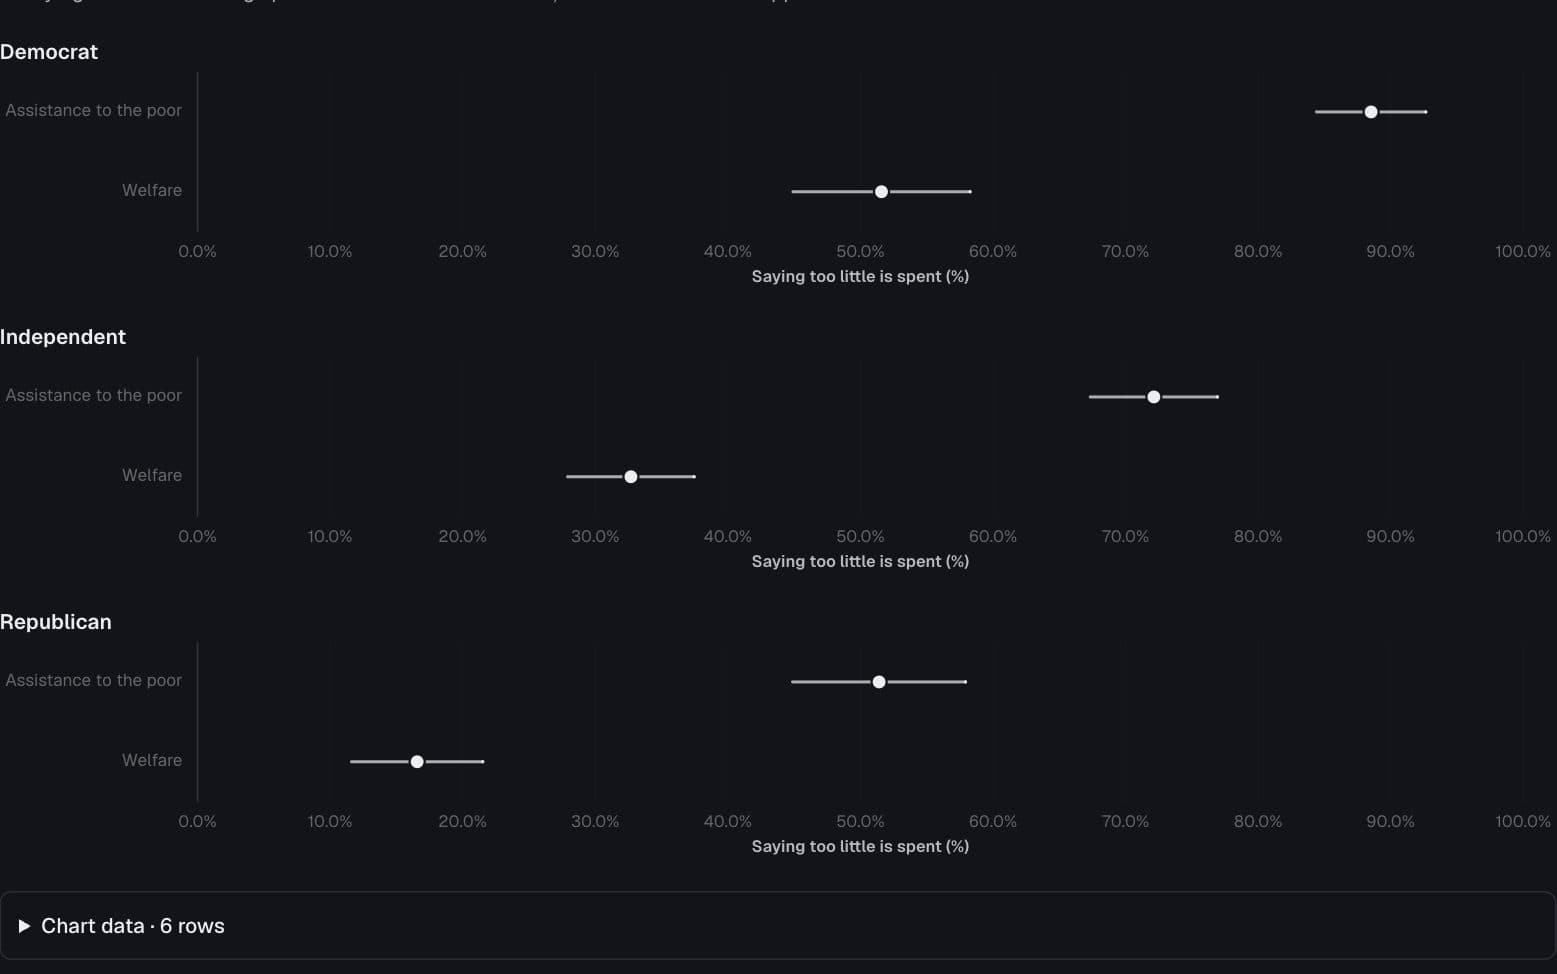
“Welfare” or “assistance to the poor”?
How different are spending priorities when the survey uses a different label?
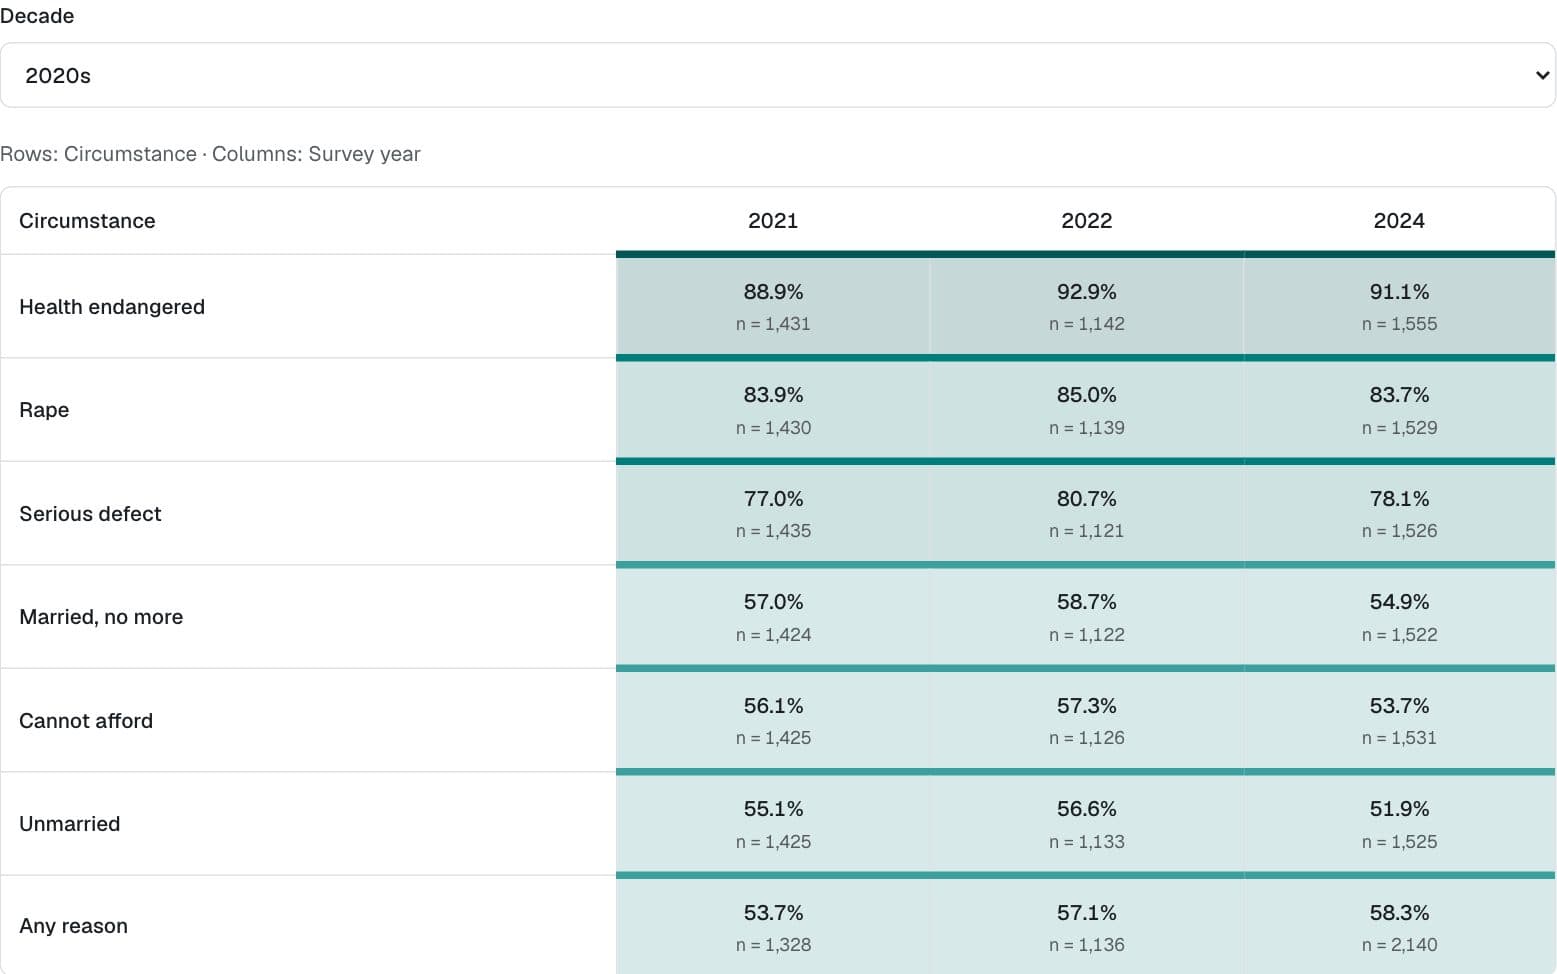
Politics & public opinion · General Social Survey
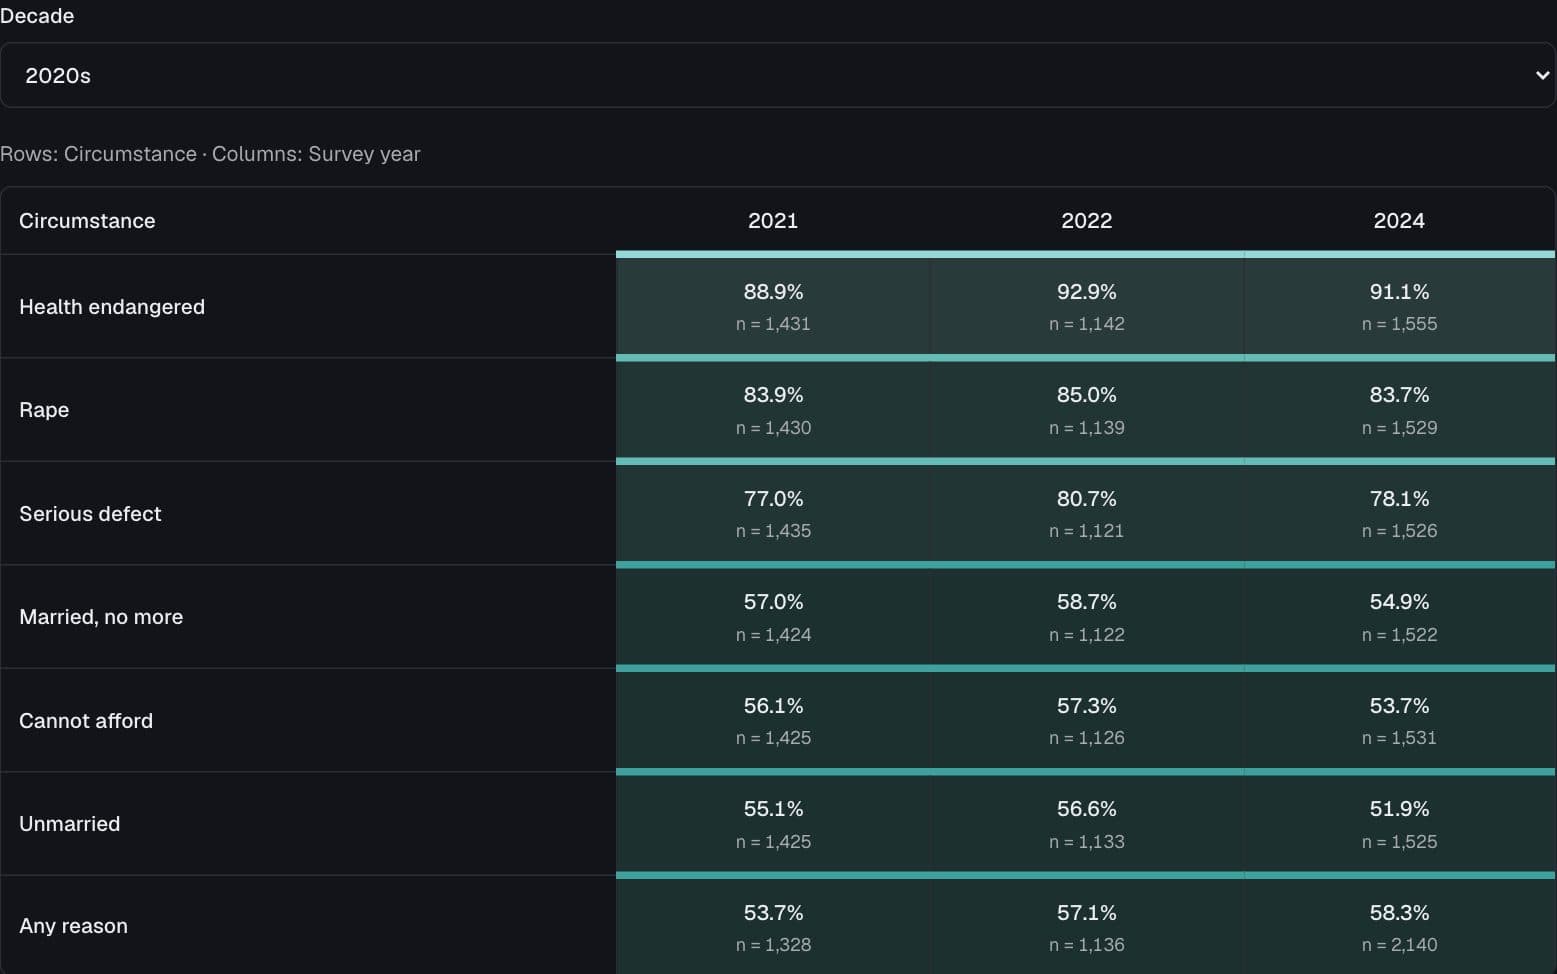
Seven circumstances, different answers
How does support for legal abortion depend on the circumstance and survey year?
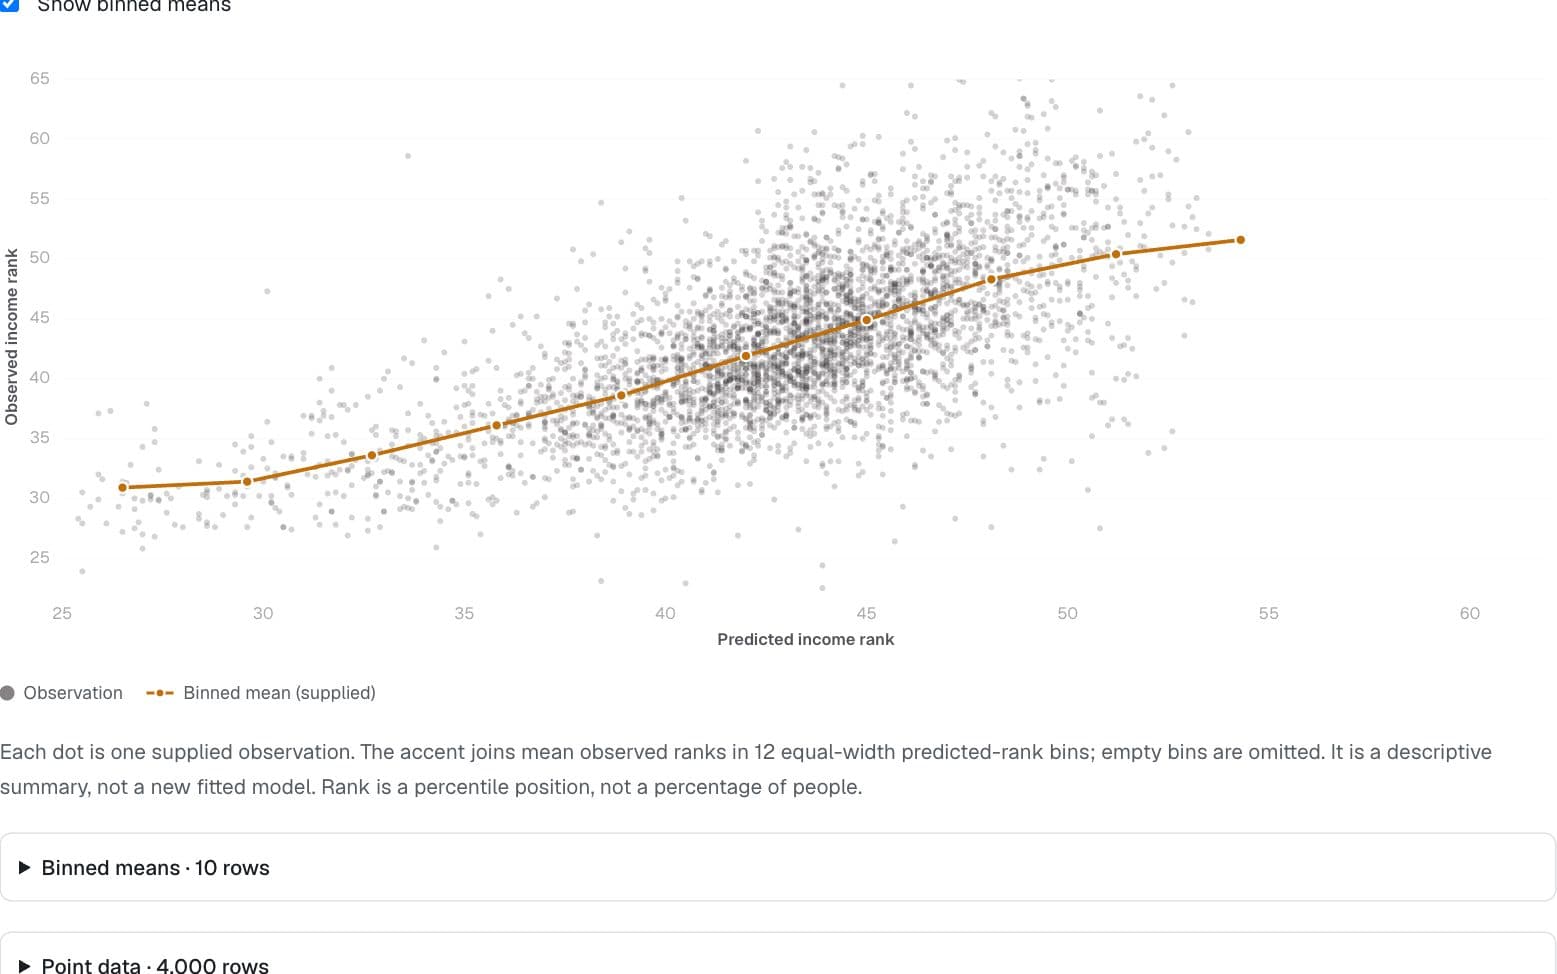
Society & world values · Opportunity Atlas × ACS
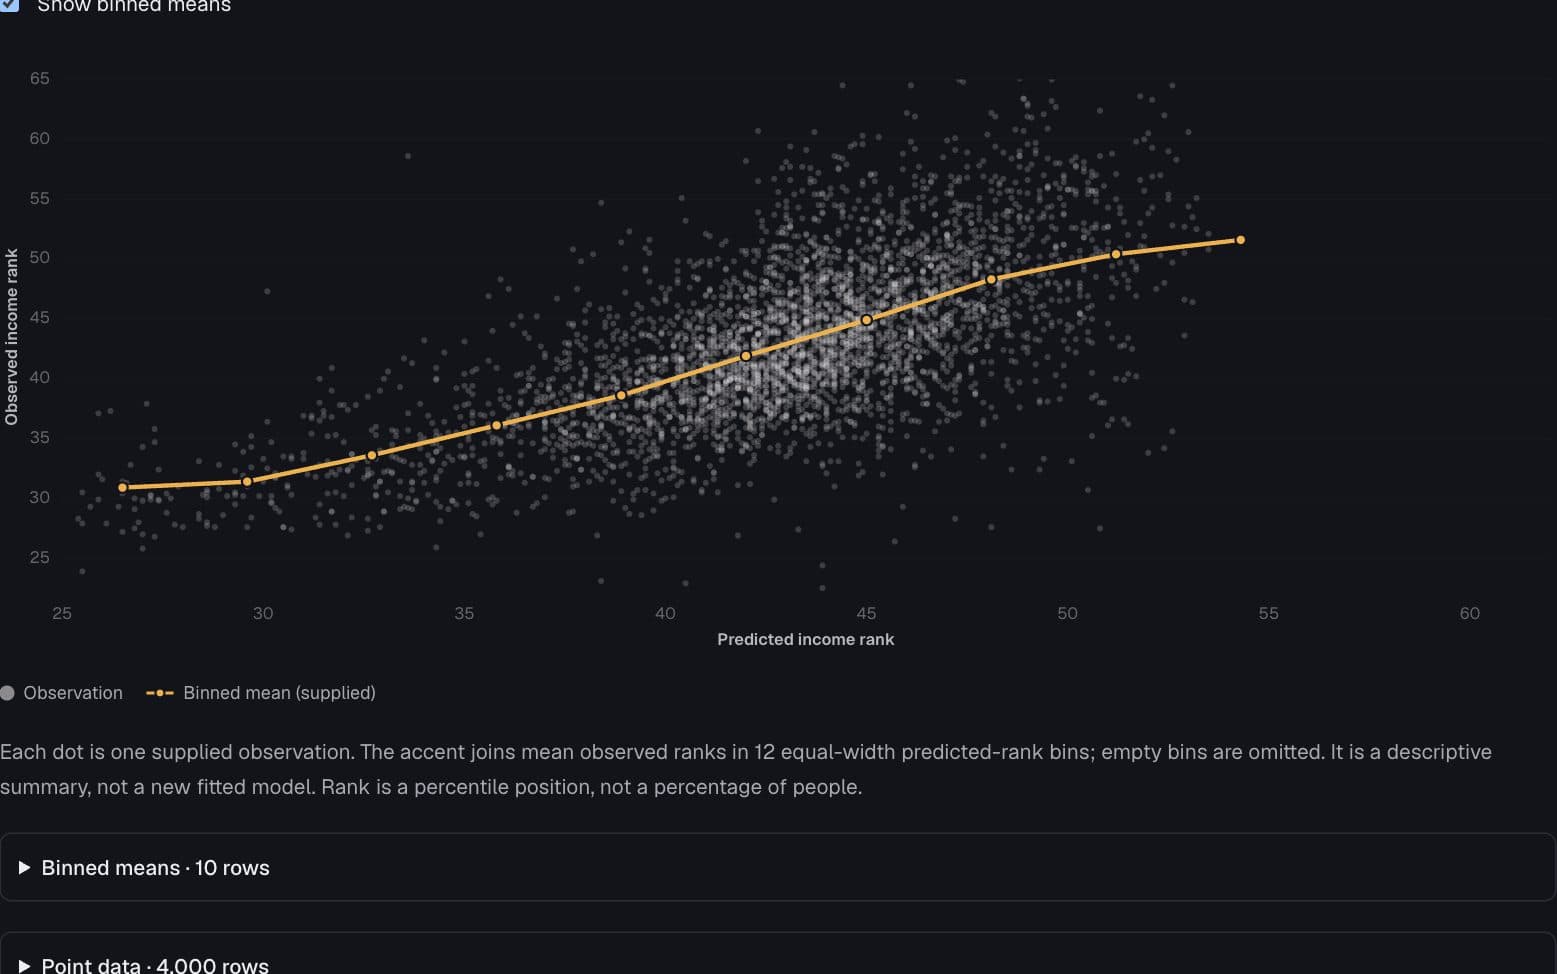
What the point cloud leaves hidden
Where do predicted and observed income ranks diverge?
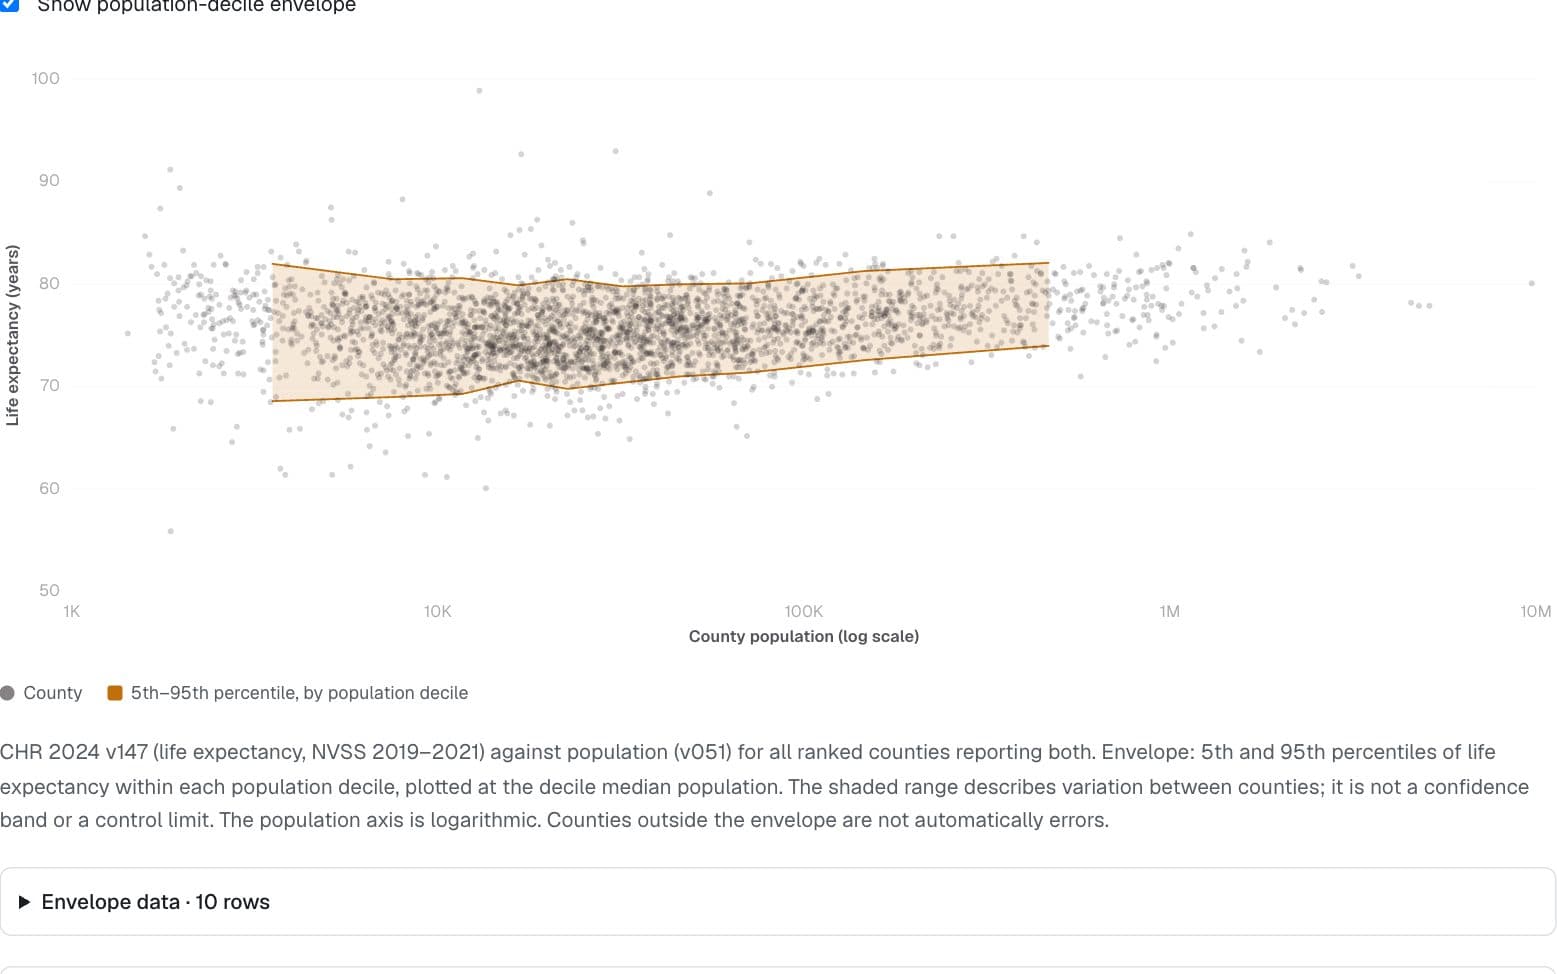
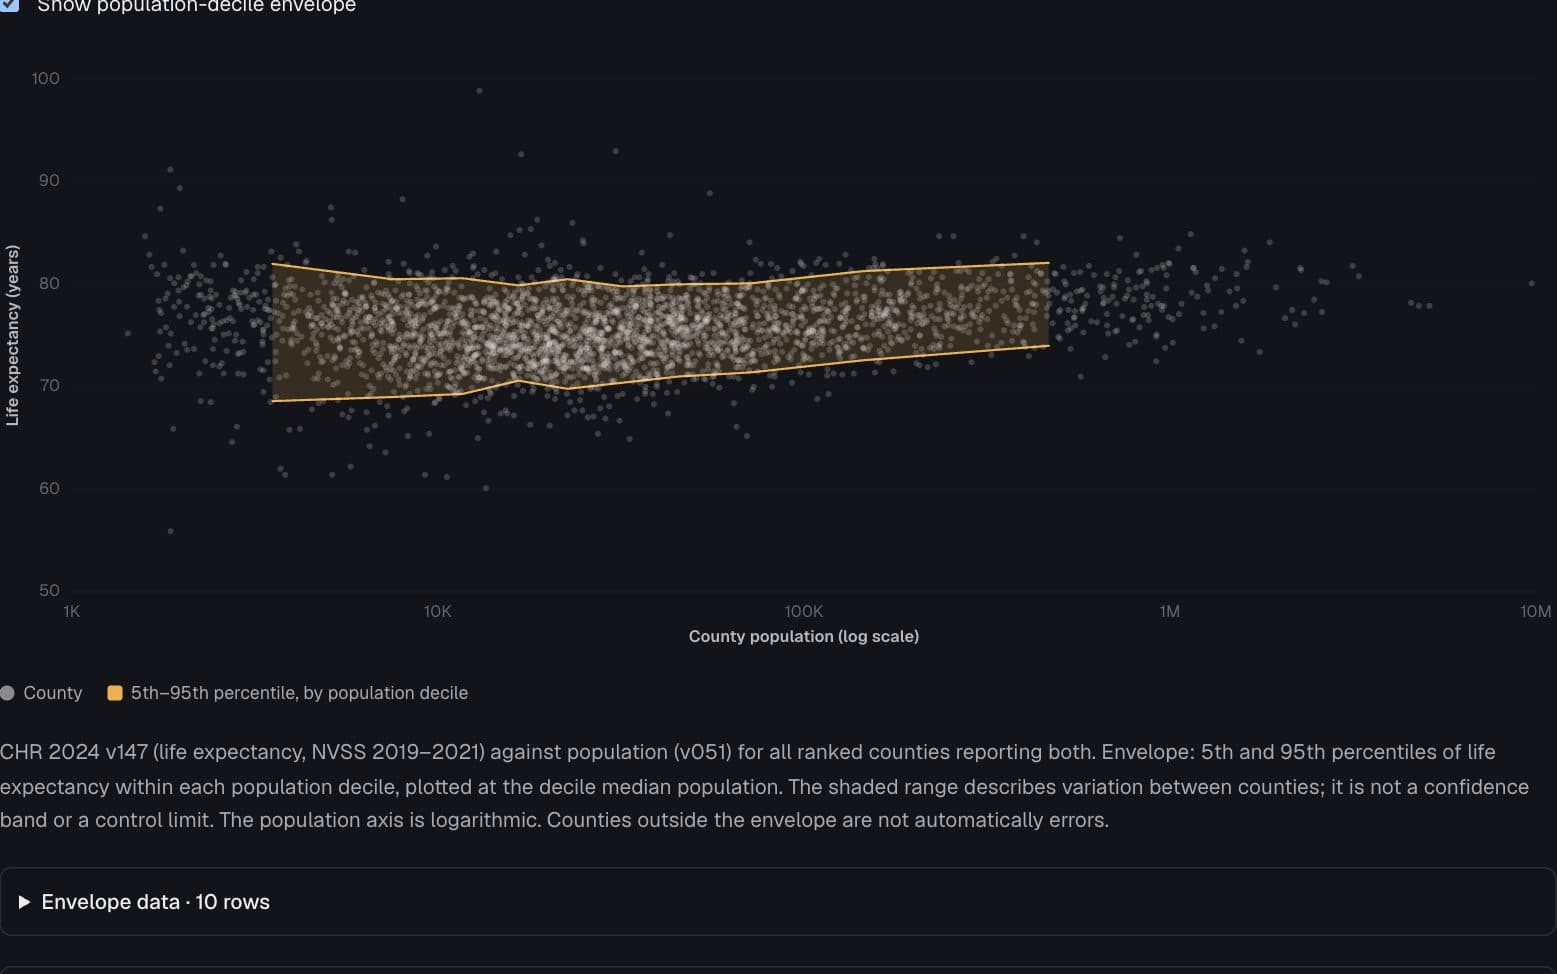
Health · County Health Rankings & Roadmaps 2024
Small counties, wider variation
How does the spread of county life expectancy change with population size?
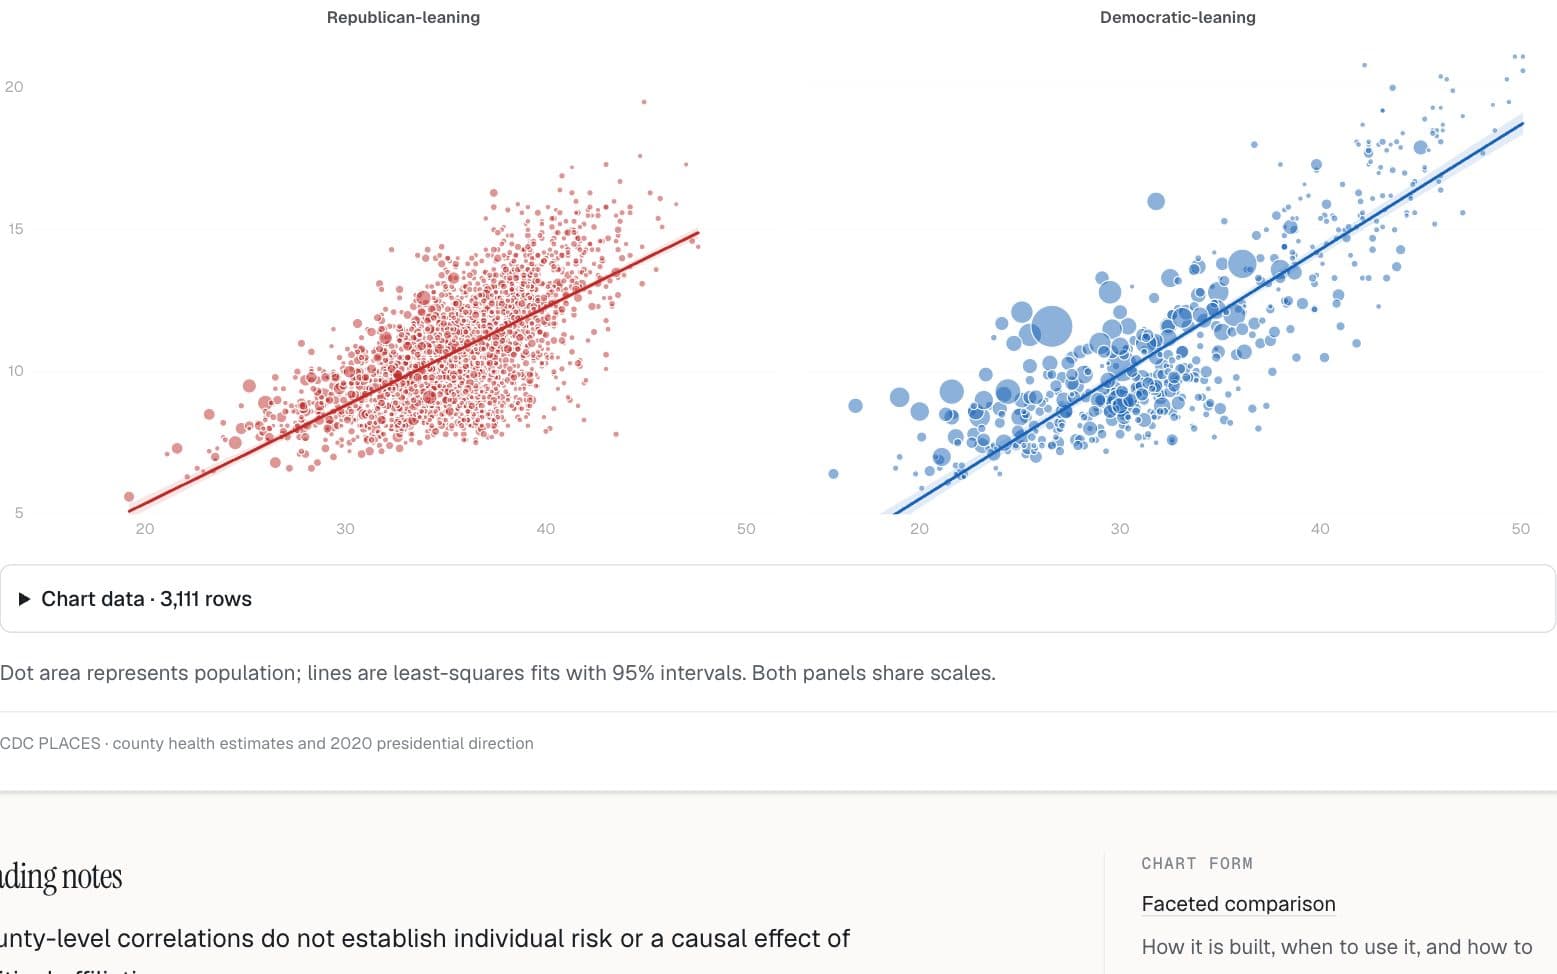
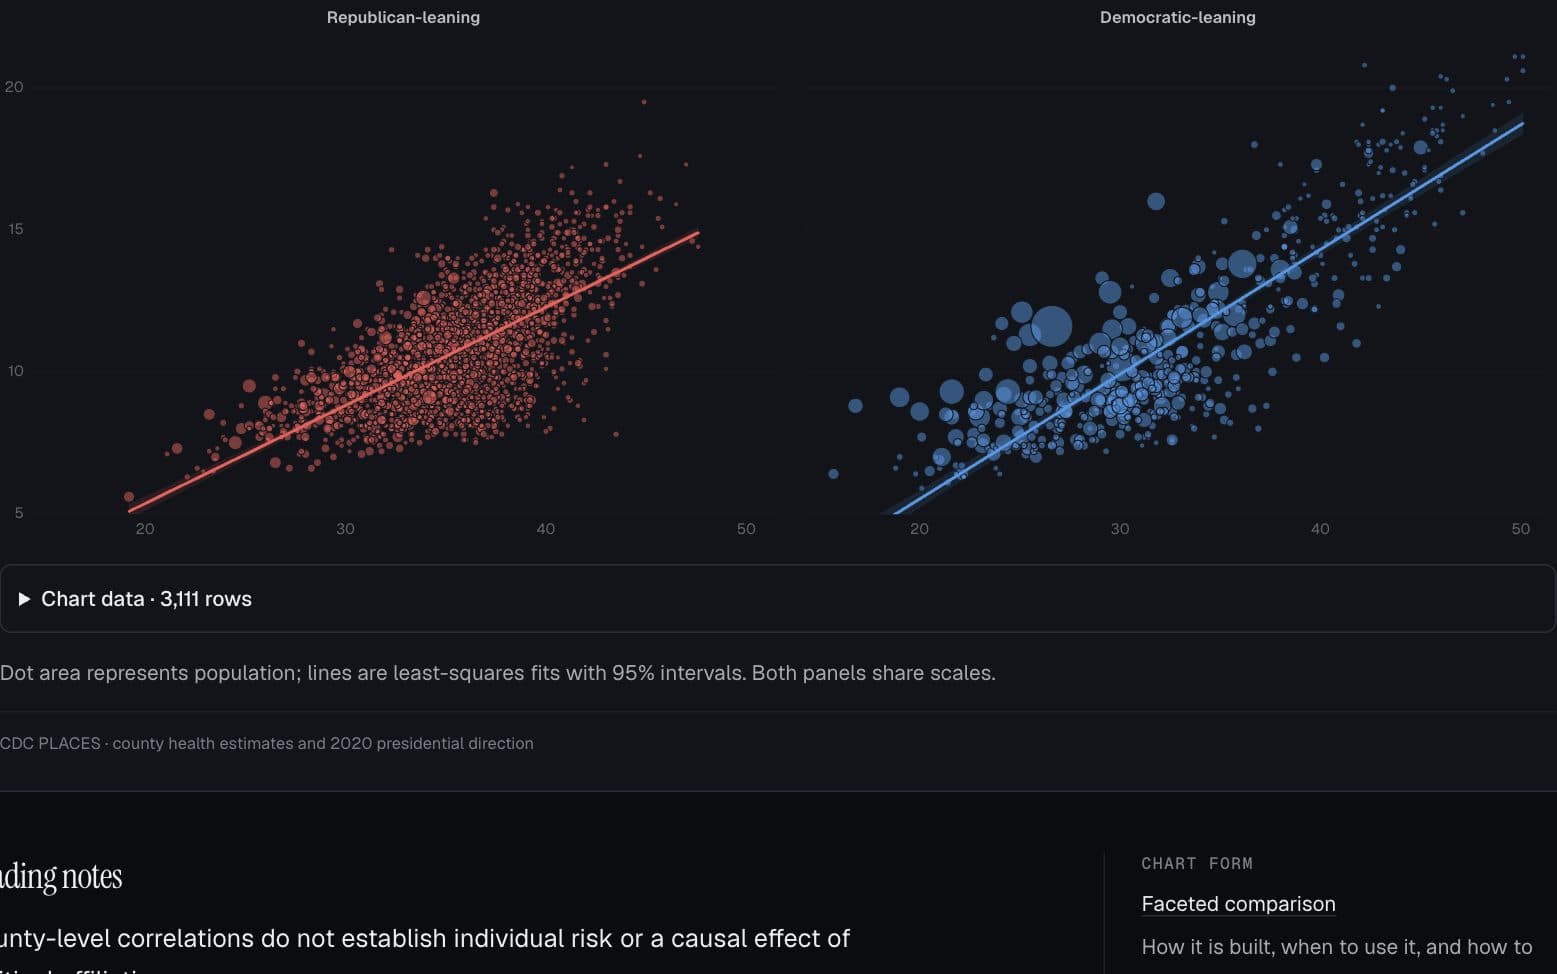
Health · CDC PLACES
Obesity and diabetes, county by county
Does the association look similar in counties with different 2020 vote directions?
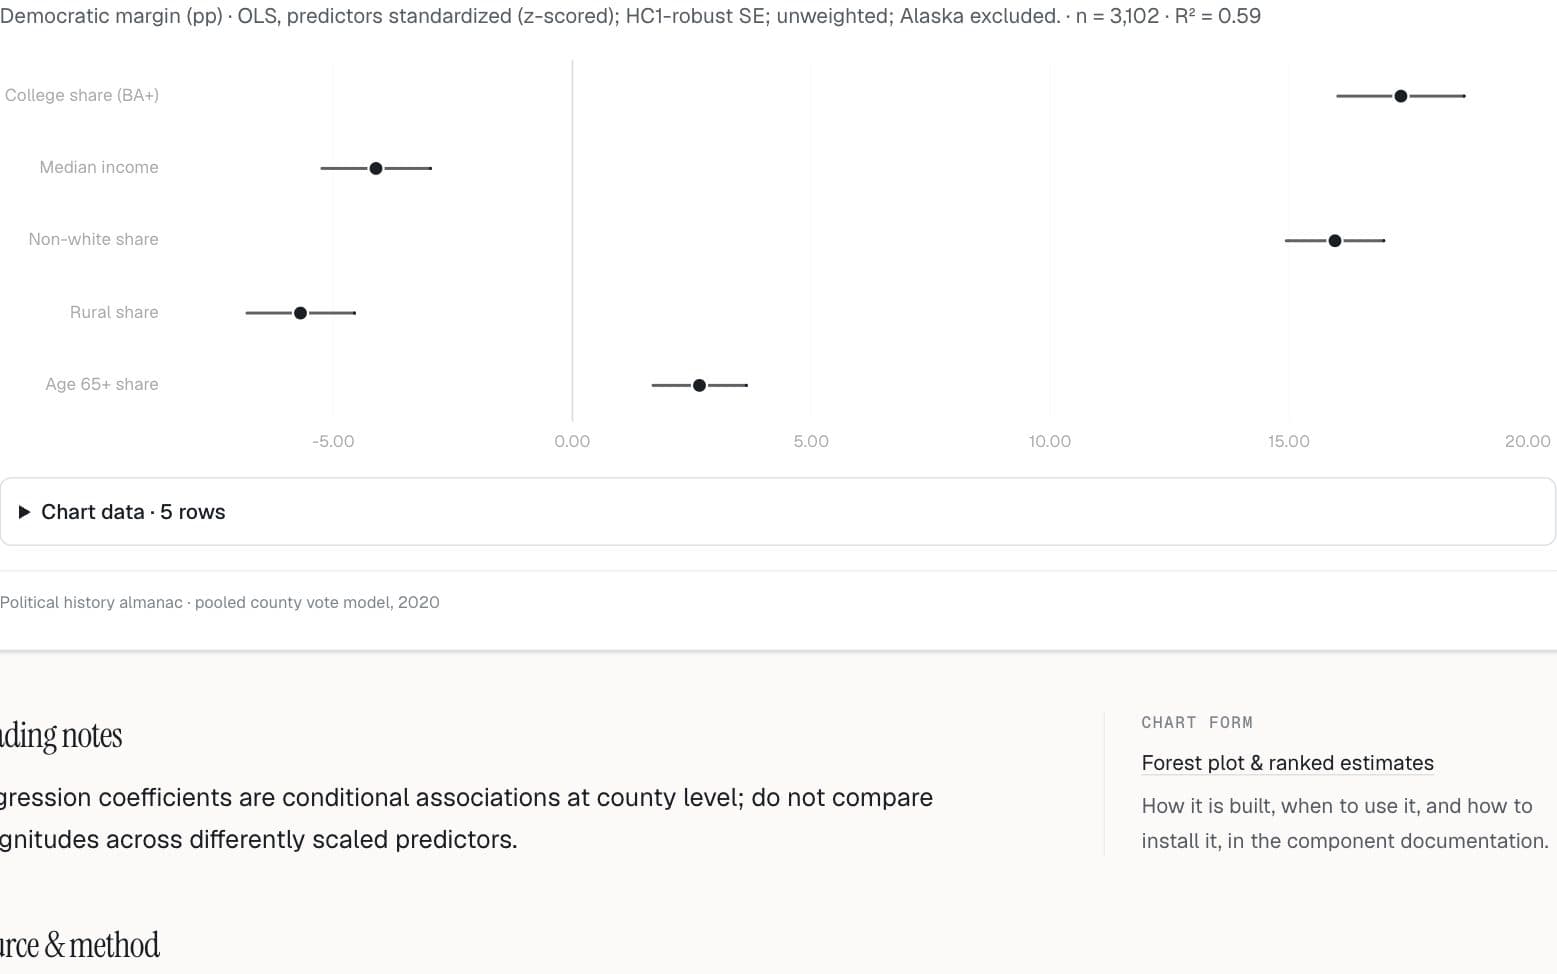
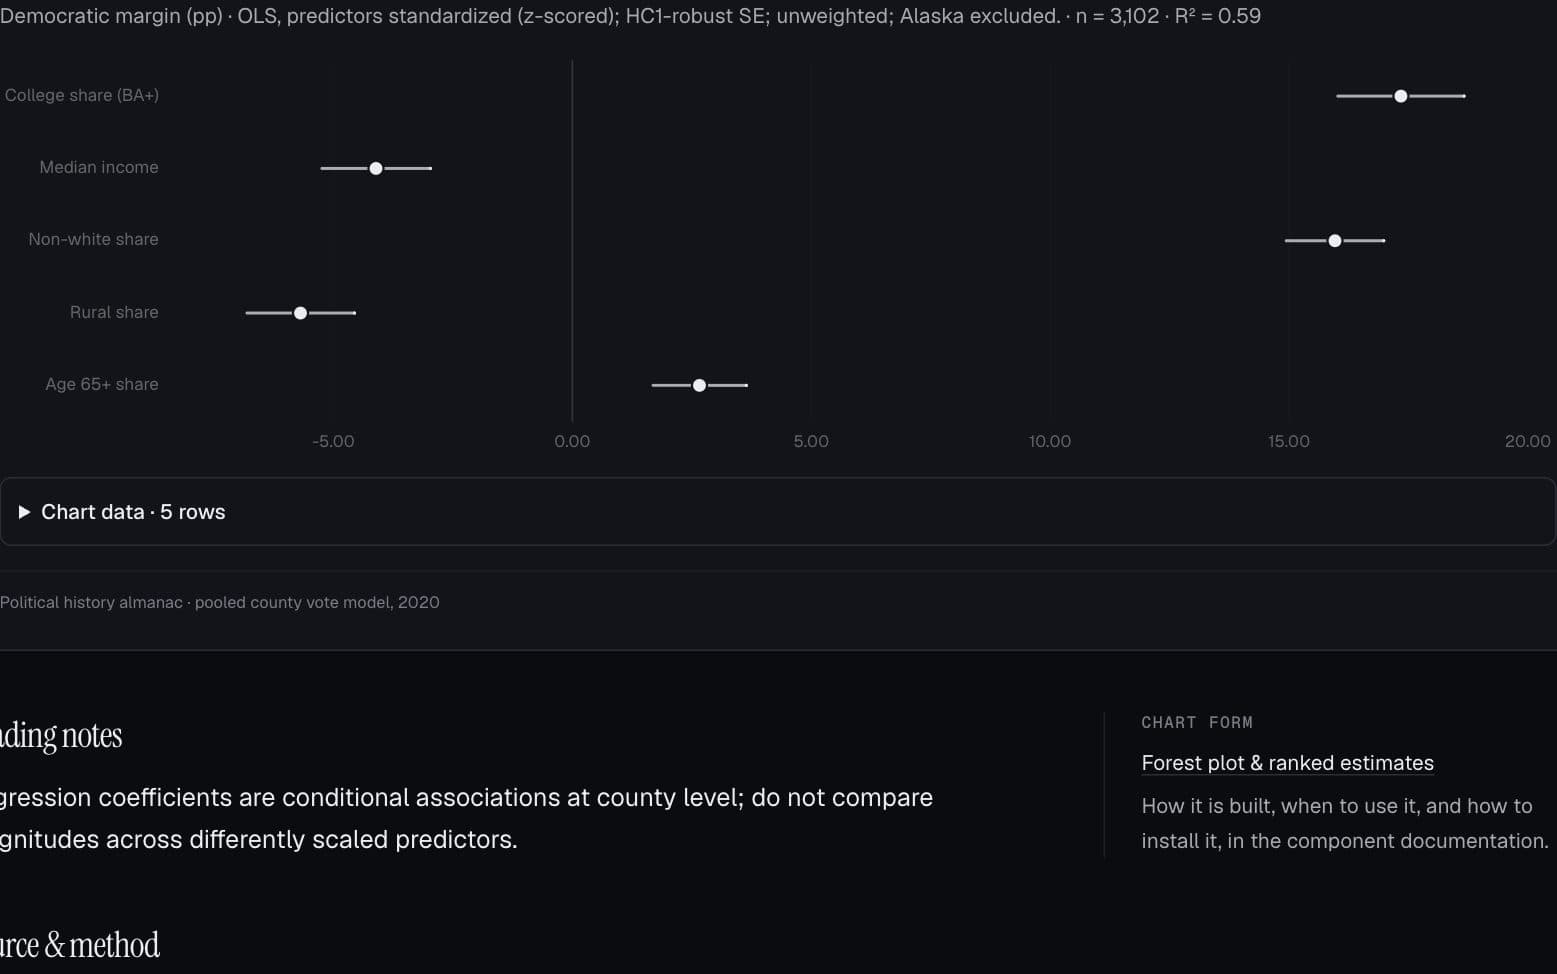
Politics & public opinion · Political history almanac
The predictors behind the vote
Which county characteristics are associated with the 2020 presidential vote?
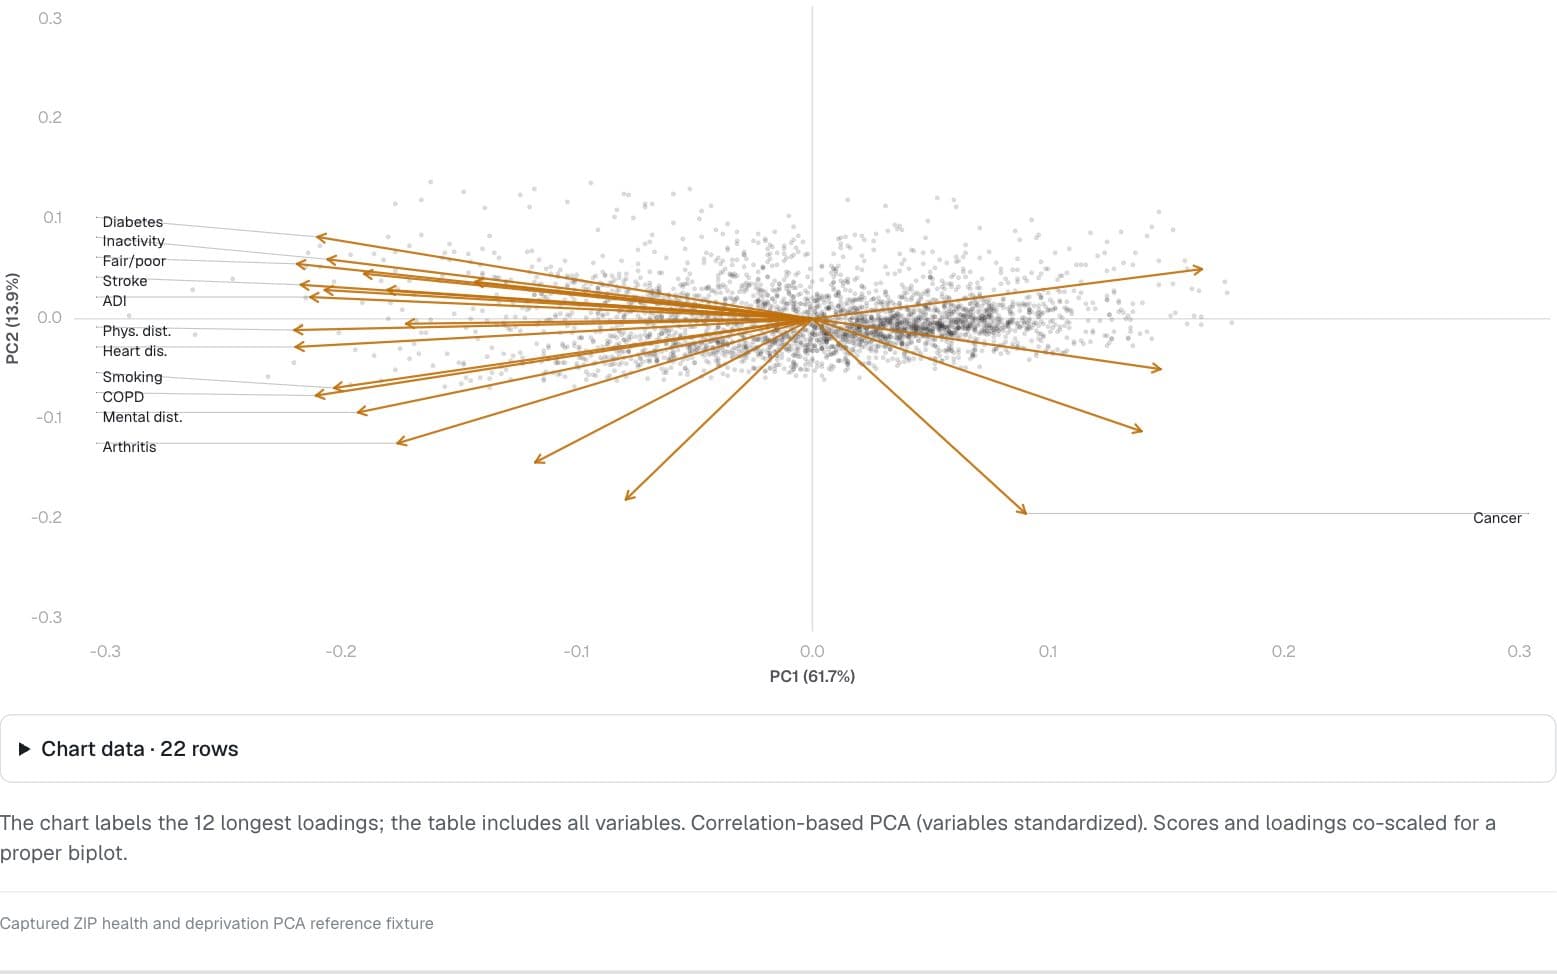
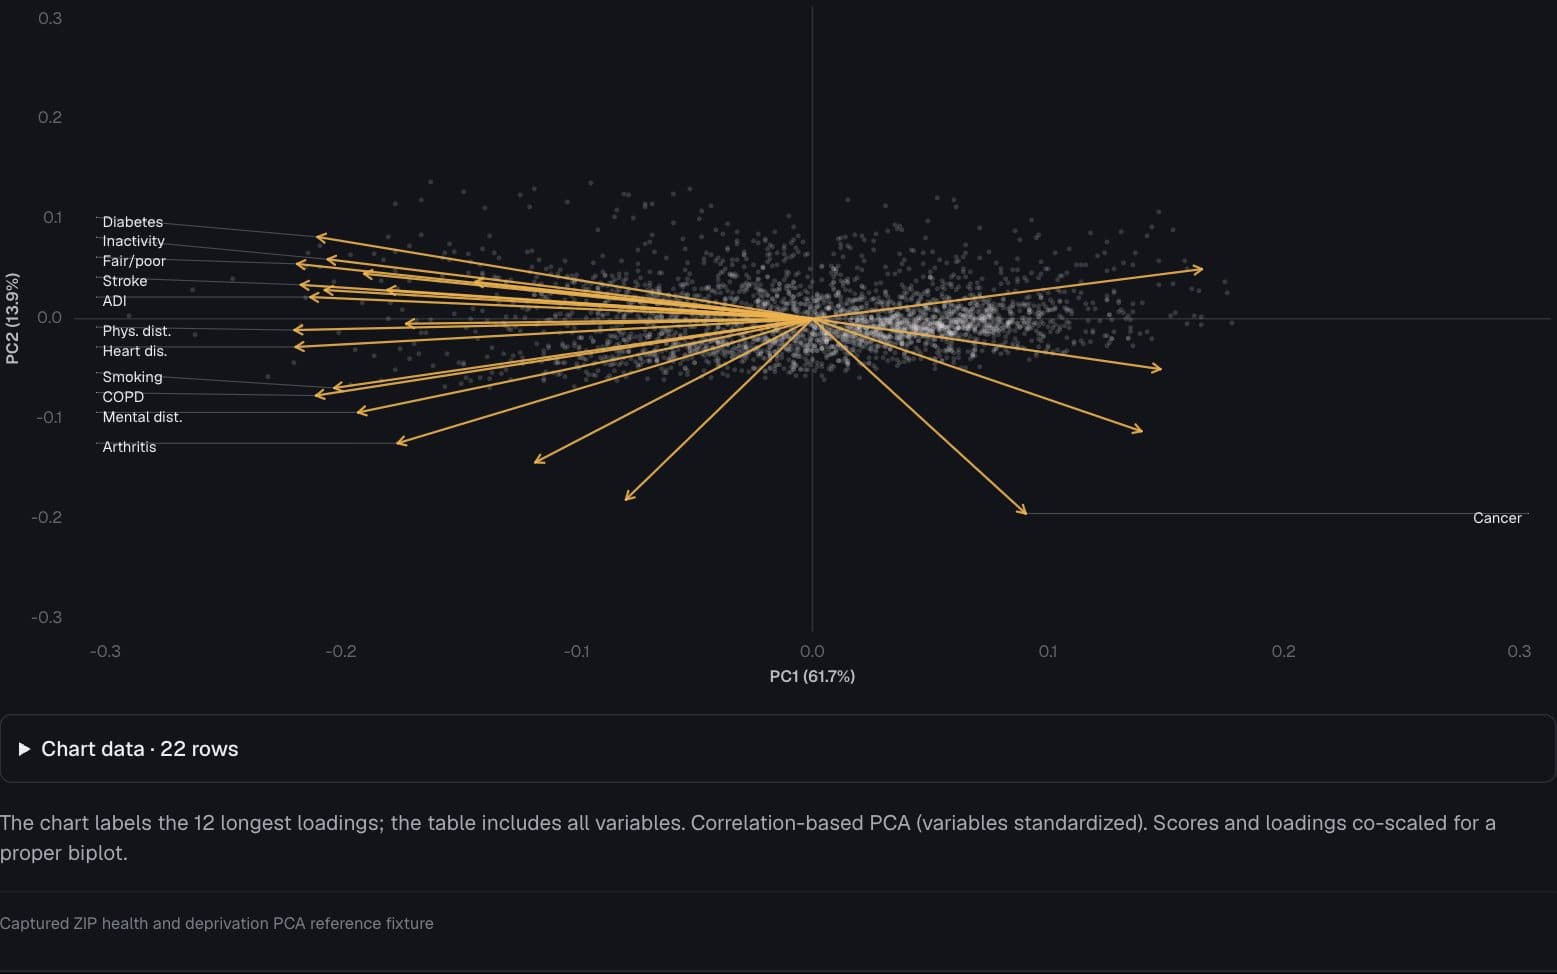
Health · Captured ZIP health and deprivation PCA reference fixture
The dimensions of health and deprivation
Which ZIP-level health and deprivation measures move together?
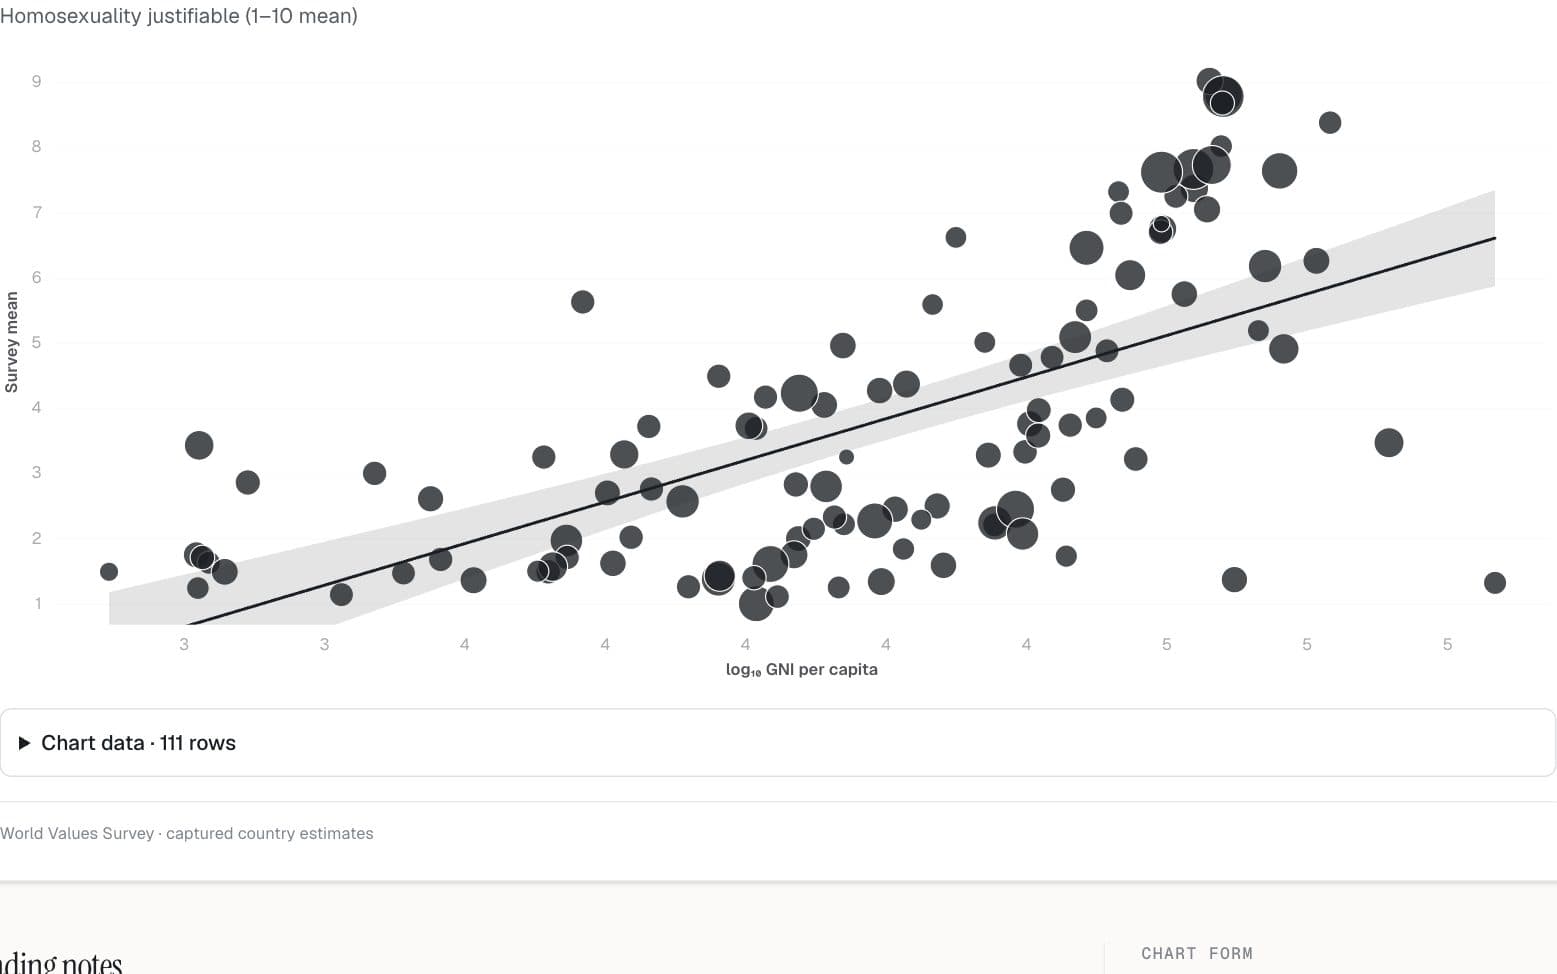
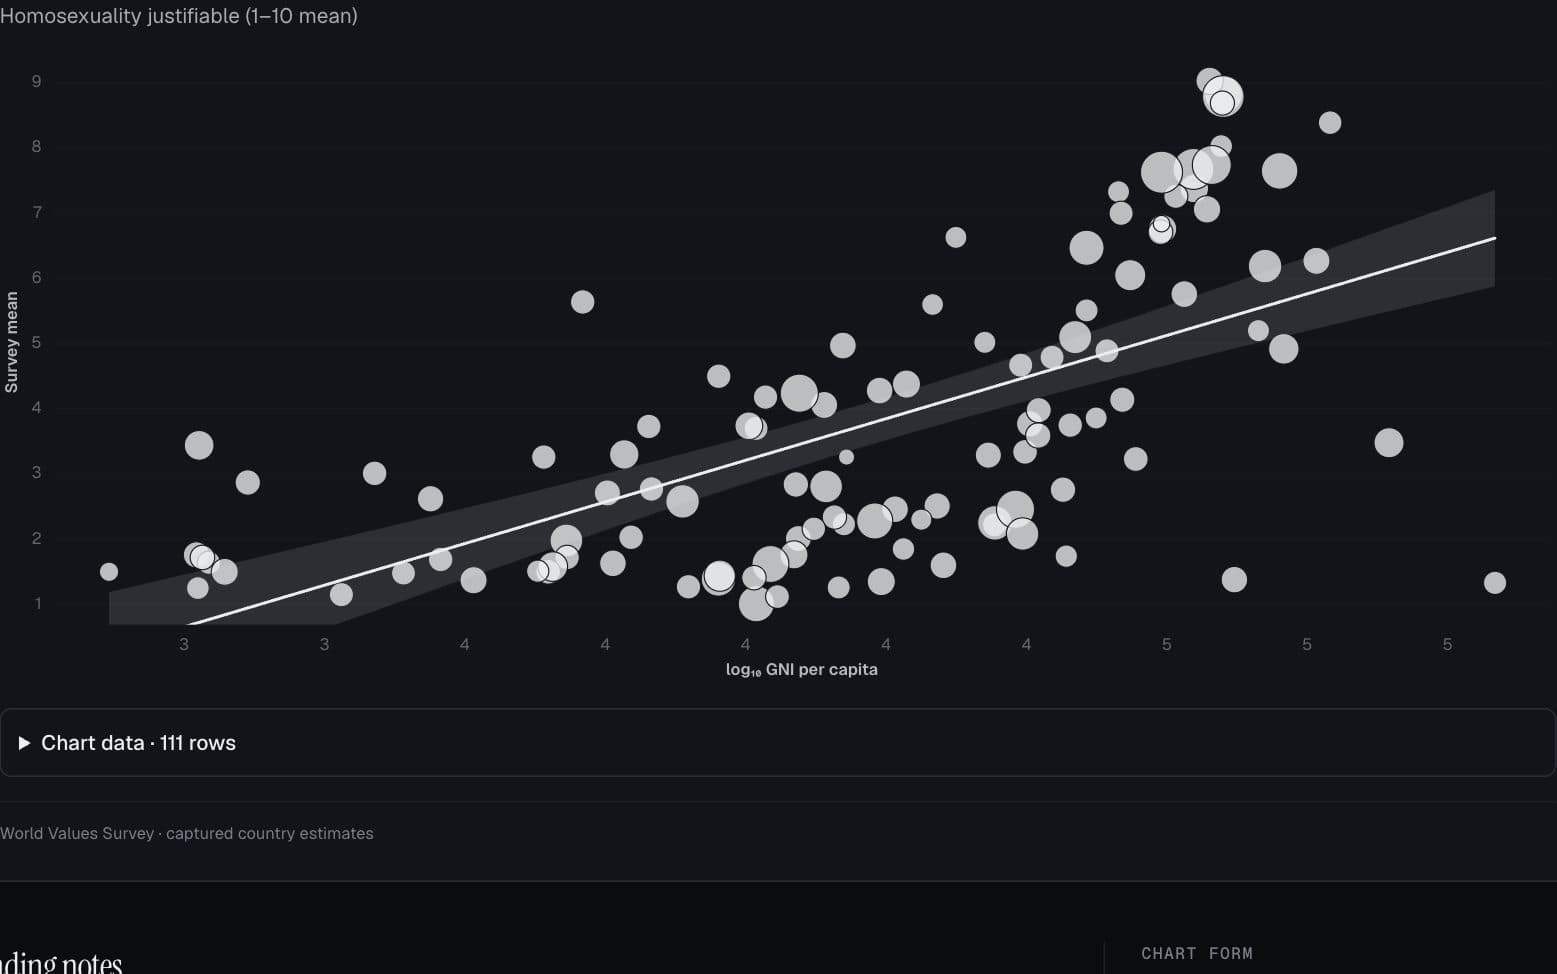
Society & world values · World Values Survey
Values and economic development
How do country-level attitudes vary with national income?
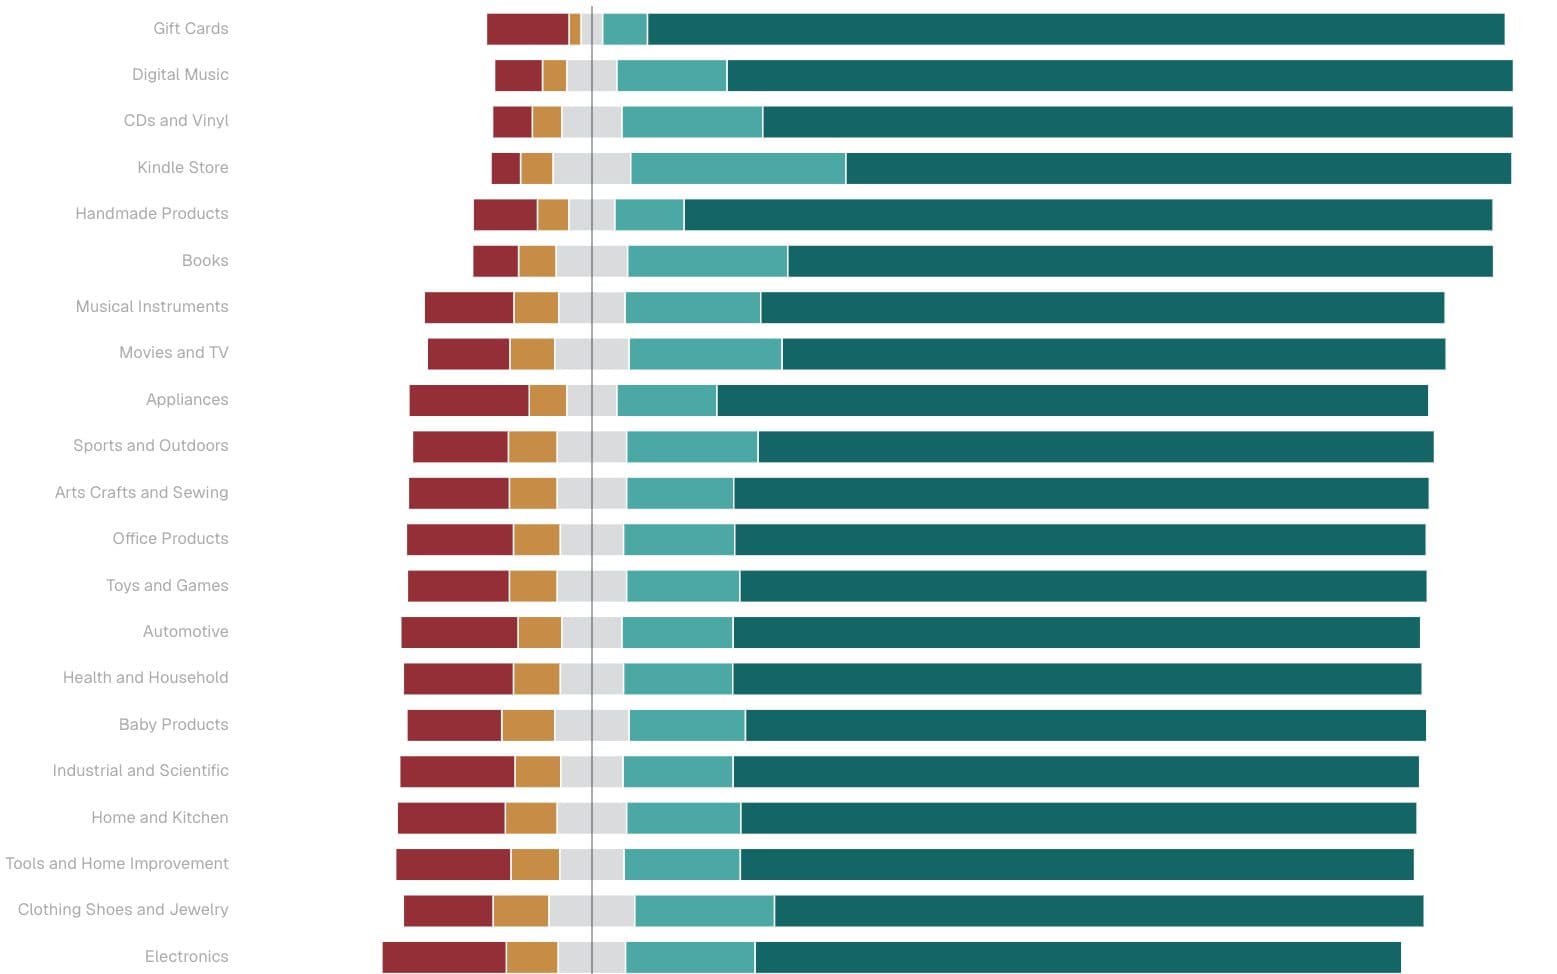
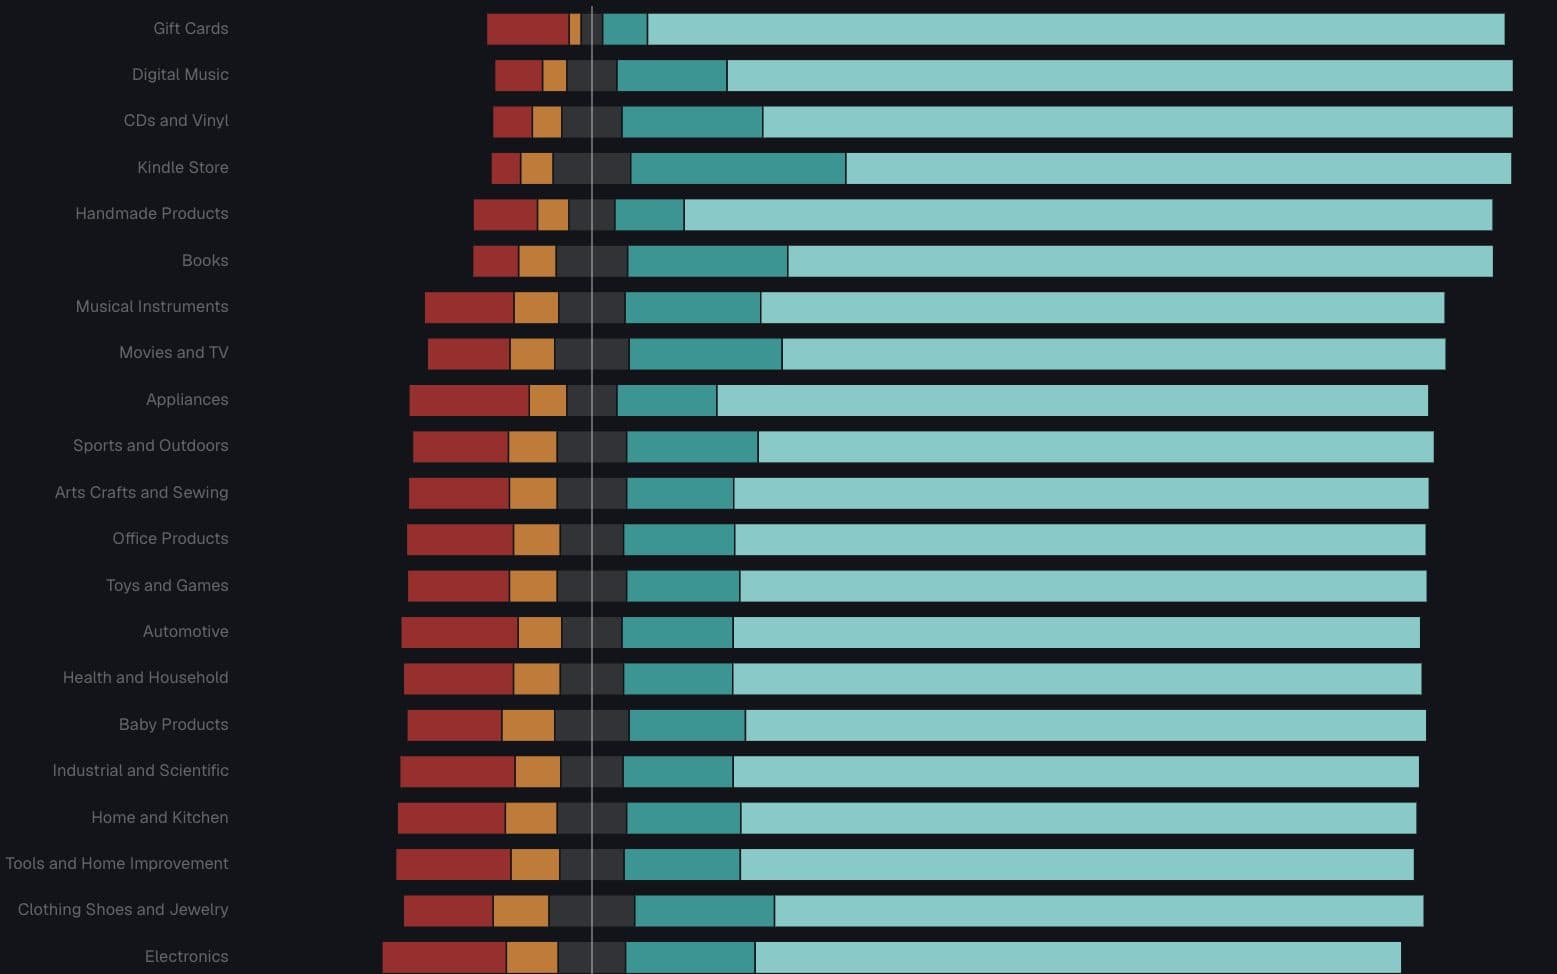
Consumer behavior · Amazon Reviews 2023
An average rating hides the distribution
Which product categories polarize reviewers?