Heatmap timeline
Many rows of one indexed quantity over time, with a brushable overview that zooms the grid.
Eviction Lab ETS · 32 cities, 2020–2025
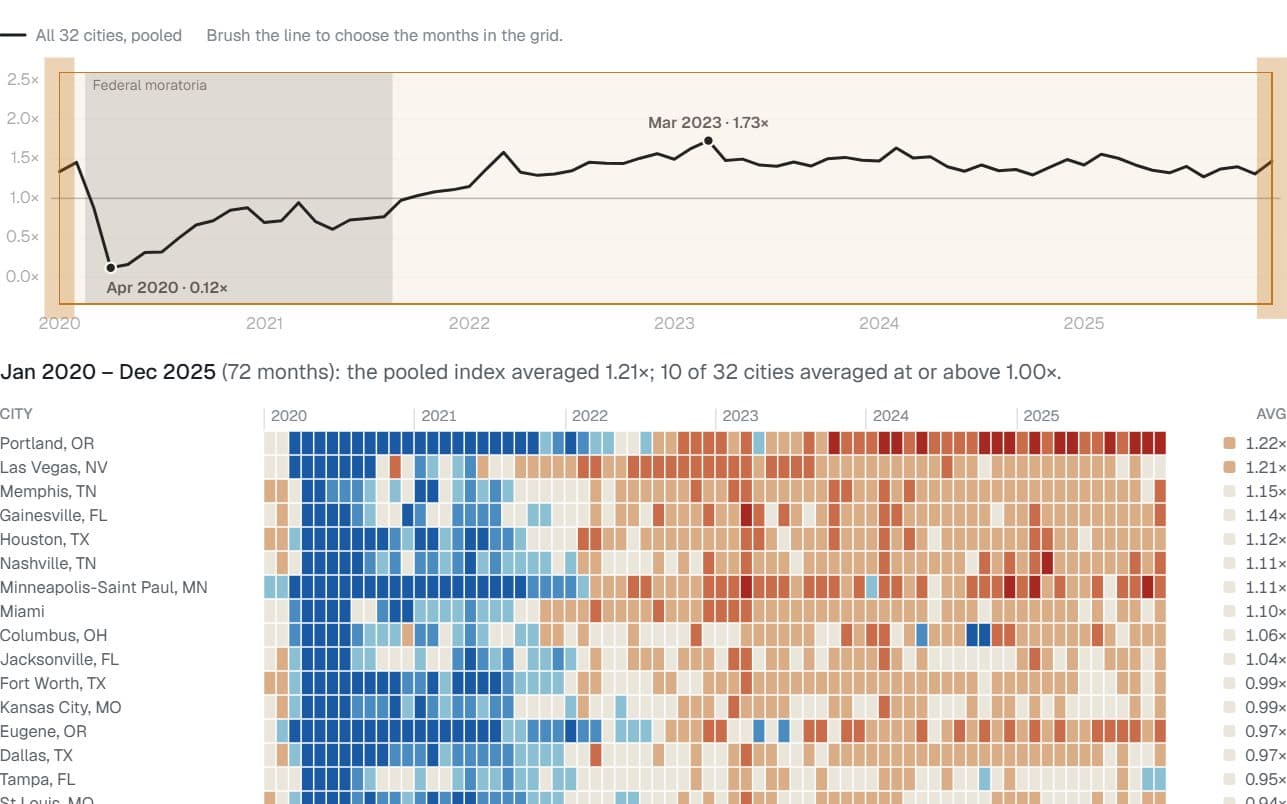
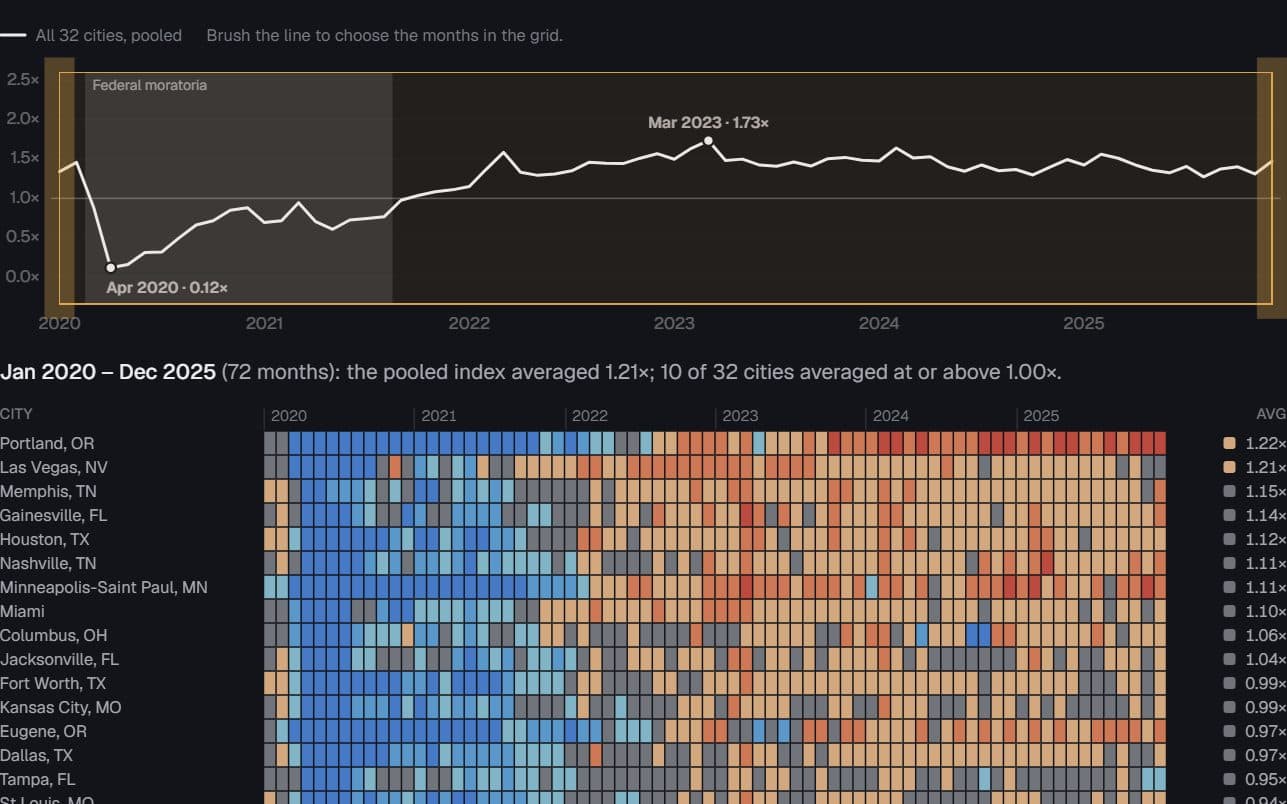
Eviction filings each month as a multiple of the same city’s pre-pandemic baseline, shaded by how far above or below it they ran. Brush the pooled line to zoom the grid; the right-hand column averages each city over the brushed months, and the rows re-sort by it.
Jan 2020 – Dec 2025 (72 months): the pooled index averaged 1.21×; 10 of 32 cities averaged at or above 1.00×.
Filings as a multiple of the city’s pre-pandemic baseline
0.50×0.67×0.87×1.15×1.50×2.00×
← below 1.00×above →
Each cell is one city’s eviction filings in one month divided by the average for that calendar month before the pandemic, so 1.00× is the city’s own normal. Colour classes are symmetric in ratio — half and double sit the same distance from baseline — and the middle class runs from 0.87× to 1.15×. The line is the plate’s pooled index across its 11,324-tract panel (filings summed before dividing); the 32 city rows hold 10,243 of those tracts, and three of the Eviction Lab’s 35 jurisdictions are left out for lack of a usable baseline. “Avg” is the plain mean of a city’s monthly indexes over the brushed months, not a pooled ratio, which would need the counts this file does not carry; the plate’s pooled 2023–25 index is in the table for comparison. Cincinnati reports zero filings for January–April 2020, including two months before any moratorium — most likely the start of its court records, so those cells are marked rather than trusted. Coverage is 35 participating jurisdictions, not the nation, and a high index can reflect a low baseline as much as a rise in filings.
Filing index by city, brushed months · 32 rows
| City | Tracts | Avg in window (×) | First month back at 1.0 | Pooled 2023–25 (plate) | Jan 2020 | Feb 2020 | Mar 2020 | Apr 2020 | May 2020 | Jun 2020 | Jul 2020 | Aug 2020 | Sep 2020 | Oct 2020 | Nov 2020 | Dec 2020 | Jan 2021 | Feb 2021 | Mar 2021 | Apr 2021 | May 2021 | Jun 2021 | Jul 2021 | Aug 2021 | Sep 2021 | Oct 2021 | Nov 2021 | Dec 2021 | Jan 2022 | Feb 2022 | Mar 2022 | Apr 2022 | May 2022 | Jun 2022 | Jul 2022 | Aug 2022 | Sep 2022 | Oct 2022 | Nov 2022 | Dec 2022 | Jan 2023 | Feb 2023 | Mar 2023 | Apr 2023 | May 2023 | Jun 2023 | Jul 2023 | Aug 2023 | Sep 2023 | Oct 2023 | Nov 2023 | Dec 2023 | Jan 2024 | Feb 2024 | Mar 2024 | Apr 2024 | May 2024 | Jun 2024 | Jul 2024 | Aug 2024 | Sep 2024 | Oct 2024 | Nov 2024 | Dec 2024 | Jan 2025 | Feb 2025 | Mar 2025 | Apr 2025 | May 2025 | Jun 2025 | Jul 2025 | Aug 2025 | Sep 2025 | Oct 2025 | Nov 2025 | Dec 2025 |
|---|---|---|---|---|---|---|---|---|---|---|---|---|---|---|---|---|---|---|---|---|---|---|---|---|---|---|---|---|---|---|---|---|---|---|---|---|---|---|---|---|---|---|---|---|---|---|---|---|---|---|---|---|---|---|---|---|---|---|---|---|---|---|---|---|---|---|---|---|---|---|---|---|---|---|---|---|
| Portland, OR | 361 | 1.22 | May 2022 | 1.84 | 0.87 | 0.92 | 0.37 | 0.05 | 0.07 | 0.09 | 0.12 | 0.11 | 0.12 | 0.14 | 0.18 | 0.14 | 0.15 | 0.14 | 0.23 | 0.2 | 0.26 | 0.2 | 0.37 | 0.47 | 0.43 | 0.49 | 0.71 | 0.54 | 0.45 | 0.61 | 0.79 | 0.84 | 1.06 | 1.03 | 0.77 | 1.39 | 1.33 | 1.83 | 1.85 | 1.65 | 1.62 | 1.46 | 1.75 | 0.85 | 1.44 | 1.15 | 1.16 | 1.64 | 1.35 | 2.04 | 1.99 | 1.62 | 1.8 | 2.05 | 2.09 | 1.83 | 2.21 | 1.68 | 1.94 | 1.91 | 1.9 | 2.45 | 2.09 | 2.01 | 1.87 | 2.07 | 1.92 | 2.05 | 2.32 | 1.94 | 1.86 | 2.09 | 1.85 | 2.41 | 2.01 | 2.17 |
| Las Vegas, NV | 535 | 1.21 | Oct 2020 | 1.35 | 0.92 | 1.06 | 0.44 | 0.02 | 0.04 | 0.05 | 0.08 | 0.17 | 0.25 | 1.02 | 1.65 | 0.91 | 0.56 | 0.75 | 1.04 | 0.74 | 0.64 | 1.32 | 1.13 | 1.08 | 1.18 | 1.32 | 1.26 | 1.33 | 1.31 | 1.63 | 1.74 | 1.46 | 1.28 | 1.61 | 1.7 | 1.74 | 1.69 | 1.59 | 1.63 | 1.85 | 1.71 | 1.62 | 1.72 | 1.48 | 1.79 | 1.65 | 1.6 | 1.58 | 1.44 | 1.47 | 1.39 | 1.31 | 1.44 | 1.45 | 1.25 | 1.36 | 1.27 | 1.24 | 1.61 | 1.39 | 1.38 | 1 | 1.19 | 1.35 | 1.19 | 1.21 | 1.28 | 1.22 | 1.21 | 1.19 | 1.37 | 1.2 | 1.05 | 1.15 | 1 | 1.02 |
| Memphis, TN | 249 | 1.15 | Mar 2021 | 1.37 | 1.28 | 1.26 | 0.87 | 0.23 | 0.36 | 0.54 | 0.58 | 0.58 | 0.76 | 0.88 | 0.85 | 0.92 | 0.42 | 0.4 | 1.01 | 0.85 | 0.62 | 0.67 | 0.61 | 0.72 | 0.94 | 0.93 | 0.93 | 1.03 | 1.02 | 1.05 | 1.35 | 1.12 | 1.2 | 1.23 | 1.26 | 1.23 | 1.34 | 1.45 | 1.5 | 1.49 | 1.39 | 1.56 | 1.61 | 1.35 | 1.36 | 1.42 | 1.22 | 1.35 | 1.43 | 1.65 | 1.52 | 1.38 | 1.26 | 1.55 | 1.3 | 1.58 | 1.43 | 1.29 | 1.45 | 1.29 | 1.45 | 1.38 | 1.36 | 1.21 | 1.33 | 1.35 | 1.27 | 1.21 | 1.23 | 1.27 | 1.46 | 1.18 | 1.25 | 1.33 | 1.11 | 1.5 |
| Gainesville, FL | 58 | 1.14 | Dec 2021 | 1.38 | 0.91 | 1.27 | 0.9 | 0.11 | 0.13 | 0.2 | 0.18 | 0.61 | 0.78 | 0.94 | 0.95 | 0.4 | 0.66 | 0.92 | 0.87 | 0.59 | 0.56 | 0.66 | 0.6 | 0.89 | 0.96 | 0.75 | 0.84 | 1.07 | 0.89 | 1.04 | 1.46 | 1.01 | 1.26 | 1.4 | 1.07 | 1.98 | 1.18 | 1.32 | 1.42 | 1.52 | 1.16 | 1.44 | 2.01 | 1.52 | 1.14 | 1.54 | 1.31 | 1.13 | 1.42 | 1.71 | 1.31 | 1.19 | 1.48 | 1.69 | 1.8 | 1.35 | 1.22 | 1.29 | 1.33 | 1.35 | 1.22 | 1.33 | 0.97 | 1.48 | 1.23 | 1.68 | 1.43 | 1.18 | 1.44 | 1.46 | 1.28 | 1.22 | 1.15 | 1.38 | 1.38 | 1.8 |
| Houston, TX | 1,218 | 1.12 | Jan 2022 | 1.34 | 1.15 | 1.32 | 0.83 | 0.16 | 0.26 | 0.39 | 0.44 | 0.4 | 0.4 | 0.43 | 0.57 | 0.71 | 0.49 | 0.45 | 0.77 | 0.57 | 0.47 | 0.39 | 0.53 | 0.53 | 0.81 | 0.96 | 0.91 | 0.94 | 1.09 | 1.62 | 1.78 | 1.44 | 1.42 | 1.13 | 1.48 | 1.31 | 1.43 | 1.41 | 1.31 | 1.45 | 1.32 | 1.48 | 1.73 | 1.53 | 1.46 | 1.13 | 1.42 | 1.34 | 1.39 | 1.5 | 1.38 | 1.41 | 1.37 | 1.64 | 1.44 | 1.5 | 1.38 | 1.08 | 1.27 | 1.21 | 1.32 | 1.25 | 1.19 | 1.4 | 1.25 | 1.5 | 1.51 | 1.37 | 1.35 | 1.07 | 1.38 | 1.15 | 1.31 | 1.3 | 1.22 | 1.36 |
| Nashville, TN | 174 | 1.11 | Dec 2020 | 1.38 | 1.09 | 1.17 | 0.87 | 0.14 | 0.14 | 0.41 | 0.23 | 0.35 | 0.65 | 0.67 | 0.51 | 1.04 | 0.59 | 0.53 | 0.81 | 0.54 | 0.44 | 0.76 | 0.59 | 0.71 | 0.71 | 0.82 | 0.81 | 1.08 | 0.72 | 1.39 | 1.43 | 1.02 | 0.92 | 1.02 | 1.02 | 1.32 | 1.12 | 1.3 | 1.05 | 1.73 | 1.25 | 1.27 | 1.5 | 1.35 | 1.39 | 1.29 | 1.11 | 1.34 | 1.17 | 1.42 | 1.49 | 1.49 | 1.26 | 1.88 | 1.34 | 1.35 | 1.2 | 1.41 | 1.16 | 1.37 | 1.1 | 1.66 | 1.48 | 1.84 | 1.28 | 1.52 | 2.11 | 1.32 | 1.31 | 1.36 | 1.32 | 1.31 | 1.2 | 1.55 | 1.34 | 1.74 |
| Minneapolis-Saint Paul, MN | 472 | 1.11 | Mar 2022 | 1.59 | 0.84 | 0.83 | 0.48 | 0.04 | 0.02 | 0.04 | 0.05 | 0.05 | 0.06 | 0.08 | 0.12 | 0.09 | 0.08 | 0.11 | 0.12 | 0.11 | 0.09 | 0.08 | 0.23 | 0.33 | 0.44 | 0.54 | 0.51 | 0.62 | 0.5 | 0.85 | 1.26 | 1.45 | 1.25 | 1.88 | 1.63 | 1.48 | 1.36 | 1.44 | 1.4 | 1.71 | 1.6 | 1.94 | 2.08 | 1.53 | 1.64 | 1.54 | 1.46 | 1.6 | 1.58 | 1.7 | 1.48 | 1.81 | 0.77 | 1.63 | 1.8 | 1.34 | 1.5 | 1.13 | 1.38 | 1.49 | 1.63 | 1.53 | 1.91 | 2.04 | 1.78 | 2.06 | 1.45 | 1.5 | 1.3 | 1.25 | 1.73 | 1.07 | 1.69 | 1.84 | 2.02 | 1.92 |
| Miami | 707 | 1.1 | Sep 2021 | 1.26 | 1.05 | 1.07 | 0.62 | 0.12 | 0.17 | 0.2 | 0.15 | 0.87 | 0.95 | 0.5 | 0.08 | 0.32 | 0.7 | 0.81 | 0.81 | 0.85 | 0.66 | 0.84 | 0.85 | 0.86 | 1.08 | 0.99 | 1.21 | 1.23 | 1.21 | 1.37 | 1.53 | 1.42 | 1.3 | 1.21 | 1.31 | 1.53 | 1.46 | 1.33 | 1.45 | 1.61 | 1.52 | 1.51 | 1.71 | 1.42 | 1.27 | 1.37 | 1.28 | 1.32 | 1.33 | 1.2 | 1.26 | 1.33 | 1.49 | 1.4 | 1.23 | 1.32 | 1.25 | 1.06 | 1.33 | 1.23 | 1.24 | 1.04 | 1.2 | 1.16 | 1.15 | 1.29 | 1.23 | 1.21 | 1.31 | 1.05 | 1.15 | 0.99 | 1.25 | 1.15 | 1.09 | 1.18 |
| Columbus, OH | 328 | 1.06 | Dec 2020 | 1.21 | 0.97 | 1.03 | 0.5 | 0.22 | 0.24 | 0.48 | 0.47 | 0.59 | 0.75 | 0.74 | 0.84 | 1.21 | 0.57 | 0.62 | 1.03 | 0.75 | 0.57 | 0.84 | 0.93 | 0.89 | 0.76 | 0.84 | 1.28 | 1.21 | 1.03 | 1.16 | 1.01 | 1.04 | 1.06 | 1.15 | 1 | 1.13 | 0.97 | 1.08 | 1.72 | 1.11 | 0.92 | 1.1 | 1.15 | 1.19 | 1.22 | 1.3 | 1.15 | 1.43 | 1.06 | 1.12 | 1.78 | 1.24 | 1.66 | 1.53 | 1.02 | 1.36 | 0.52 | 1.39 | 1.48 | 1.34 | 0.25 | 0.15 | 1.54 | 1.54 | 1.44 | 1.48 | 1.19 | 1.41 | 1.26 | 1.48 | 1.5 | 1.3 | 1.14 | 1.19 | 1.47 | 1.31 |
| Jacksonville, FL | 219 | 1.04 | Dec 2020 | 1.2 | 1.14 | 1.23 | 0.84 | 0.05 | 0.03 | 0.05 | 0.05 | 0.74 | 0.82 | 0.89 | 0.96 | 1.05 | 0.84 | 0.92 | 0.95 | 0.5 | 0.48 | 0.58 | 0.71 | 0.65 | 0.88 | 0.75 | 0.75 | 0.66 | 0.75 | 0.99 | 1.31 | 1.02 | 1.02 | 1.16 | 1.17 | 1.38 | 1.11 | 1.27 | 1.42 | 1.33 | 1.14 | 1.98 | 1.69 | 1.12 | 1.28 | 1.2 | 1.02 | 1.2 | 1.11 | 1.25 | 1.25 | 1.15 | 1.19 | 1.64 | 1.27 | 1.12 | 1.25 | 1.01 | 1.11 | 1.1 | 1.02 | 1.07 | 1.03 | 1.04 | 1.3 | 1.67 | 1.43 | 1.13 | 1.2 | 0.94 | 1.1 | 1.22 | 1.17 | 1.25 | 1.14 | 1.29 |
| Fort Worth, TX | 642 | 0.99 | Feb 2022 | 1.23 | 1.22 | 1.33 | 0.79 | 0.04 | 0.14 | 0.27 | 0.26 | 0.42 | 0.48 | 0.38 | 0.44 | 0.57 | 0.54 | 0.35 | 0.71 | 0.49 | 0.47 | 0.48 | 0.48 | 0.52 | 0.67 | 0.72 | 0.75 | 0.69 | 0.97 | 1.16 | 1.46 | 1.06 | 1.09 | 1.1 | 1.07 | 1.17 | 1.21 | 1.13 | 1.13 | 1.21 | 1.2 | 1.4 | 1.5 | 1.23 | 1.23 | 1.25 | 1.16 | 1.23 | 1.26 | 1.21 | 1.26 | 1.18 | 1.36 | 1.4 | 1.46 | 1.3 | 1.19 | 1.25 | 1.29 | 1.18 | 1.24 | 1.07 | 1.2 | 1.25 | 1.3 | 1.31 | 1.47 | 1.22 | 1.22 | 1.11 | 0.87 | 1.1 | 1.2 | 1.18 | 1.09 | 1.26 |
| Kansas City, MO | 227 | 0.99 | Feb 2022 | 1.18 | 1.09 | 1.18 | 0.72 | 0.25 | 0.29 | 0.42 | 0.42 | 0.59 | 0.6 | 0.56 | 0.49 | 0.79 | 0.39 | 0.6 | 0.69 | 0.51 | 0.52 | 0.71 | 0.53 | 0.63 | 0.91 | 0.94 | 0.93 | 0.93 | 0.83 | 1.18 | 1.13 | 1.01 | 0.83 | 0.9 | 0.89 | 1.05 | 1.02 | 1.23 | 1.33 | 1.22 | 1.09 | 1.67 | 1.36 | 1.36 | 1.31 | 1.26 | 1.06 | 1.11 | 1.14 | 1.41 | 1.33 | 1.13 | 1.11 | 1.61 | 1.19 | 1.24 | 1.2 | 1.07 | 1.07 | 1.04 | 1.15 | 1.14 | 1.27 | 1.22 | 1.07 | 1.39 | 1.11 | 1.2 | 1.1 | 0.97 | 1.08 | 1.09 | 1.12 | 1.17 | 1.06 | 1.22 |
| Eugene, OR | 93 | 0.97 | Aug 2022 | 1.39 | 0.97 | 0.73 | 0.33 | 0.08 | 0.06 | 0.07 | 0.14 | 0.16 | 0.17 | 0.33 | 0.21 | 0.22 | 0.09 | 0.26 | 0.3 | 0.3 | 0.22 | 0.29 | 0.39 | 0.68 | 0.71 | 0.6 | 0.61 | 0.53 | 0.47 | 0.57 | 0.6 | 0.94 | 0.74 | 0.78 | 0.79 | 1.05 | 1.19 | 1.48 | 1.2 | 1.51 | 1.58 | 1.13 | 0.98 | 0.54 | 0.89 | 0.66 | 0.95 | 1.63 | 1.52 | 1.02 | 1.54 | 1.53 | 1.35 | 1.4 | 1.31 | 1.45 | 1.65 | 1.04 | 1.47 | 1.71 | 1.39 | 1.78 | 1.25 | 1.87 | 1.19 | 1.8 | 1.36 | 1.65 | 1.34 | 1.16 | 1.69 | 1.7 | 1.95 | 1.73 | 1.27 | 1.8 |
| Dallas, TX | 645 | 0.97 | Mar 2022 | 1.19 | 1.12 | 1.23 | 0.72 | 0.01 | 0.06 | 0.36 | 0.27 | 0.39 | 0.45 | 0.43 | 0.54 | 0.62 | 0.52 | 0.37 | 0.7 | 0.57 | 0.5 | 0.5 | 0.52 | 0.56 | 0.71 | 0.76 | 0.79 | 0.8 | 0.88 | 0.99 | 1.56 | 1.13 | 0.97 | 1.09 | 1.05 | 1.16 | 1.1 | 0.92 | 1.15 | 1.13 | 1.08 | 1.17 | 1.56 | 1.15 | 1.2 | 1.14 | 1.11 | 1.18 | 1.09 | 1.23 | 1.19 | 1.15 | 1.17 | 1.33 | 1.43 | 1.29 | 1.17 | 1.2 | 1.21 | 1.18 | 1.24 | 1.17 | 1.15 | 1.25 | 1.17 | 1.27 | 1.29 | 1.15 | 1.19 | 1.15 | 1.18 | 1.09 | 1.18 | 1.14 | 1.1 | 1.2 |
| Tampa, FL | 610 | 0.95 | Feb 2021 | 1.07 | 0.99 | 1.04 | 0.87 | 0.23 | 0.23 | 0.26 | 0.14 | 0.5 | 0.76 | 0.87 | 0.99 | 0.99 | 0.81 | 1.01 | 0.92 | 0.74 | 0.59 | 0.69 | 0.69 | 0.64 | 0.78 | 0.78 | 0.9 | 0.75 | 0.75 | 0.88 | 1.1 | 0.98 | 0.91 | 1.02 | 1.05 | 1.07 | 1.07 | 1.1 | 1.15 | 1.11 | 1.12 | 1.23 | 1.24 | 1.04 | 1.18 | 1.15 | 1.03 | 1.12 | 1.28 | 1.11 | 1.12 | 1.11 | 1.1 | 1.27 | 1.21 | 1.24 | 1.09 | 1 | 1.15 | 1.02 | 1.08 | 0.86 | 1.06 | 1.17 | 1.05 | 1.1 | 1.14 | 0.98 | 0.98 | 0.98 | 1.04 | 0.9 | 1.22 | 0.92 | 0.7 | 0.73 |
| St Louis, MO | 340 | 0.94 | Mar 2022 | 1.15 | 1.16 | 1.1 | 0.78 | 0.15 | 0.13 | 0.19 | 0.41 | 0.52 | 0.47 | 0.61 | 0.61 | 0.78 | 0.56 | 0.44 | 0.61 | 0.38 | 0.47 | 0.57 | 0.55 | 0.5 | 0.64 | 0.79 | 0.73 | 0.79 | 0.91 | 0.92 | 1.09 | 0.88 | 0.78 | 0.8 | 0.87 | 1.12 | 0.91 | 1.16 | 1.11 | 1.32 | 1.06 | 1.49 | 1.6 | 1.2 | 1.16 | 1.12 | 0.96 | 1.07 | 1.15 | 1.27 | 1.32 | 1.2 | 1.21 | 1.29 | 1.18 | 1.03 | 1.12 | 0.87 | 1.09 | 1.04 | 1.01 | 1.11 | 1.22 | 1.33 | 1.29 | 1.4 | 1.09 | 1.12 | 1.06 | 0.9 | 1.23 | 0.94 | 1.15 | 1.04 | 1.15 | 1.34 |
| Hartford, CT | 235 | 0.87 | Mar 2022 | 1.05 | 0.95 | 1 | 0.86 | 0.14 | 0.01 | 0.02 | 0.08 | 0.06 | 0.07 | 0.17 | 0.33 | 0.31 | 0.27 | 0.36 | 0.54 | 0.52 | 0.4 | 0.39 | 0.22 | 0.29 | 0.62 | 0.46 | 0.74 | 0.89 | 0.76 | 0.77 | 1.62 | 1.75 | 1.28 | 1.29 | 1 | 1.05 | 1.2 | 1.13 | 1.55 | 1.22 | 1.08 | 0.99 | 1.48 | 1.09 | 1.09 | 1.11 | 0.98 | 1.01 | 1.03 | 0.98 | 1.21 | 1.11 | 1.1 | 0.97 | 1.36 | 1.32 | 0.99 | 0.99 | 1.08 | 0.98 | 1.05 | 1.09 | 1.13 | 1.23 | 1.04 | 0.93 | 1.31 | 1.09 | 0.85 | 0.89 | 0.91 | 0.83 | 0.9 | 0.94 | 0.89 | 1.08 |
| Cincinnati, OH | 226 | 0.86 | Mar 2022 | 1.01 | 0 | 0 | 0 | 0 | 0.22 | 0.3 | 0.38 | 0.57 | 0.62 | 0.56 | 0.69 | 0.84 | 0.66 | 0.77 | 0.78 | 0.71 | 0.6 | 0.76 | 0.69 | 0.7 | 0.81 | 0.82 | 0.86 | 0.89 | 0.87 | 0.94 | 1.17 | 0.82 | 0.86 | 0.99 | 0.9 | 1.03 | 1.02 | 1.02 | 1.09 | 1.26 | 0.84 | 1.31 | 1.01 | 0.87 | 0.83 | 1.02 | 0.8 | 1.16 | 0.91 | 1.03 | 1.03 | 1.12 | 0.93 | 1.48 | 1.05 | 1.24 | 1.13 | 1.05 | 0.91 | 0.94 | 0.93 | 1.07 | 1.05 | 1.11 | 0.97 | 1.25 | 1.08 | 1.04 | 0.91 | 0.78 | 1.03 | 0.88 | 0.9 | 0.86 | 1.01 | 1.06 |
| Tacoma, WA | 193 | 0.85 | Sep 2022 | 1.27 | 0.87 | 0.97 | 0.61 | 0.03 | 0.01 | 0.02 | 0.03 | 0.07 | 0.16 | 0.17 | 0.17 | 0.15 | 0.1 | 0.18 | 0.19 | 0.14 | 0.14 | 0.12 | 0.15 | 0.24 | 0.27 | 0.23 | 0.27 | 0.58 | 0.52 | 0.61 | 0.72 | 0.63 | 0.73 | 0.8 | 0.94 | 0.96 | 1.02 | 0.9 | 0.8 | 0.79 | 0.42 | 0.9 | 1.08 | 1.06 | 0.94 | 1.02 | 1.24 | 1.42 | 1.36 | 1.43 | 1.44 | 1.48 | 1.05 | 1.5 | 1.37 | 1.37 | 1.48 | 1.45 | 1.38 | 1.39 | 1.65 | 1.51 | 1.3 | 1.26 | 1.22 | 1.41 | 1.41 | 1.25 | 1.26 | 1.12 | 1.34 | 1.28 | 1.23 | 1.26 | 1.08 | 1.84 |
| Palm Beach | 373 | 0.83 | Aug 2022 | 0.95 | 0.98 | 1.04 | 0.77 | 0.13 | 0.23 | 0.22 | 0.21 | 0.56 | 0.81 | 0.95 | 0.8 | 0.41 | 0.69 | 0.83 | 0.91 | 0.66 | 0.47 | 0.62 | 0.55 | 0.51 | 0.65 | 0.61 | 0.69 | 0.48 | 0.61 | 0.76 | 0.87 | 0.91 | 0.9 | 0.78 | 0.97 | 1.09 | 1.1 | 0.93 | 0.94 | 0.98 | 0.99 | 1 | 0.91 | 1.02 | 1.09 | 0.91 | 0.98 | 0.98 | 0.77 | 0.94 | 1.04 | 1 | 1.04 | 1.11 | 0.87 | 1.03 | 1.03 | 0.98 | 0.89 | 0.96 | 1.05 | 0.81 | 0.99 | 0.92 | 0.95 | 0.94 | 0.94 | 1.01 | 0.98 | 0.87 | 0.91 | 0.88 | 1.02 | 0.88 | 0.79 | 0.91 |
Page 1 of 2
Pooled filing index, all 32 cities · 72 rows
| Month | Filings vs. baseline (×) |
|---|---|
| Jan 2020 | 1.34 |
| Feb 2020 | 1.46 |
| Mar 2020 | 0.89 |
| Apr 2020 | 0.12 |
| May 2020 | 0.16 |
| Jun 2020 | 0.31 |
| Jul 2020 | 0.32 |
| Aug 2020 | 0.5 |
| Sep 2020 | 0.66 |
| Oct 2020 | 0.72 |
| Nov 2020 | 0.85 |
| Dec 2020 | 0.88 |
| Jan 2021 | 0.69 |
| Feb 2021 | 0.72 |
| Mar 2021 | 0.95 |
| Apr 2021 | 0.7 |
| May 2021 | 0.61 |
| Jun 2021 | 0.73 |
| Jul 2021 | 0.74 |
| Aug 2021 | 0.77 |
Page 1 of 4
Eviction Lab Eviction Tracking System (Princeton University) · 32 cities, January 2020 – December 2025 · ZIP Code Destiny, “The Filing Season”
Preview
How to read it
Each row is one unit and each column a period; colour says how far the value sits above or below that row’s own baseline, in ratio-symmetric classes. The line above is the pooled overview: brushing it zooms the grid to those periods, and the right-hand column averages each row over them.
When to use it
Indexes with a real midpoint (a baseline, a target, a prior period) across dozens of units and many periods, where a spaghetti chart would be unreadable.
Watch out for
Do not use a diverging scale without a meaningful midpoint, and do not compare colours as rates across rows, since each row is centred on itself. The window average is a mean of indexes, not a pooled ratio.
Data shape & units
periods: string[] (YYYY-MM keys get calendar labels); rows: { key, label?, values: (number | null)[], n?, flagged?, flagNote? }[]; context: (number | null)[] aligned with periods; window: { start, end } as period indices.
Missing values
Nulls paint no-data grey, never the low end of the ramp. A reported value that looks wrong, such as a zero before coverage began, keeps its colour and gains a marker and a tooltip note.
Controls & accessibility
Brush the overview with a pointer or its two keyboard handles; presets and a sort select sit beside it. Hovering a cell names its row, period, value and n and draws that row on the overview; a click or Enter pins it. Labels and summaries are text, and on narrow screens only the cells scroll.
Use the component
Install from the CTZN registry, then pass your prepared rows. Examples below illustrate the component contract.
npx shadcn add @ctzn-viz/heatmap-timeline<HeatmapTimeline periods={months} rows={cities}
context={national} midpoint={1}
window={win} onWindowChange={setWin} sort="window"
formatValue={{ kind: "number", digits: 2, suffix: "×" }}
ariaLabel="Eviction-filing index by city and month" />