Marginal effect
Compare a raw association with a model prediction holding covariates fixed.
- County
- Naive fit
- Adjusted fit, 95% band
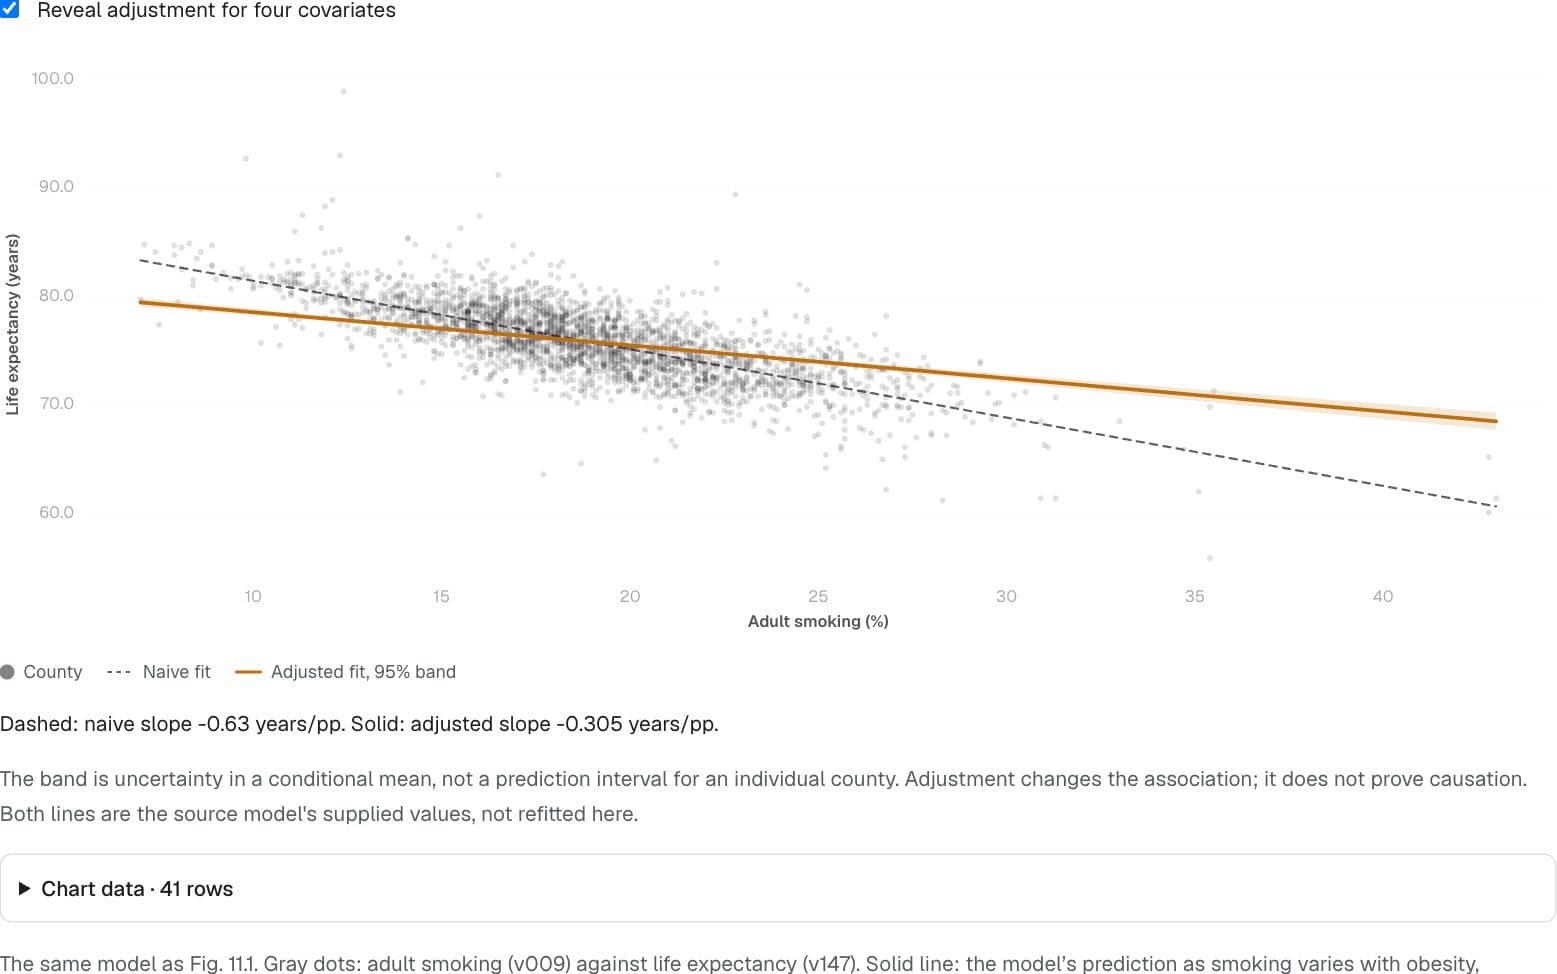
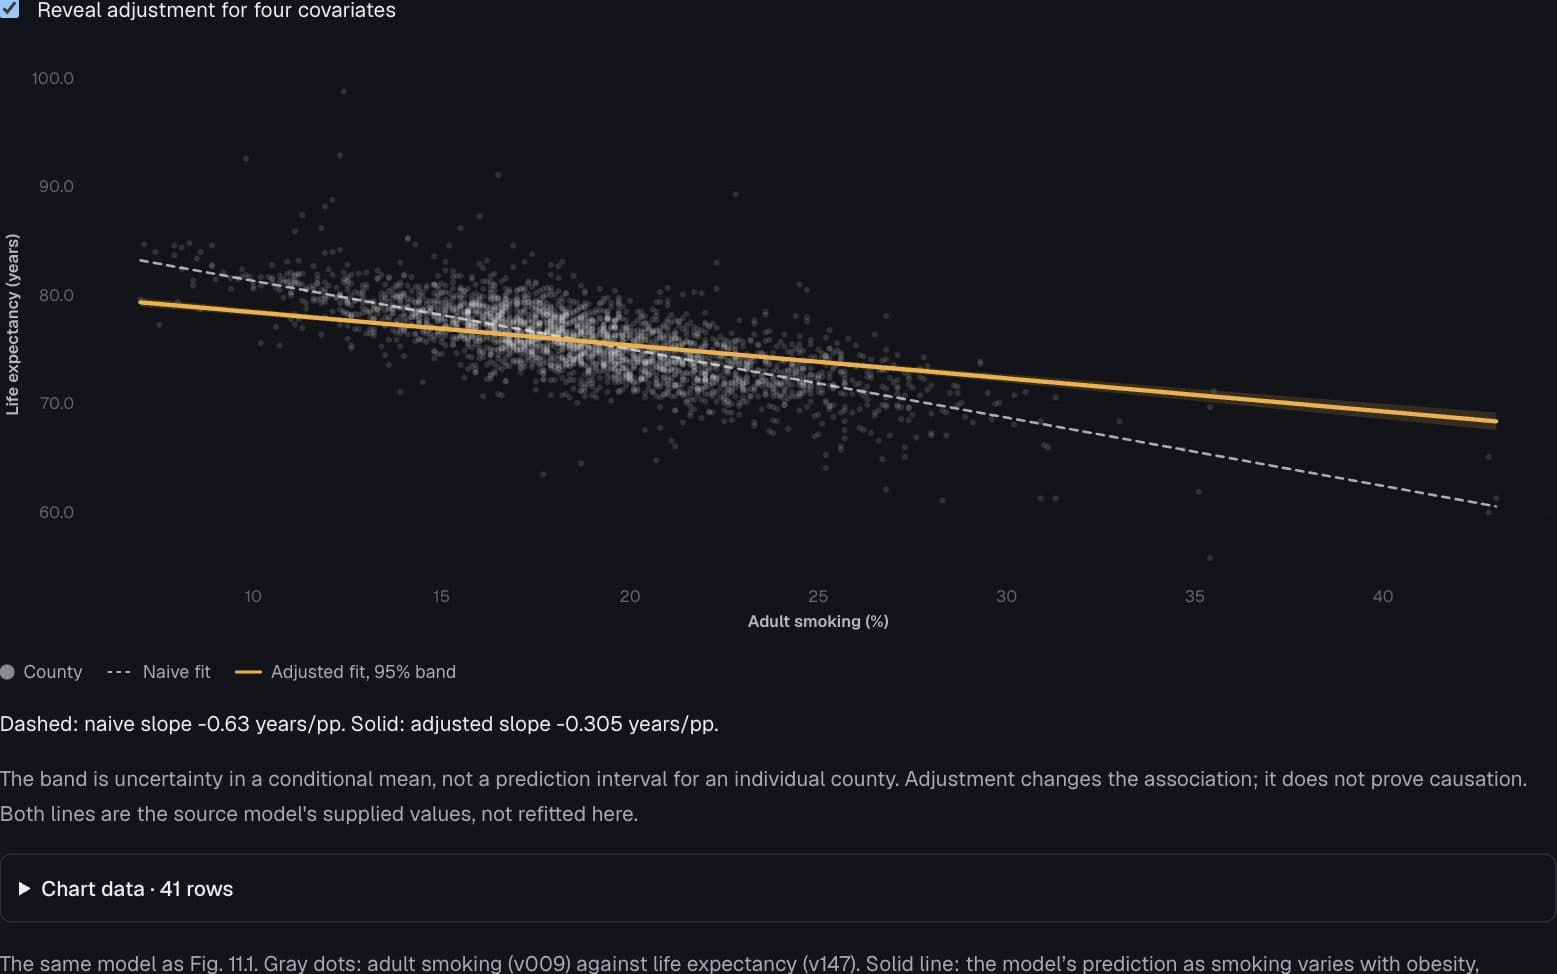
Dashed: naive slope -0.63 years/pp. Solid: adjusted slope -0.305 years/pp.
The band is uncertainty in a conditional mean, not a prediction interval for an individual county. Adjustment changes the association; it does not prove causation. Both lines are the source model's supplied values, not refitted here.
Chart data · 41 rows
| Smoking (%) | Conditional mean | Lower 95% | Upper 95% |
|---|---|---|---|
| 7 | 79.46 | 79.06 | 79.87 |
| 7.9 | 79.19 | 78.82 | 79.56 |
| 8.8 | 78.92 | 78.57 | 79.26 |
| 9.7 | 78.64 | 78.33 | 78.96 |
| 10.6 | 78.37 | 78.08 | 78.65 |
| 11.5 | 78.09 | 77.84 | 78.35 |
| 12.4 | 77.82 | 77.59 | 78.05 |
| 13.3 | 77.54 | 77.34 | 77.74 |
| 14.2 | 77.27 | 77.1 | 77.44 |
| 15.1 | 77 | 76.85 | 77.14 |
| 16 | 76.72 | 76.6 | 76.84 |
| 16.9 | 76.45 | 76.35 | 76.55 |
| 17.8 | 76.17 | 76.09 | 76.26 |
| 18.7 | 75.9 | 75.82 | 75.97 |
| 19.6 | 75.62 | 75.55 | 75.7 |
| 20.5 | 75.35 | 75.26 | 75.44 |
| 21.4 | 75.08 | 74.96 | 75.19 |
| 22.3 | 74.8 | 74.67 | 74.94 |
| 23.2 | 74.53 | 74.37 | 74.69 |
| 24.1 | 74.25 | 74.06 | 74.44 |
Page 1 of 3
The same model as Fig. 11.1. Gray dots: adult smoking (v009) against life expectancy (v147). Solid line: the model’s prediction as smoking varies with obesity, income, education and diabetes held at their means; band is ±1.96 standard errors of that conditional mean (σ²v′(X′X)⁻¹v). Dashed line: the naive one-variable least-squares fit.
County Health Rankings & Roadmaps 2024, UW Population Health Institute · CDC PLACES: Local Data for Better Health, County Data, 2025 release (data.cdc.gov swc5-untb)
Preview
How to read it
The dashed line is the naive fit; the solid line and band are the supplied conditional mean and its uncertainty.
When to use it
Explaining how adjustment changes a relationship.
Watch out for
Reveal adjustment to watch the slope change. A conditional mean interval is narrower than a prediction interval and is not a causal guarantee.
Data shape & units
data: {x,y}[] for the cloud, plus two line overlays supplied by the source model: a quiet naive fit {x,y}[] and an accent conditional mean {x,y,lo,hi}[] whose bounds become its band.
Missing values
Do not refit from a rounded example or extrapolate beyond the supplied covariate range.
Controls & accessibility
Toggle adjusted predictions; compare slopes and inspect conditional estimates.
Use the component
Install from the CTZN registry, then pass your prepared rows. Examples below illustrate the component contract.
npx shadcn add @ctzn-viz/scatter-regression<ScatterRegression data={points} fit="none" overlays={[
{ kind: "line", label: "Naive", data: naive, tone: "quiet" },
{ kind: "line", label: "Adjusted", data: adjusted, tone: "accent" },
]} xLabel="Smoking (%)" yLabel="Life expectancy"
ariaLabel="Adjusted smoking relationship" />