Rate with exposure
Read a rate across bins together with how many observations each bin holds.
CES 2008–2024 · pooled
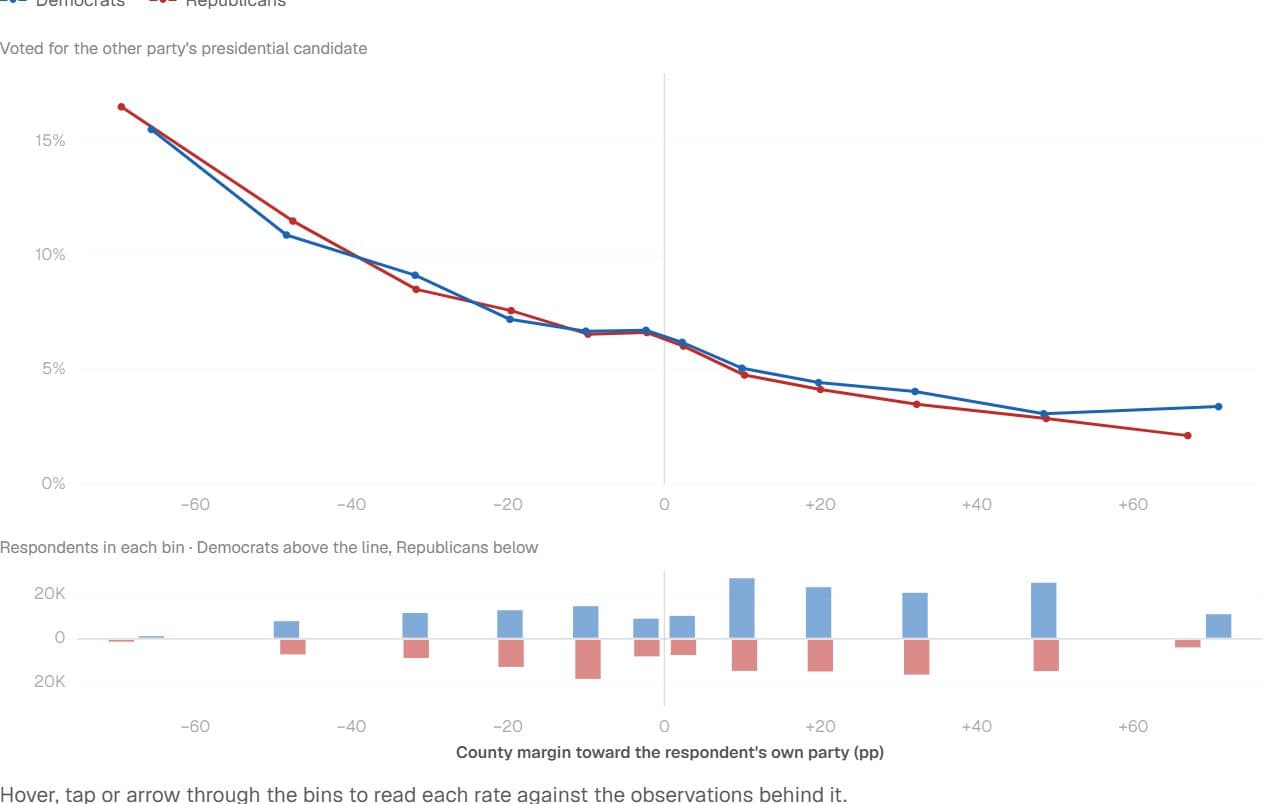
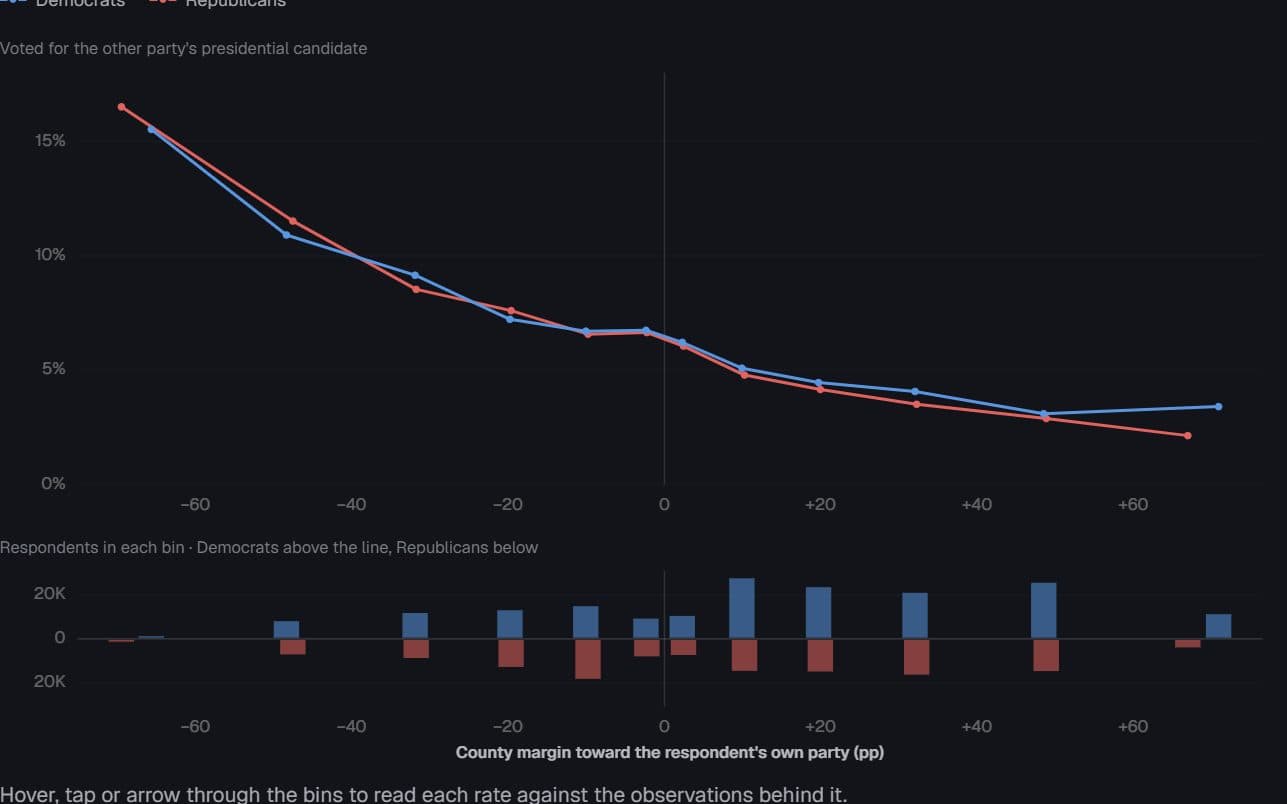
Share voting for the other party’s presidential candidate by the partisan lean of the respondent’s county, over how many respondents live at each lean. Switch the axis to the respondent’s own party and the two curves lie almost on top of each other.
- Democrats
- Republicans
Voted for the other party's presidential candidate
Respondents in each bin · Democrats above the line, Republicans below
Hover, tap or arrow through the bins to read each rate against the observations behind it.
Negative values are counties that lean toward the other party. Laid on this axis the two parties' curves nearly coincide: defection runs from about 2–3% where a respondent's own party dominates to about 16% where the other party does. The steepest points rest on the thinnest bins, as the counts beneath show. Intervals, when shown, assume simple random sampling and understate a weighted survey's uncertainty.
Chart data · 24 rows
| Party | County margin, D − R (pp) | Crossover (%) | Respondents |
|---|---|---|---|
| Democrats | -65.6 | 15.5 | 1,707 |
| Democrats | -48.4 | 10.9 | 8,561 |
| Democrats | -31.9 | 9.2 | 12,272 |
| Democrats | -19.8 | 7.2 | 13,551 |
| Democrats | -10.1 | 6.7 | 15,394 |
| Democrats | -2.4 | 6.7 | 9,731 |
| Democrats | 2.3 | 6.2 | 10,964 |
| Democrats | 9.9 | 5.1 | 28,119 |
| Democrats | 19.7 | 4.5 | 24,068 |
| Democrats | 32.1 | 4.1 | 21,488 |
| Democrats | 48.5 | 3.1 | 26,072 |
| Democrats | 70.9 | 3.4 | 11,742 |
| Republicans | -67 | 2.1 | 4,419 |
| Republicans | -48.8 | 2.9 | 15,231 |
| Republicans | -32.3 | 3.5 | 16,870 |
| Republicans | -20 | 4.2 | 15,418 |
| Republicans | -10.2 | 4.8 | 15,141 |
| Republicans | -2.4 | 6.1 | 7,918 |
| Republicans | 2.3 | 6.6 | 8,530 |
| Republicans | 9.8 | 6.6 | 18,805 |
Page 1 of 2
Cooperative Election Study (CES/CCES) cumulative file, 2008–2024 · voting-almanac aggregates
Preview
How to read it
The top panel is the rate; the bars beneath count the observations behind each point, mirrored when two groups share the axis. One cursor moves both panels and prints both values.
When to use it
Rates across a binned continuous variable — defection by county lean, mortality by income decile — especially when the extreme bins are thin.
Watch out for
Do not read the steepest point as the typical case; check the bar beneath it. Bars count observations rather than densities, so a wide bin can stand tall simply because it is wide.
Data shape & units
series: { key, label, color, bins: { x, rate, n }[] }[]. rate is a 0–1 proportion and x is the bin centre. Two series mirror their counts around zero.
Missing values
Drop bins with no observations rather than drawing a zero rate. The optional interval is an approximation from n alone, labelled as one, and off by default.
Controls & accessibility
Hover, tap or arrow through bins in either panel: the shared cursor moves both, and a status line reads the rate and n for every series. The example’s axis switch reorients one series so the two can be laid over each other.
Use the component
Install from the CTZN registry, then pass your prepared rows. Examples below illustrate the component contract.
npx shadcn add @ctzn-viz/rate-exposure<RateExposure series={[
{ key: "d", label: "Democrats", color: dem, bins: demBins },
{ key: "r", label: "Republicans", color: rep, bins: repBins },
]} referenceX={0} formatRate={{ kind: "rate", digits: 1 }}
ariaLabel="Crossover rate by county margin" />