Forecast fan
Show a predictive distribution instead of a single promised future.
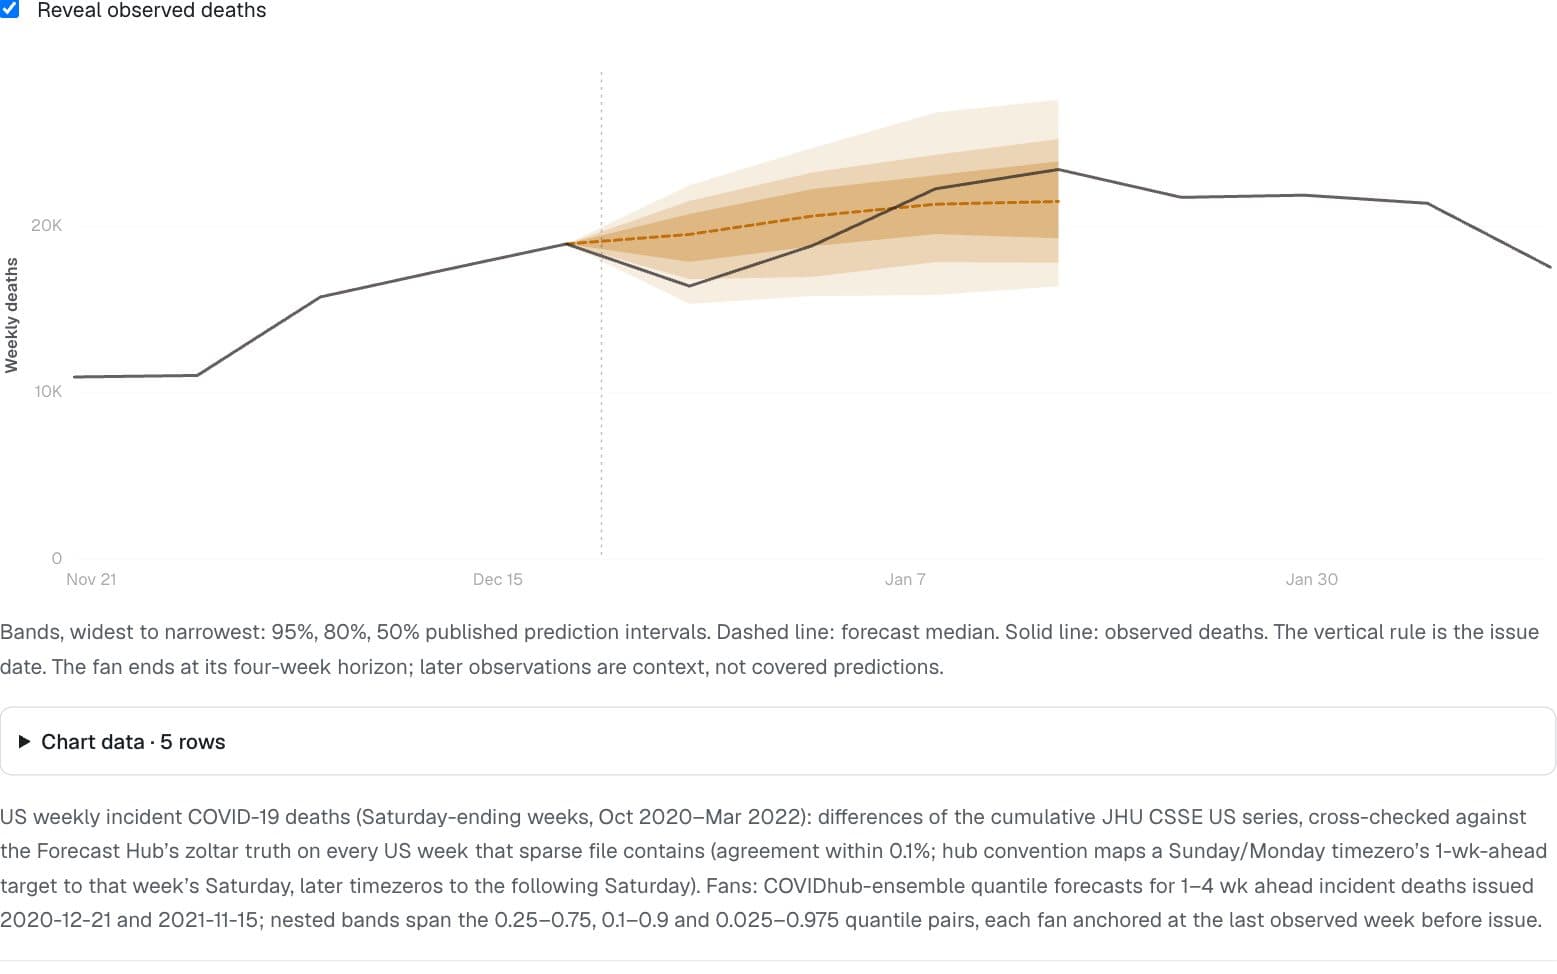
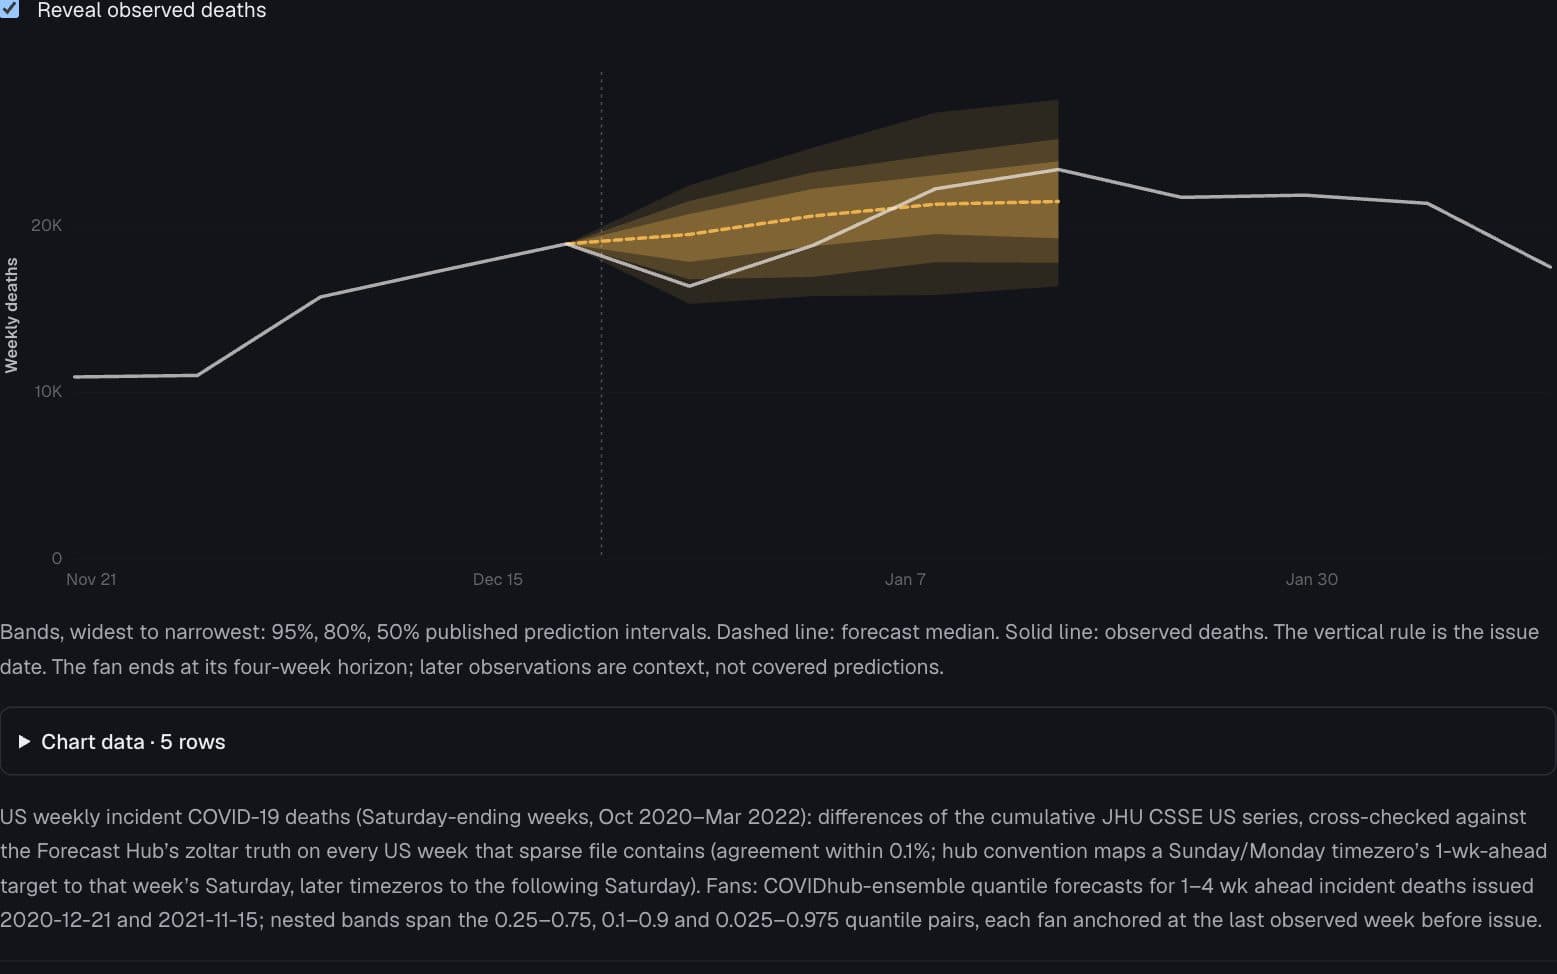
Bands, widest to narrowest: 95%, 80%, 50% published prediction intervals. Dashed line: forecast median. Solid line: observed deaths. The vertical rule is the issue date. The fan ends at its four-week horizon; later observations are context, not covered predictions.
Chart data · 5 rows
| Week ending | Median | 2.5% | 10% | 25% | 75% | 90% | 97.5% |
|---|---|---|---|---|---|---|---|
| 2020-12-19 | 18,934 | 18,934 | 18,934 | 18,934 | 18,934 | 18,934 | 18,934 |
| 2020-12-26 | 19,507 | 15,340 | 16,821 | 17,859 | 20,732 | 21,517 | 22,454 |
| 2021-01-02 | 20,608 | 15,803 | 16,950 | 18,791 | 22,228 | 23,229 | 24,695 |
| 2021-01-09 | 21,318 | 15,871 | 17,840 | 19,527 | 23,059 | 24,284 | 26,809 |
| 2021-01-16 | 21,484 | 16,391 | 17,804 | 19,274 | 23,887 | 25,230 | 27,595 |
Page 1 of 1
US weekly incident COVID-19 deaths (Saturday-ending weeks, Oct 2020–Mar 2022): differences of the cumulative JHU CSSE US series, cross-checked against the Forecast Hub’s zoltar truth on every US week that sparse file contains (agreement within 0.1%; hub convention maps a Sunday/Monday timezero’s 1-wk-ahead target to that week’s Saturday, later timezeros to the following Saturday). Fans: COVIDhub-ensemble quantile forecasts for 1–4 wk ahead incident deaths issued 2020-12-21 and 2021-11-15; nested bands span the 0.25–0.75, 0.1–0.9 and 0.025–0.975 quantile pairs, each fan anchored at the last observed week before issue.
Cramer EY et al. "The United States COVID-19 Forecast Hub dataset." Scientific Data 9, 462 (2022). · Cramer EY et al., Scientific Data 9, 462 (2022). · JHU CSSE COVID-19 Data via US COVID-19 Forecast Hub zoltar-truth. · Dong E, Du H, Gardner L. "An interactive web-based dashboard to track COVID-19 in real time." Lancet Inf Dis 2020; JHU CSSE COVID-19 Data (archived 2023).
Preview
How to read it
Nested bands span 50%, 80% and 95% published quantiles. The dashed forecast and solid observation are distinct.
When to use it
Archived forecasts with known issue dates, target dates and subsequently observed outcomes.
Watch out for
Reveal observed deaths to see a forecast miss. Future observations beyond the four-week fan are not tests of that forecast horizon.
Data shape & units
observed: {x,y}[]; forecast: {x,median,lo95,hi95,lo80,hi80,lo50,hi50}[]; issued is a UTC timestamp.
Missing values
Preserve published quantiles and their nesting. Do not extend a four-week forecast into the rest of a series.
Controls & accessibility
Switch issue dates and reveal observations. The tooltip reads the median and all three intervals for a week; tables list the original quantiles.
Use the component
Install from the CTZN registry, then pass your prepared rows. Examples below illustrate the component contract.
npx shadcn add @ctzn-viz/forecast-fan<ForecastFan observed={actual} forecast={quantiles} issued={issueTimestamp}
yLabel="Weekly deaths" ariaLabel="Archived forecast and outcomes" />