Forest plot & ranked estimates
Show an estimate and its uncertainty on a shared quantitative axis.
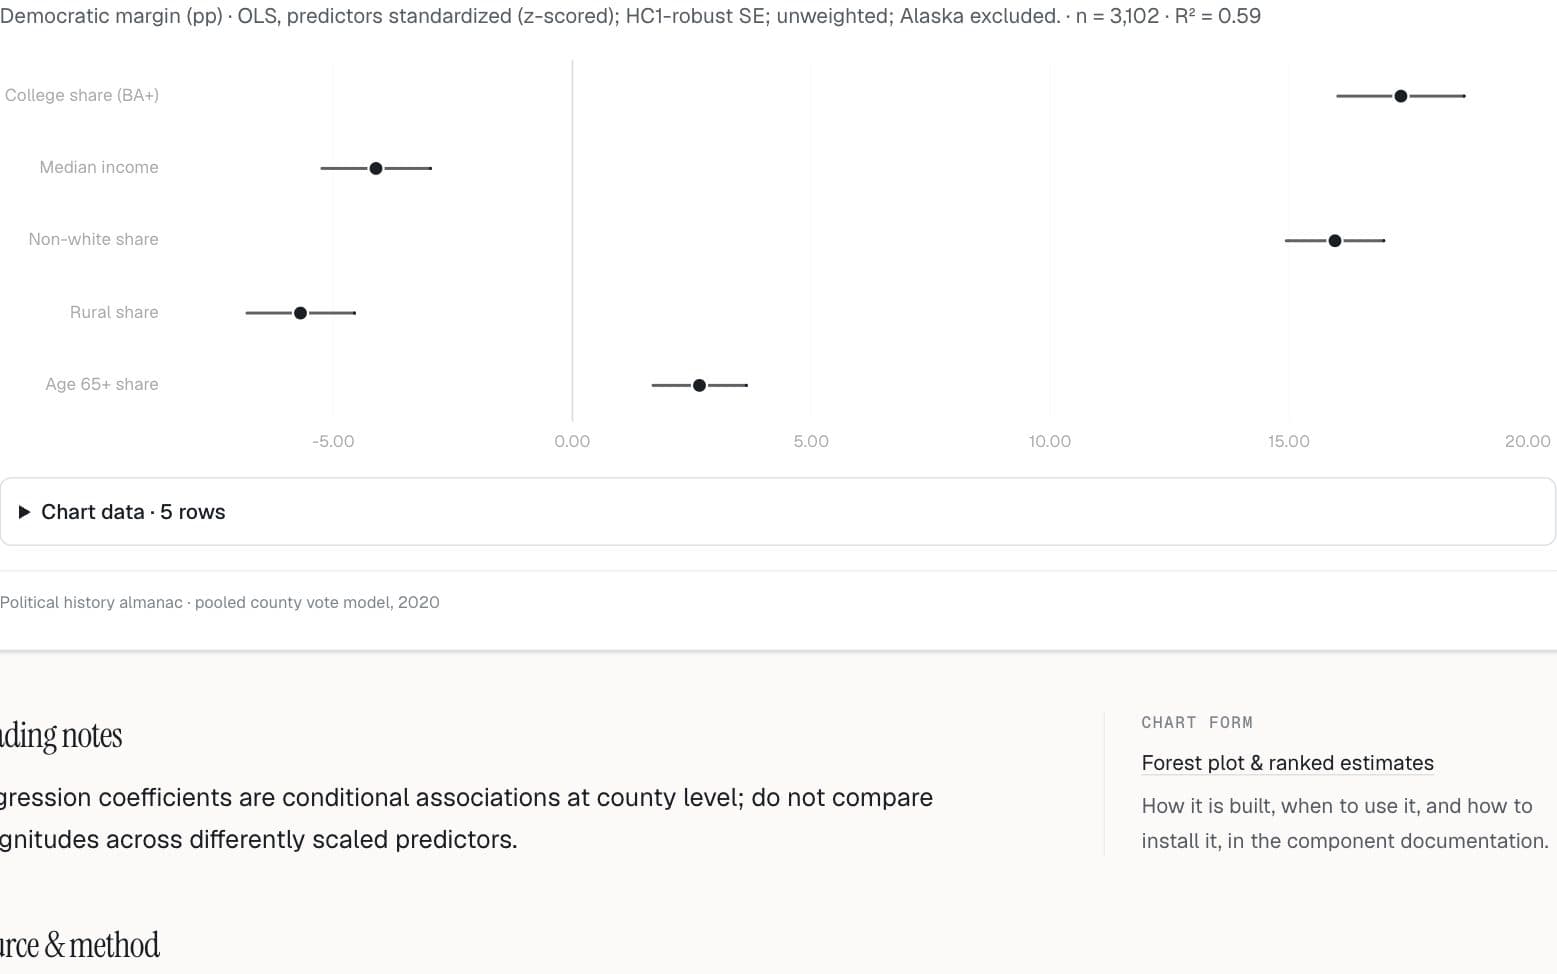
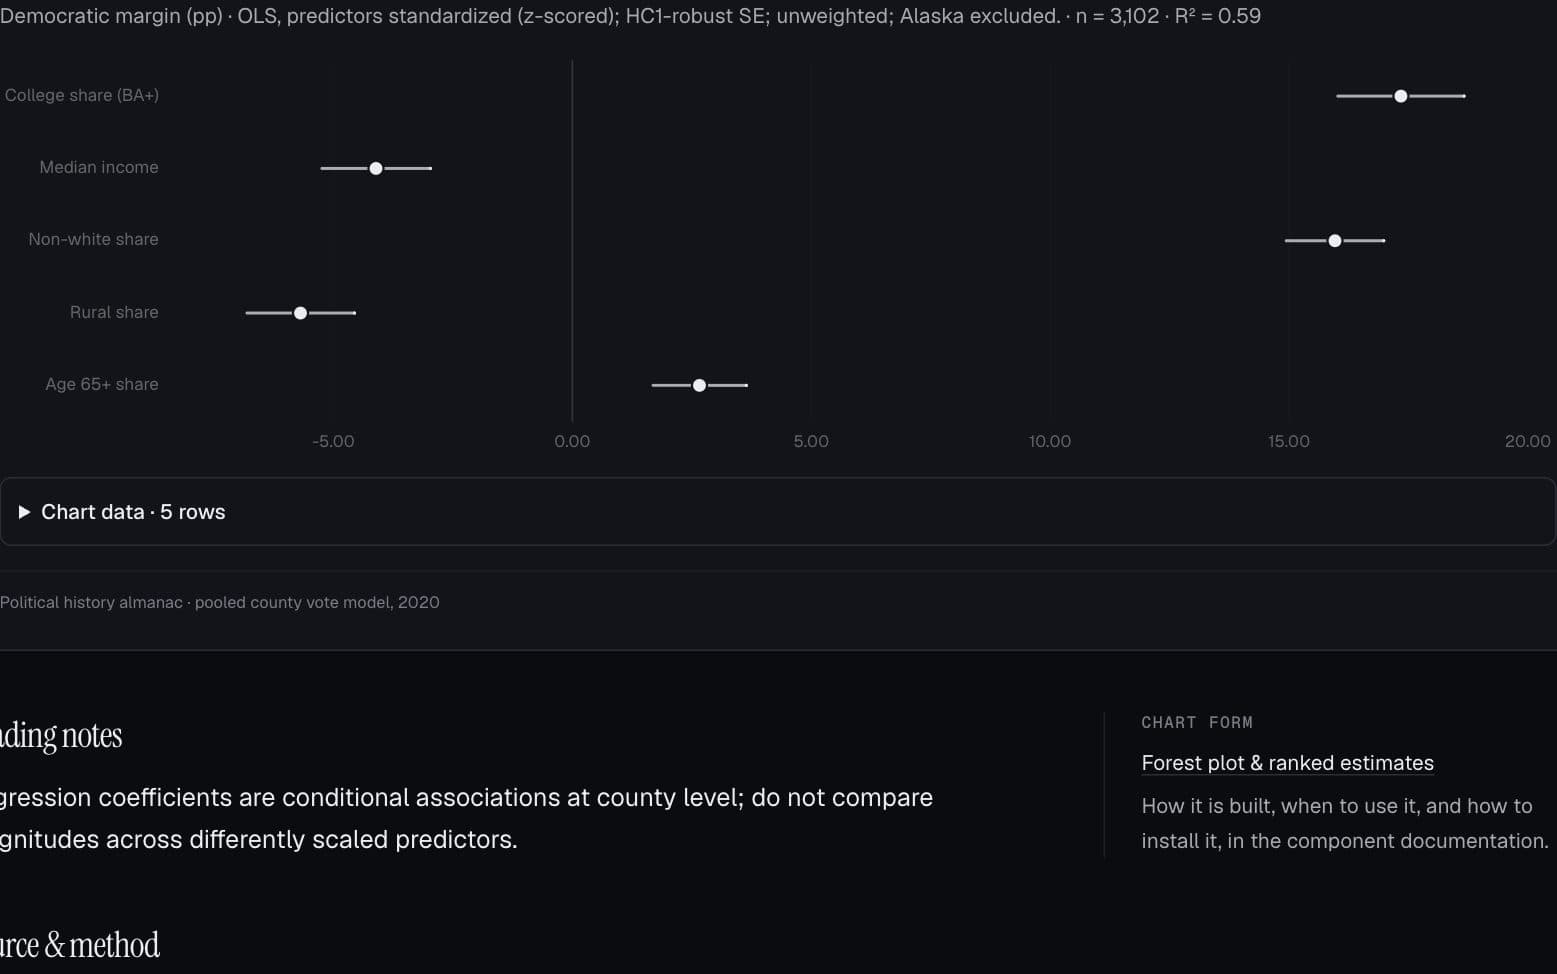
Democratic margin (pp) · OLS, predictors standardized (z-scored); HC1-robust SE; unweighted; Alaska excluded. · n = 3,102 · R² = 0.59
Chart data · 5 rows
| Predictor | Coefficient | Lower bound | Upper bound |
|---|---|---|---|
| College share (BA+) | 17.34 | 16.02 | 18.66 |
| Median income | -4.11 | -5.24 | -2.97 |
| Non-white share | 15.96 | 14.94 | 16.98 |
| Rural share | -5.69 | -6.81 | -4.56 |
| Age 65+ share | 2.66 | 1.69 | 3.64 |
Page 1 of 1
Political history almanac · pooled county vote model, 2020
Preview
How to read it
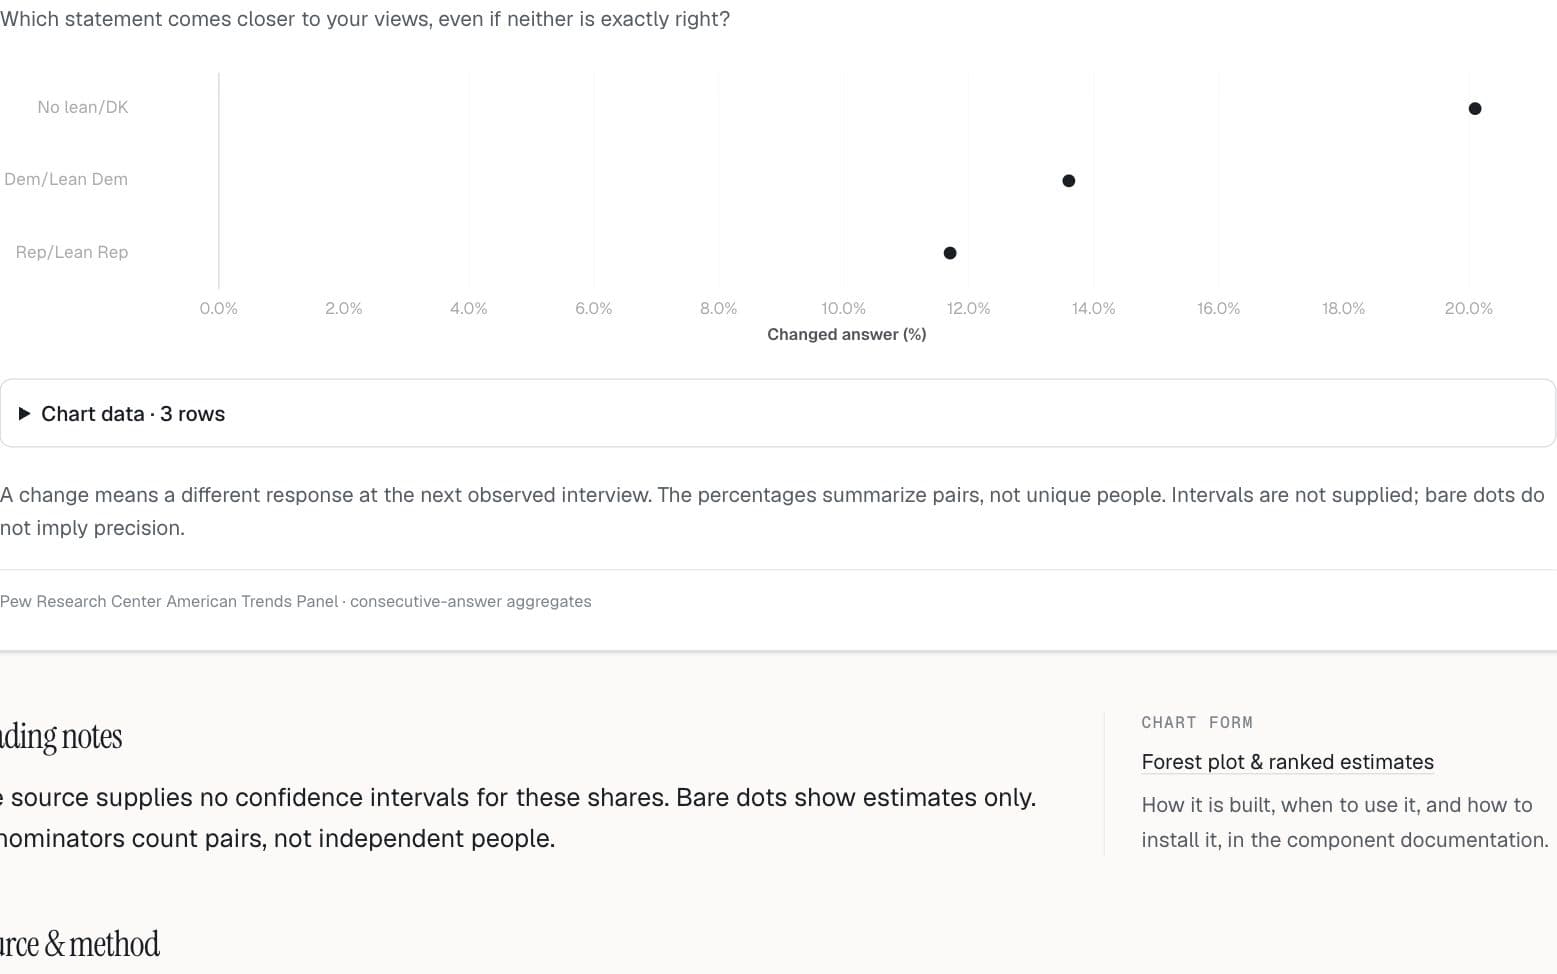
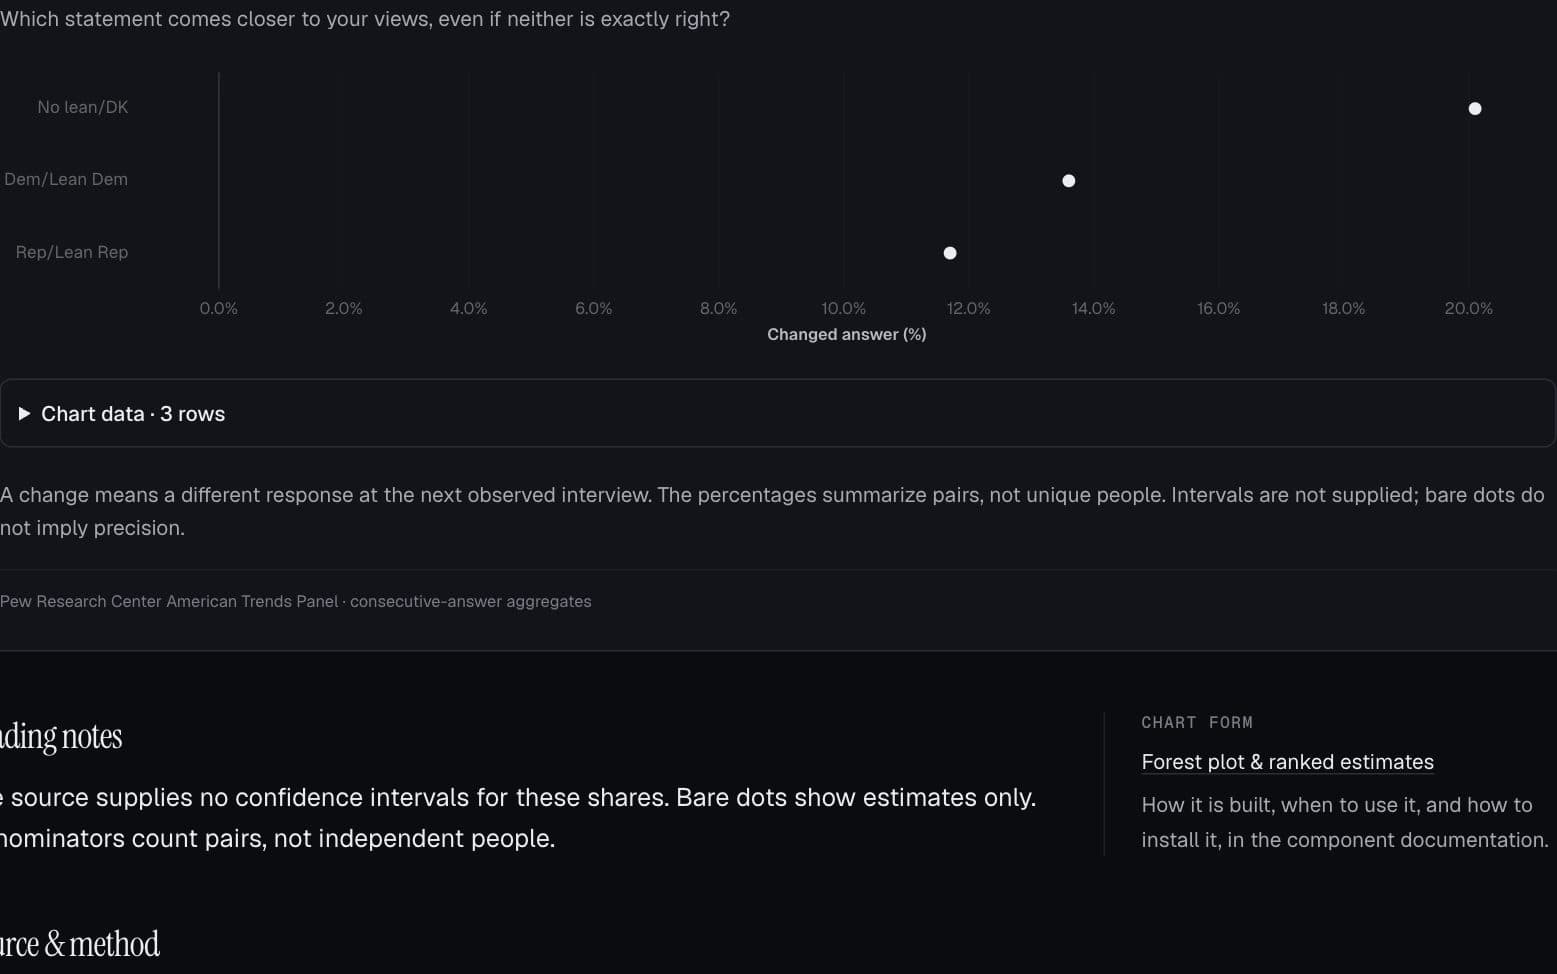
A dot marks the estimate and a whisker its supplied interval. The reference rule provides context. A dot without a whisker means uncertainty was not supplied.
When to use it
Regression coefficients, subgroup estimates and survey contrasts. Bare-dot variants can show estimates whose uncertainty is unavailable.
Watch out for
Do not rank incomparable coefficient units, invent confidence intervals, or equate overlapping intervals with a formal test of a difference.
Data shape & units
{ label, estimate, lo?, hi?, group?, n? }[]. Bounds must use the same units as the estimate. domain optionally fixes a common scale across panels.
Missing values
Omit both bounds when an interval is unavailable. Keep a missing estimate out of the plot and explain the omission; zero is a measured value.
Controls & accessibility
Use sorting or group controls when they answer a real comparison. The example tables provide the estimates, bounds and counts without relying on hover.
Use the component
Install from the CTZN registry, then pass your prepared rows. Examples below illustrate the component contract.
npx shadcn add @ctzn-viz/forest-plot<ForestPlot data={estimates} reference={0}
xLabel="Coefficient"
formatValue={{ kind: "number", digits: 2 }}
ariaLabel="County vote model coefficients" />