Linked map and scatter
One set of places drawn twice — where they are, and what they are — so a pattern found in either view can be located in the other.
DIME donors × 2020 returns · 2,839 counties
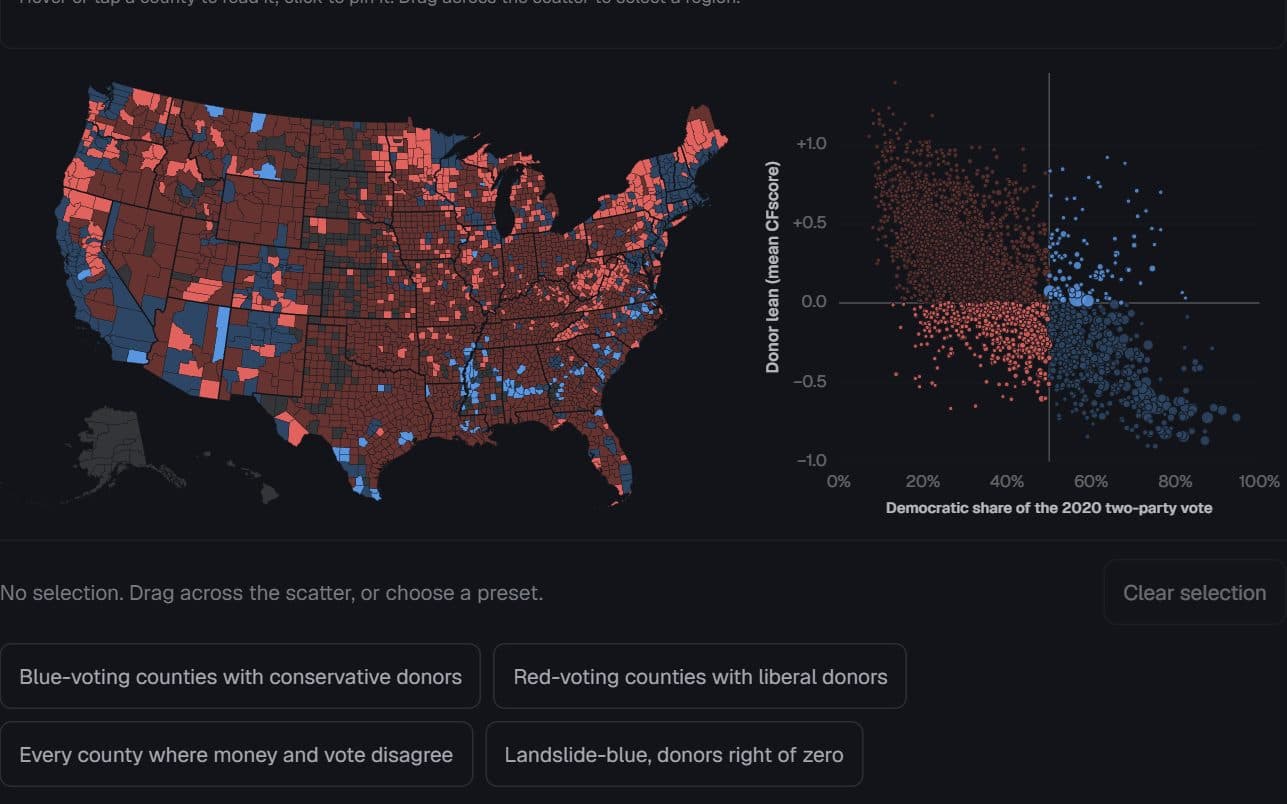
Each county’s 2020 presidential vote, and the lean of its reliable individual donors. Hue is the vote; saturated counties are those whose donors lean the other way. Brush the scatter to find them on the map.
Across the country, a county's donors usually lean the way it votes (population-weighted r = −0.85). In 20% of counties they lean the other way, and those counties cluster. Select a cell of the key, a preset, or drag across the scatter.
Donors →
LeftRight
RepDem
2020 vote →
Under 25 donors
County data · 2,839 rows
| County | FIPS | Dem share (%) | Donor CFscore | Cell | Black (%) | Reliable donors | Population |
|---|---|---|---|---|---|---|---|
| County 26145 | 26145 | 50.1 | -0.03 | Voted Democratic, donors lean left | 18.2 | 2,611 | 190,124 |
| County 26065 | 26065 | 66.4 | -0.33 | Voted Democratic, donors lean left | 11.1 | 9,117 | 284,900 |
| County 26139 | 26139 | 39.1 | 0.07 | Voted Republican, donors lean right | 1.5 | 3,634 | 296,200 |
| County 26125 | 26125 | 57.1 | -0.22 | Voted Democratic, donors lean left | 12.9 | 33,789 | 1,274,395 |
| County 26005 | 26005 | 37.1 | -0.07 | Voted Republican, donors lean left | 1.2 | 1,465 | 120,502 |
| County 06075 | 06075 | 87.0 | -0.87 | Voted Democratic, donors lean left | 4.8 | 45,868 | 873,965 |
| County 12073 | 12073 | 64.3 | -0.19 | Voted Democratic, donors lean left | 30.5 | 8,772 | 292,198 |
| County 17085 | 17085 | 41.6 | -0.41 | Voted Republican, donors lean left | 0.7 | 267 | 22,035 |
| County 26093 | 26093 | 38.5 | -0.04 | Voted Republican, donors lean left | 0.6 | 3,495 | 193,866 |
| County 25017 | 25017 | 73.1 | -0.64 | Voted Democratic, donors lean left | 4.8 | 65,745 | 1,632,002 |
| County 25023 | 25023 | 58.9 | -0.28 | Voted Democratic, donors lean left | 8.4 | 11,536 | 530,819 |
| County 29189 | 29189 | 62.2 | -0.27 | Voted Democratic, donors lean left | 24.1 | 18,470 | 1,004,125 |
| County 55031 | 55031 | 54.8 | -0.23 | Voted Democratic, donors lean left | 1 | 709 | 44,295 |
| County 37081 | 37081 | 61.7 | -0.2 | Voted Democratic, donors lean left | 33.7 | 6,703 | 541,299 |
| County 26037 | 26037 | 46.7 | -0.05 | Voted Republican, donors lean left | 1.8 | 1,513 | 79,128 |
| County 36061 | 36061 | 87.6 | -0.72 | Voted Democratic, donors lean left | 12.4 | 82,833 | 1,694,251 |
| County 24023 | 24023 | 21.5 | 0.14 | Voted Republican, donors lean right | 0.9 | 287 | 28,806 |
| County 42003 | 42003 | 60.3 | -0.36 | Voted Democratic, donors lean left | 12.6 | 22,455 | 1,250,578 |
| County 36047 | 36047 | 77.6 | -0.82 | Voted Democratic, donors lean left | 28 | 53,300 | 2,736,074 |
| County 06013 | 06013 | 73.1 | -0.71 | Voted Democratic, donors lean left | 8.1 | 32,404 | 1,165,927 |
Page 1 of 142
Donor lean is the mean CFscore of a county's reliable individual donors in DIME v4.0 — people who gave to at least eight distinct recipients, located at their most recent address; negative is left. Counties with fewer than 25 reliable donors, and Alaska, have no estimate and stay grey. The rules at 50% and 0 are the class borders, so a dot's quadrant is its county's colour. Because the national donor pool leans left, a Republican county's “left” donors are often only just left of zero; the firmer divergence is the Democratic counties with donors on the right. Among Democratic-voting counties, donor lean and Black share correlate at +0.63. Adding donor lean to a demographic model of the vote raises R² from 0.60 to 0.79 — an association, not a cause. Strictly descriptive: a county's donor mean says nothing about any one resident.
Stanford DIME v4.0 (reliable individual donors, county means) × 2020 county presidential returns · 2,839 counties
Preview
How to read it
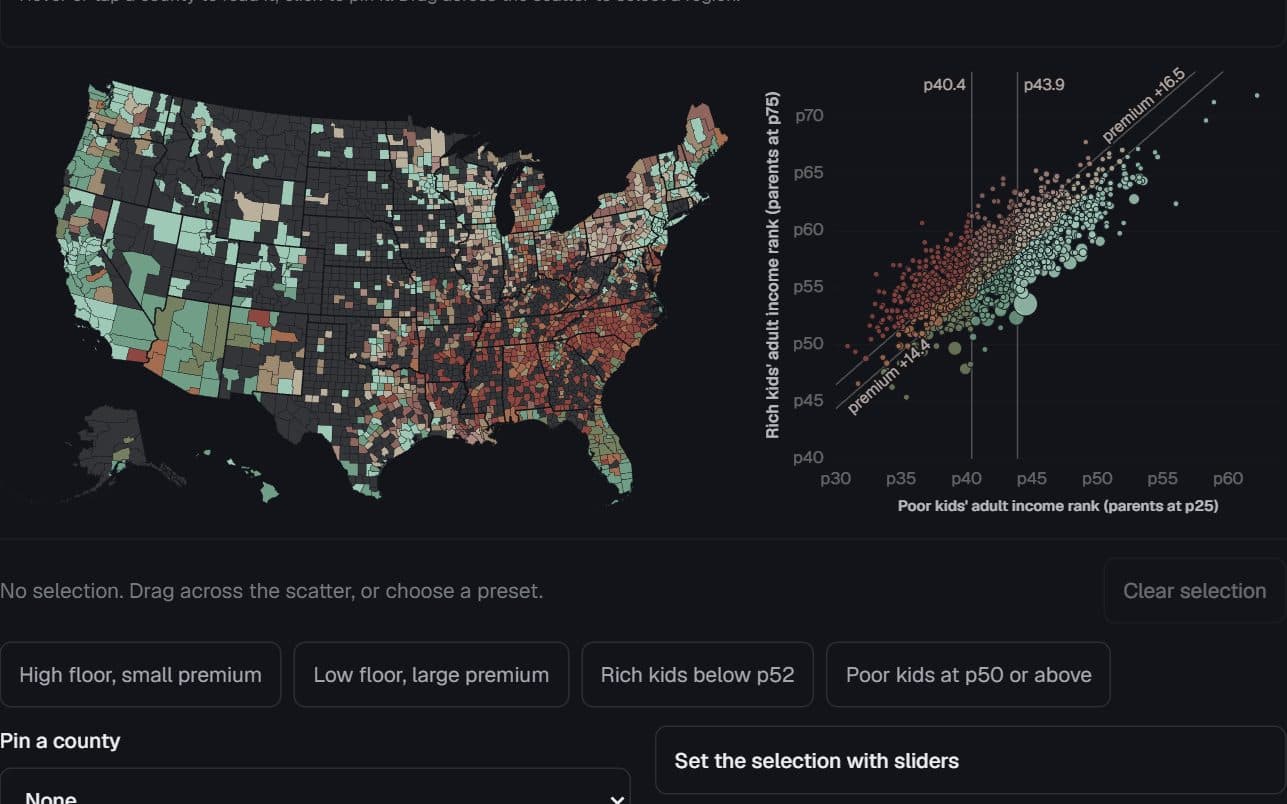
Each county is a shape on the map and a dot in the scatter, in the same colour. Hover either to outline it in both and read it once, above them. A dot’s quadrant or cell is its county’s colour; drag across the scatter and the map lights where those counties are.
When to use it
Two county measures whose relationship has a geography: donor lean against the vote, a poor-kid outcome against a rich-kid outcome. Aggregates keyed by an id the geometry shares.
Watch out for
Do not read a county aggregate as the behaviour of its residents. Avoid bivariate colour past 3×3. At phone widths the map shows regions, not individual small counties — rely on the scatter, list and table there.
Data shape & units
records: { id, label, group?, x, y, cls, weight? }[] joined to GeoJSON features by id; classes: { key, label, color }[] in paint order; explicit xDomain and yDomain. Colours come from the resolver: semantic party colour, or resolver.bivariate(3).
Missing values
A feature without a record paints in the semantic no-data grey and reads as “no estimate”, with a per-place reason where one differs (suppressed, outside coverage, boundaries the geometry predates). Records without geometry still appear in the scatter and table.
Controls & accessibility
Hover links the views; a click or the pin list pins a county; dragging draws a 2-D brush that moves and resizes by its edges and cancels with Escape. Presets, legend cells and four range sliders reach every selection from the keyboard; a status line reports the count and weight share; the table follows the selection.
Use the component
Install from the CTZN registry, then pass your prepared rows. Examples below illustrate the component contract.
npx shadcn add @ctzn-viz/linked-map-scatter<LinkedMapScatter records={counties} features={geo.counties}
mesh={geo.states} classes={classes}
xDomain={[0, 1]} yDomain={[-1, 1.45]}
xLabel="Democratic share of the 2020 two-party vote"
yLabel="Donor lean (mean CFscore)"
references={{ x: [{ value: 0.5 }], y: [{ value: 0 }] }}
sizeByWeight presets={presets}
mapAriaLabel="County map" scatterAriaLabel="County scatter" />Examples using this form
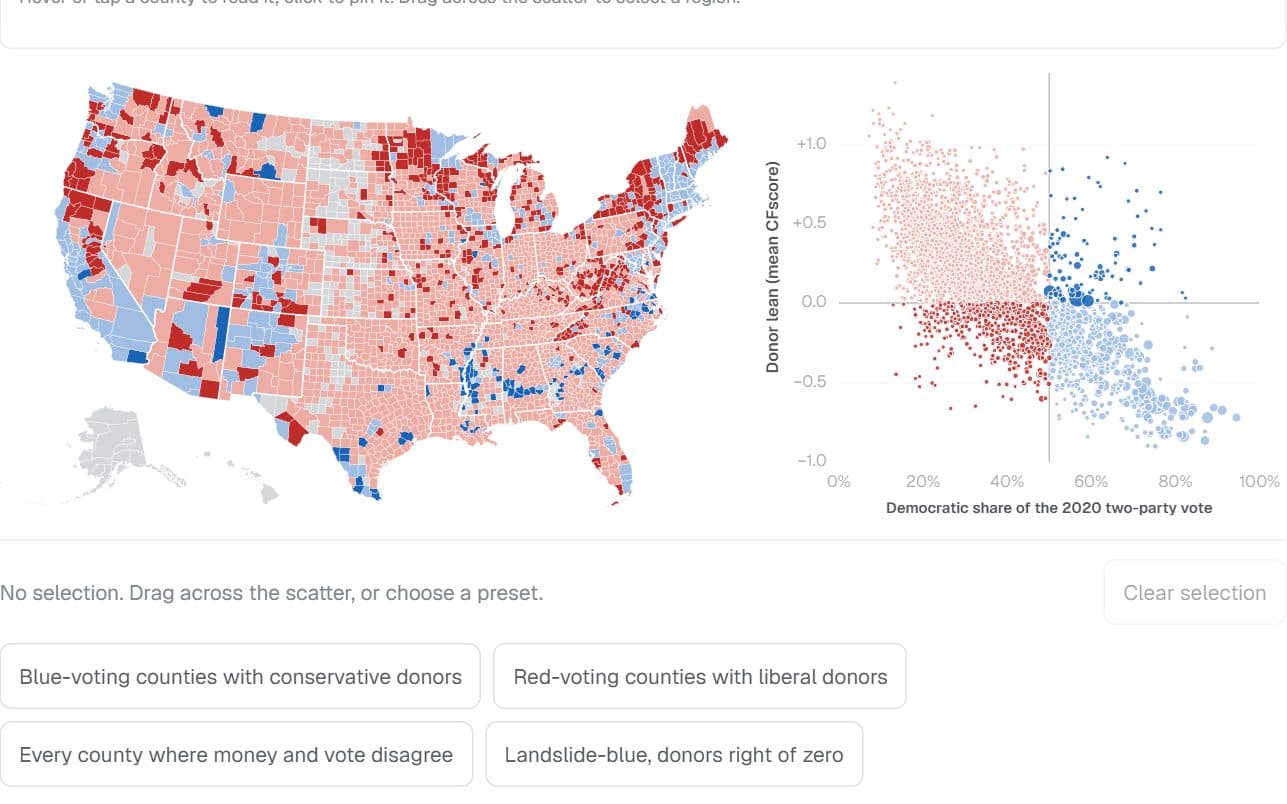
2,839 US counties · Stanford DIME donors and 2020 presidential returns
Where the money and the vote disagree
Which counties vote one way while their reliable donors lean the other — and who lives there?
Hides: Individuals. A county’s donor average says nothing about any one resident, and the national donor pool leans left.
Try it: Select counties on the scatter
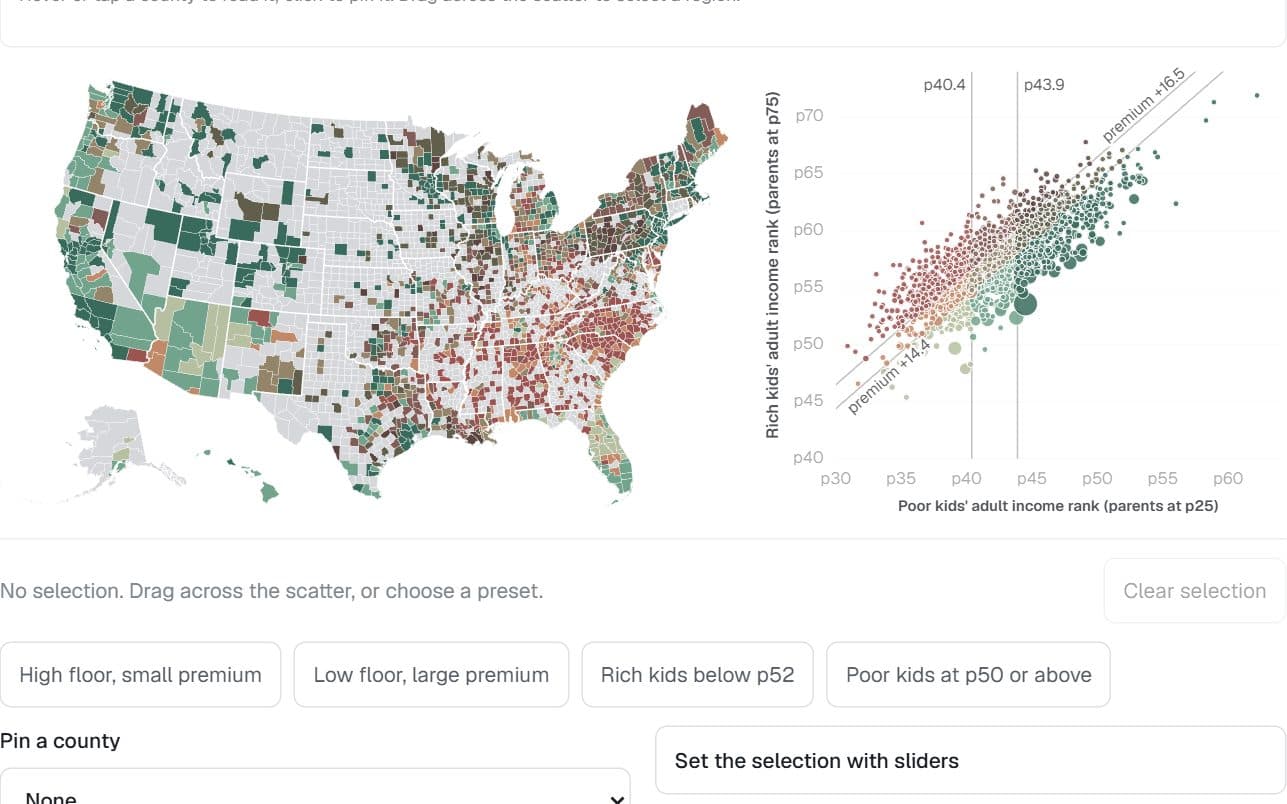
1,581 US counties · Opportunity Atlas, children born 1978–83
Where birth buys the most
Where does a comfortable birth buy the most extra adult income — and is a small premium good news?
Hides: What place does on its own. Effects of place are mixed with who lives there.
Try it: Select counties on the scatter