Health
See variation between places, relationships between outcomes, and the uncertainty behind an estimate.
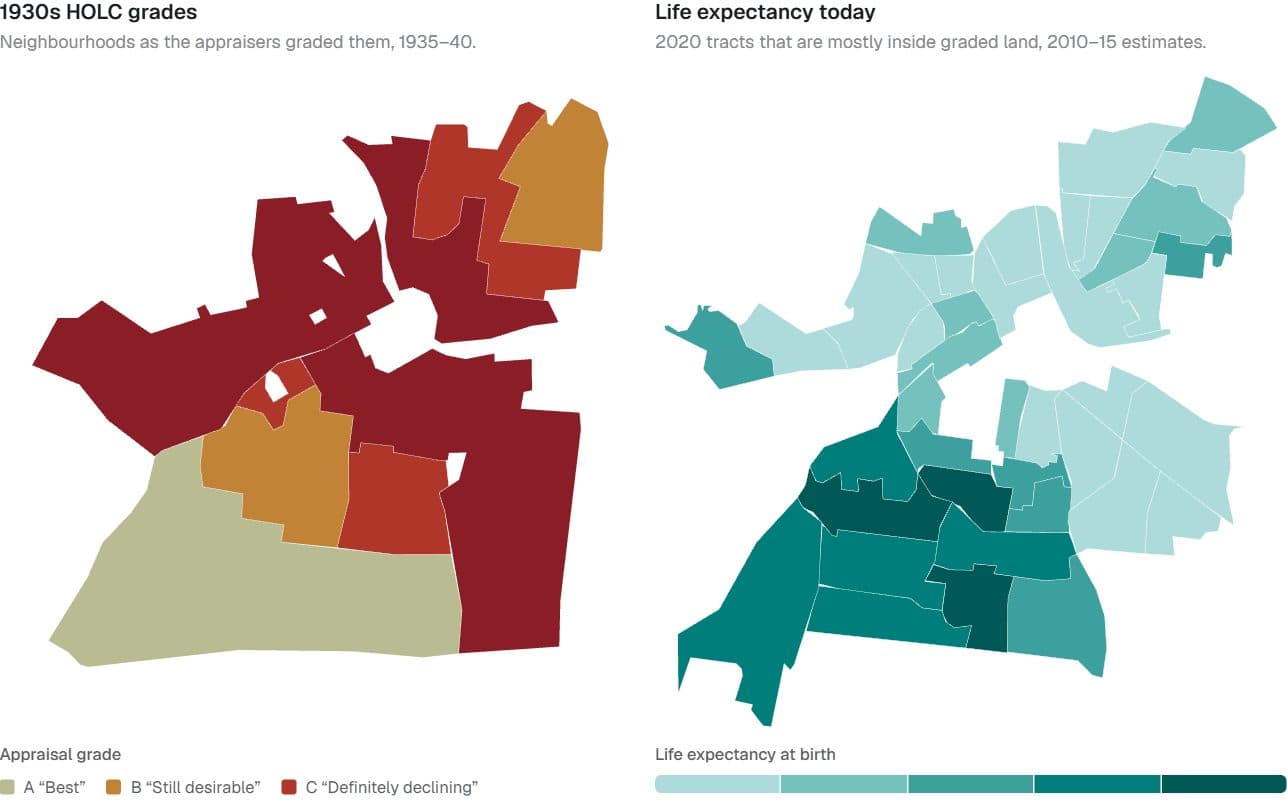
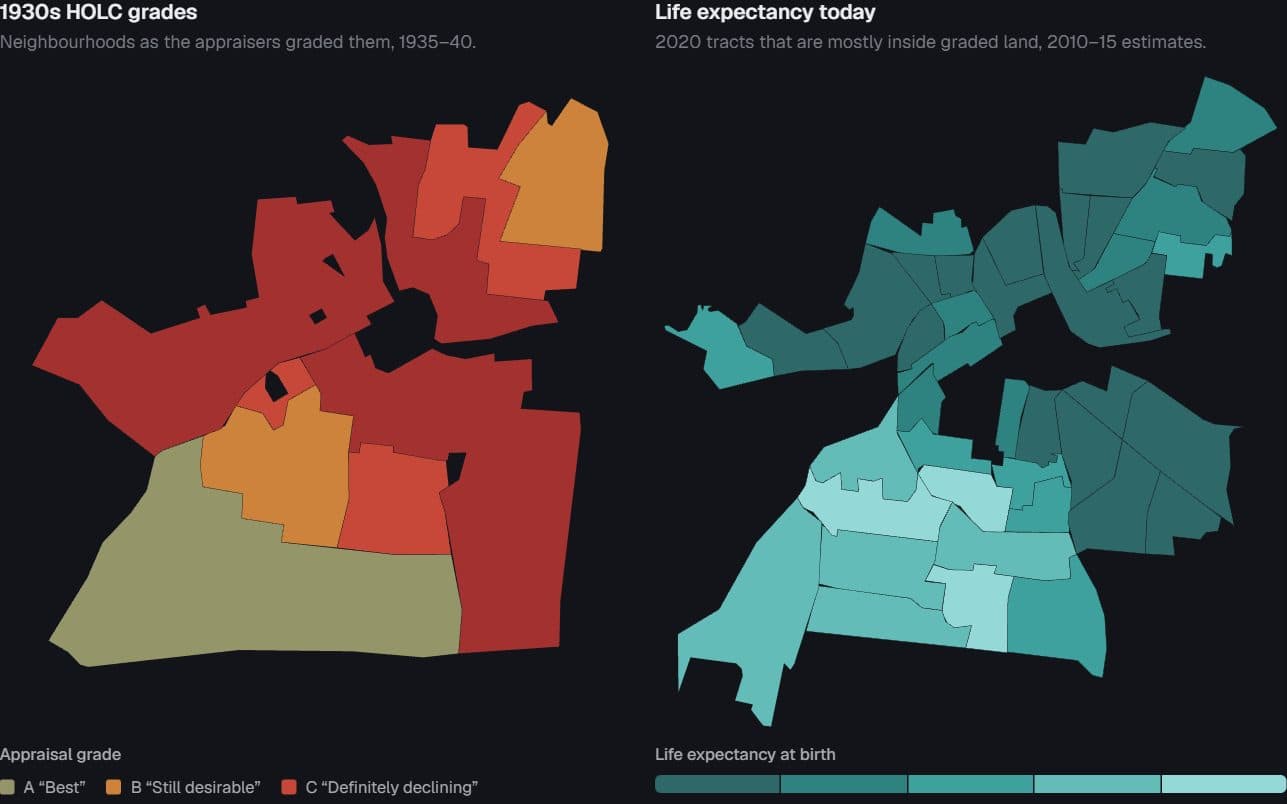
US cities · 1930s redlining maps and NCHS tract life expectancy, 2010–15
Redlined then, shorter lives now
Do neighbourhoods the 1930s appraisers graded “hazardous” still live shorter lives?
Hides: Cause. Appraisers drew red lines around neighbourhoods that were already poorer and more often Black.
Try it: Switch cities · Point at a place on either map
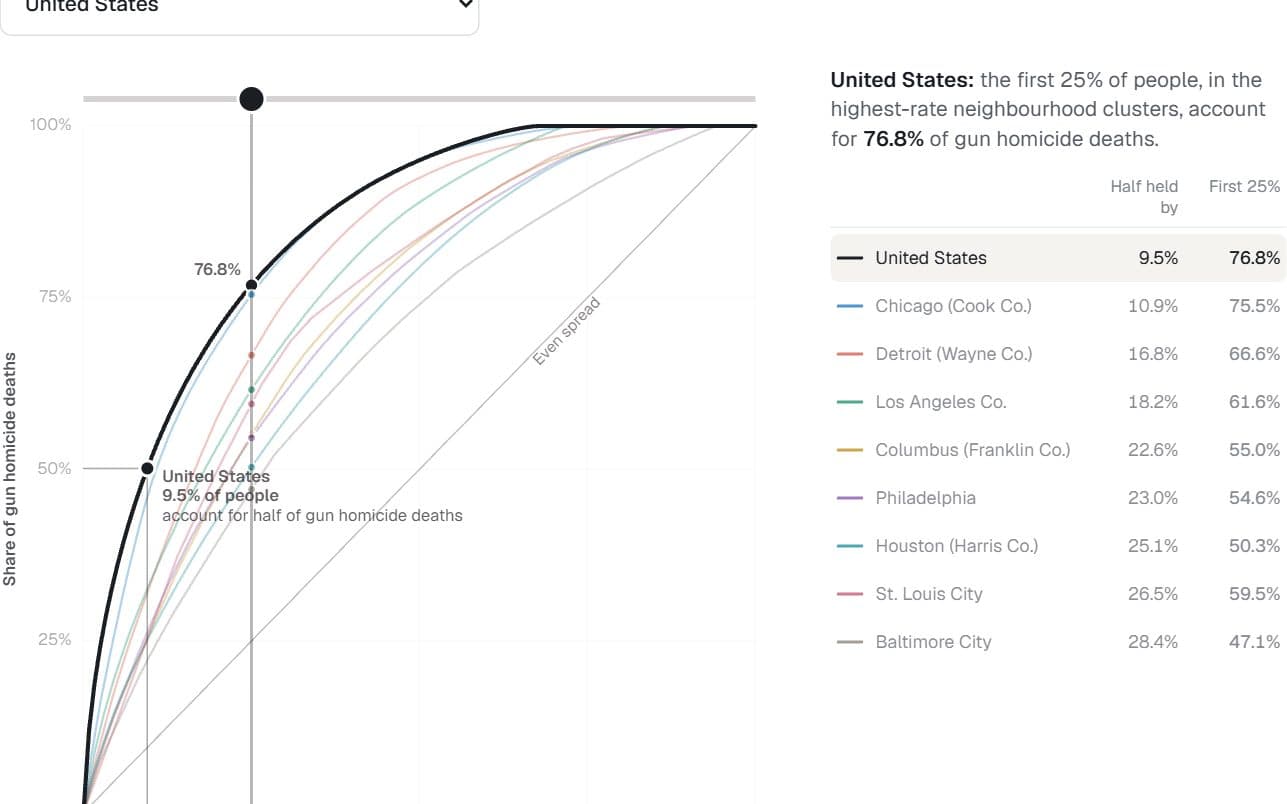
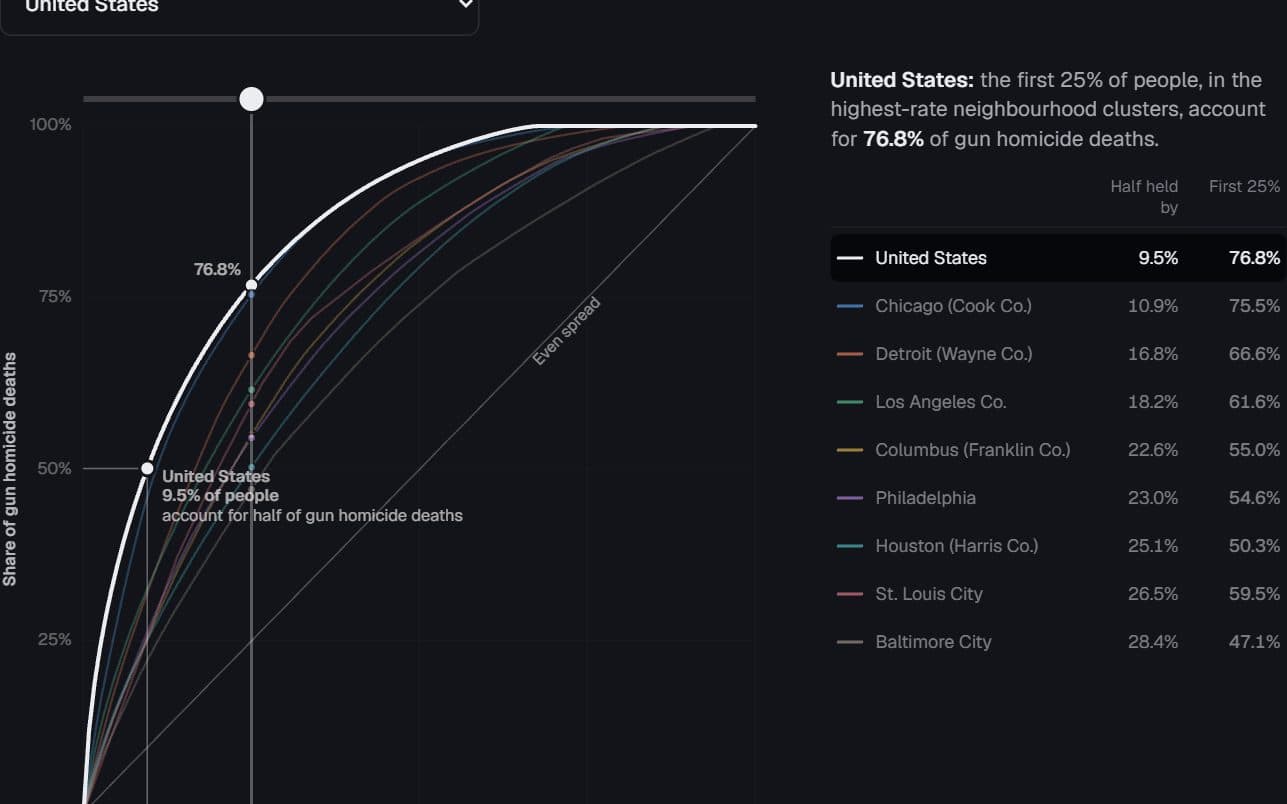
US and eight large jurisdictions · CDC firearm homicide, 2022–2024
Half the deaths, a sliver of the map
What share of people account for half of gun homicide deaths, nationally and within big cities?
Hides: The true concentration, which is higher: the finest unit published is a cluster of about five tracts.
Try it: Drag along the curve
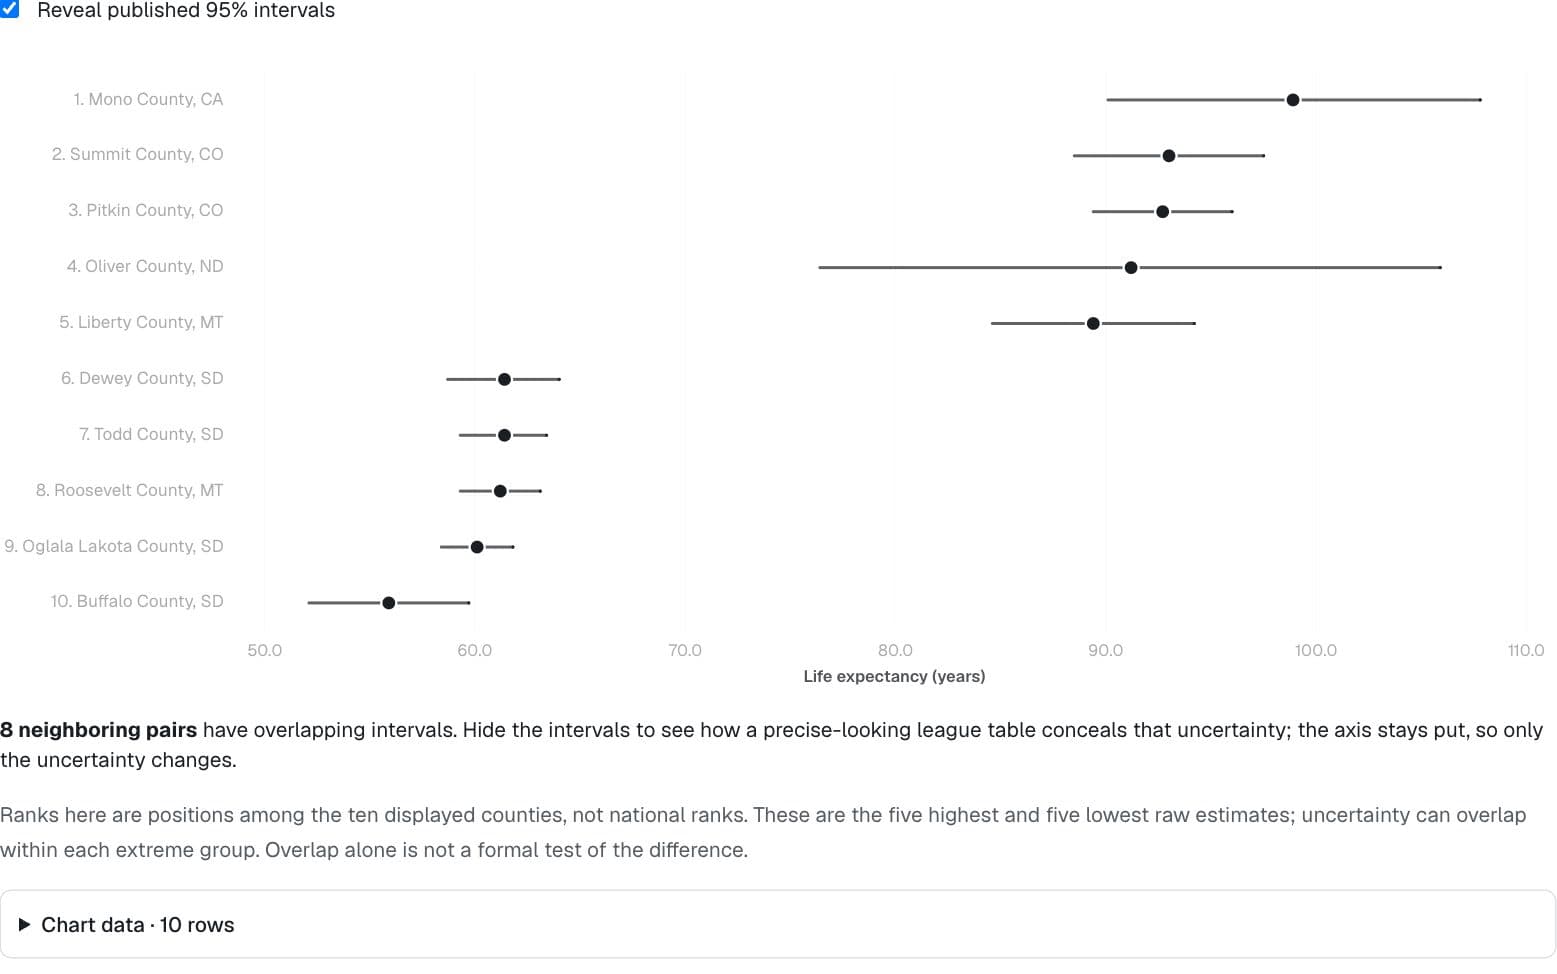
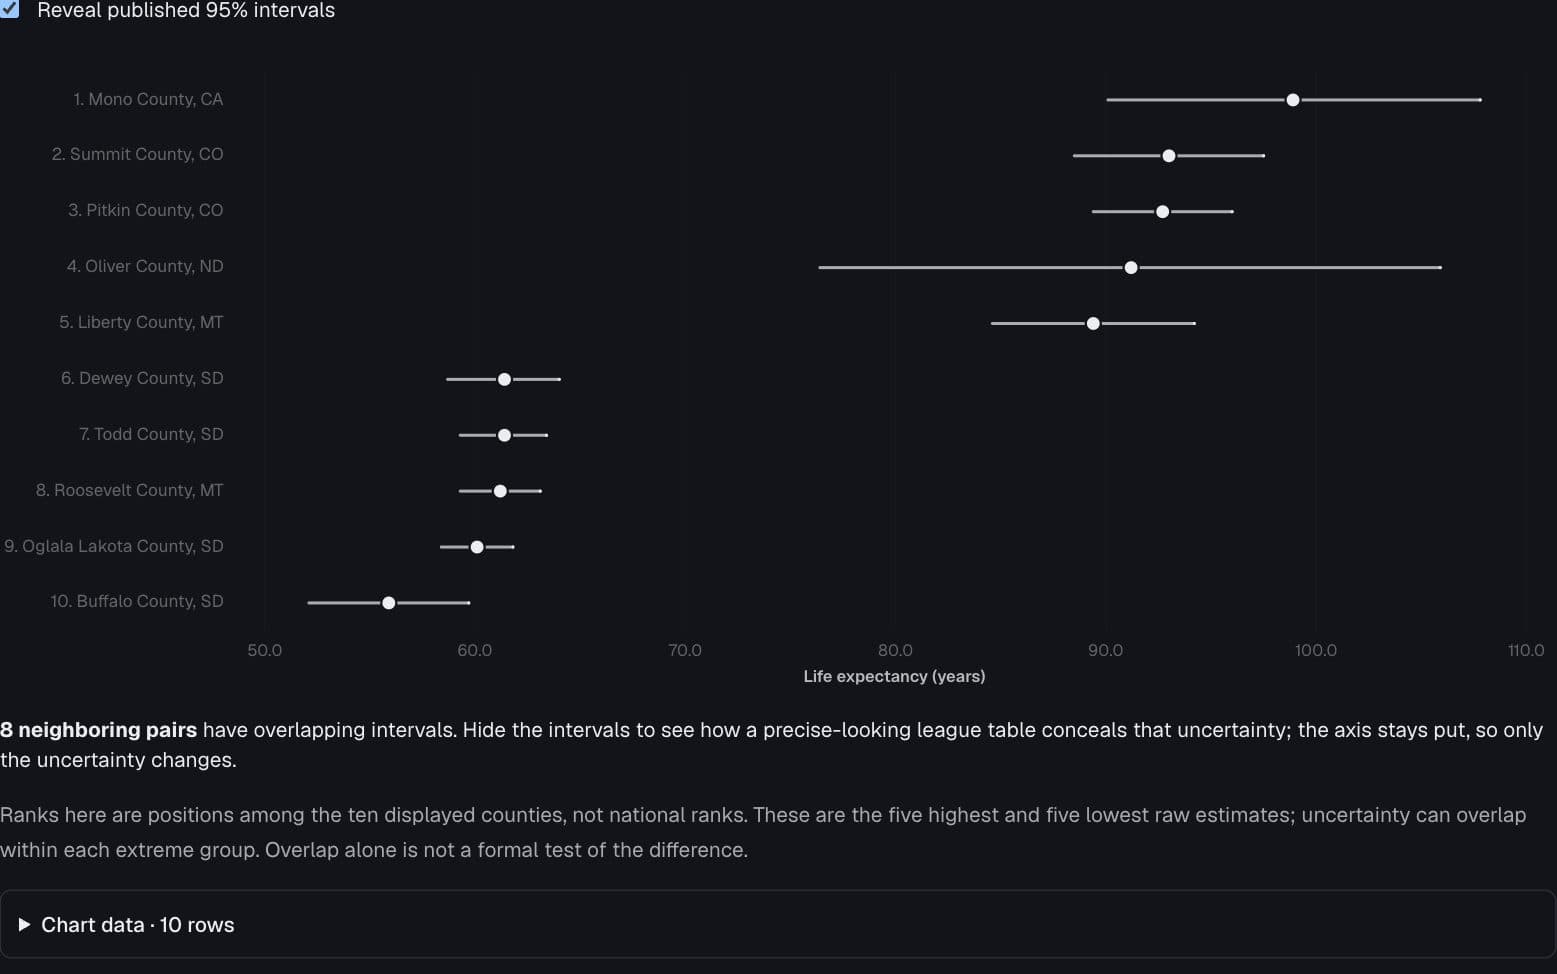
County Health Rankings & Roadmaps 2024, UW Population Health Institute
The league table dissolves
What happens to a confident ranking when its intervals appear?
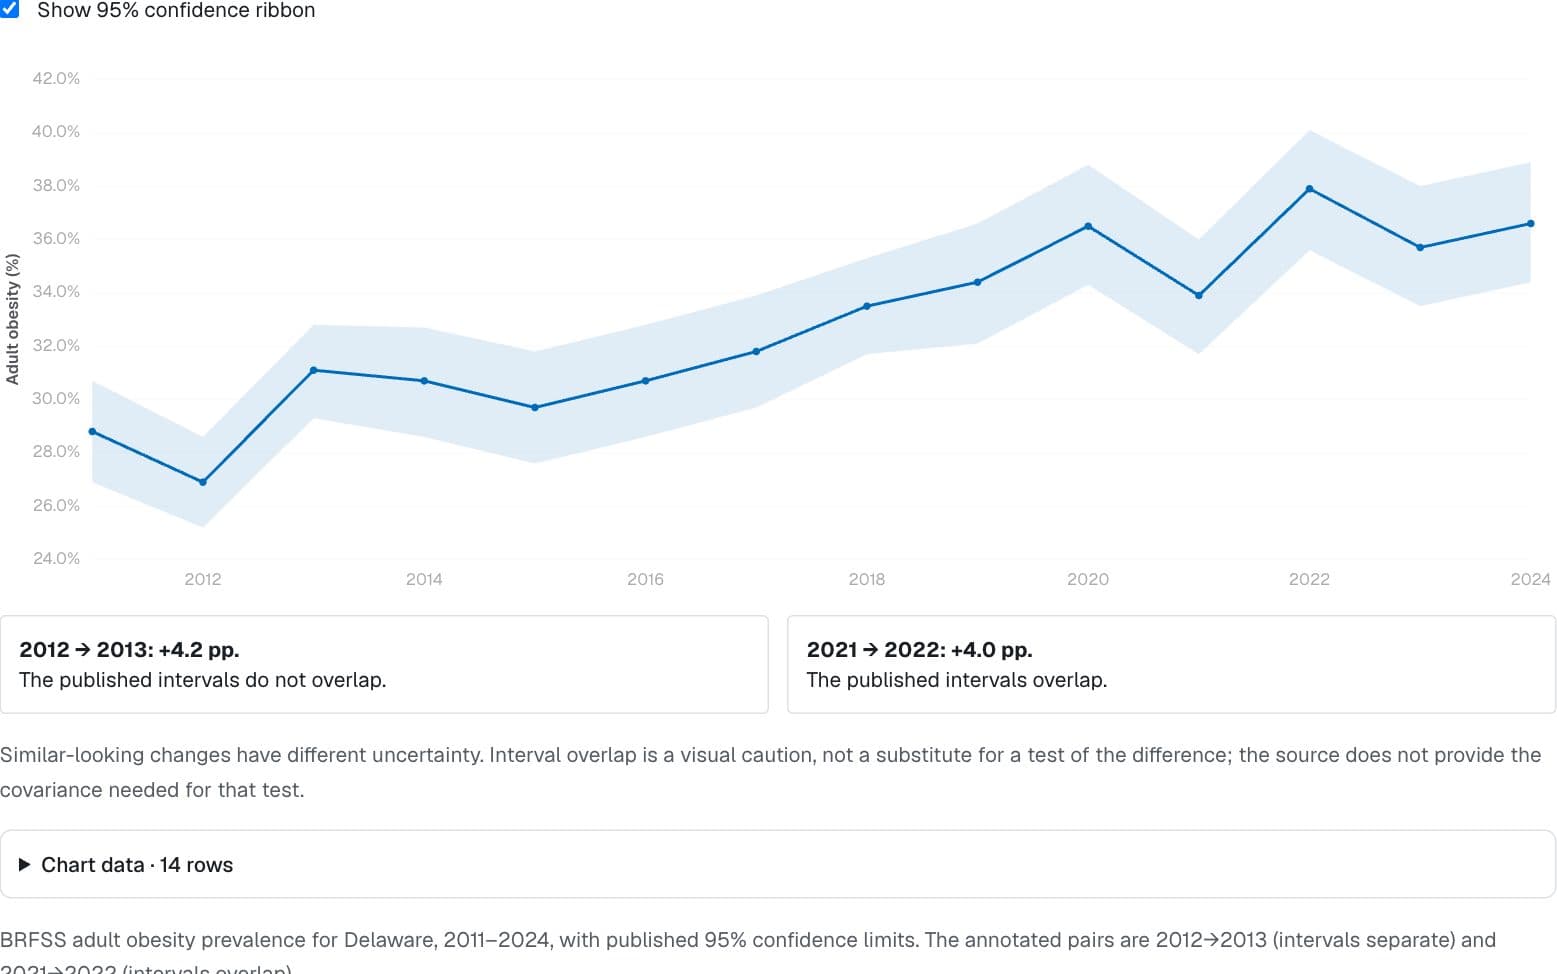
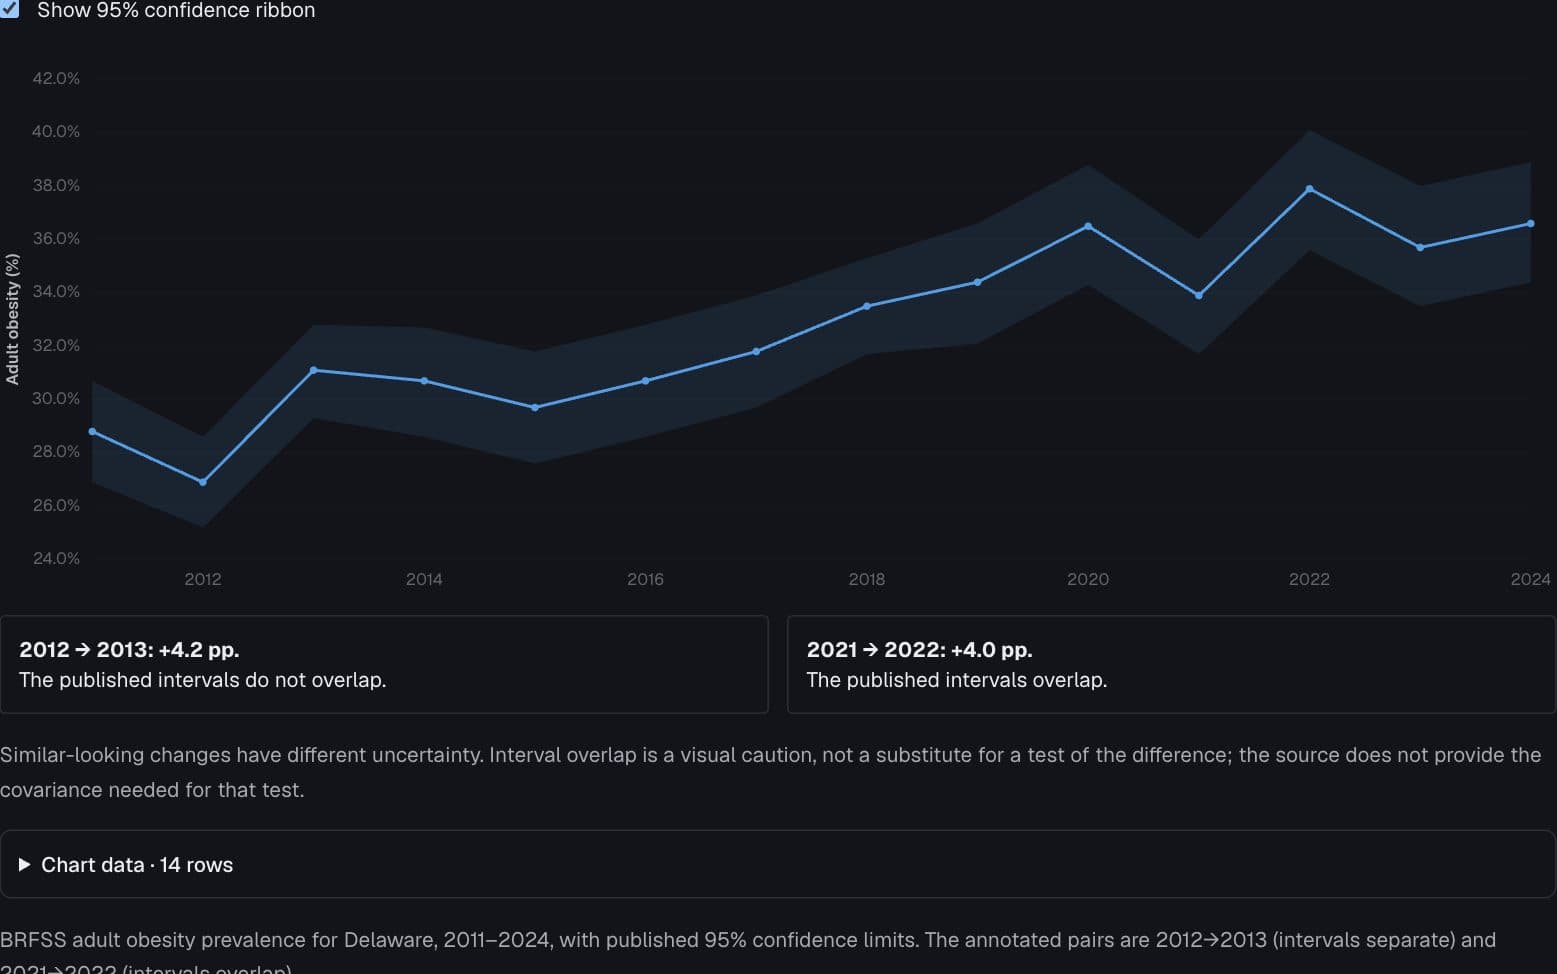
CDC BRFSS Prevalence Data, 2011–present (data.cdc.gov dttw-5yxu)
Similar jumps, different uncertainty
Why can two four-point jumps deserve different readings?
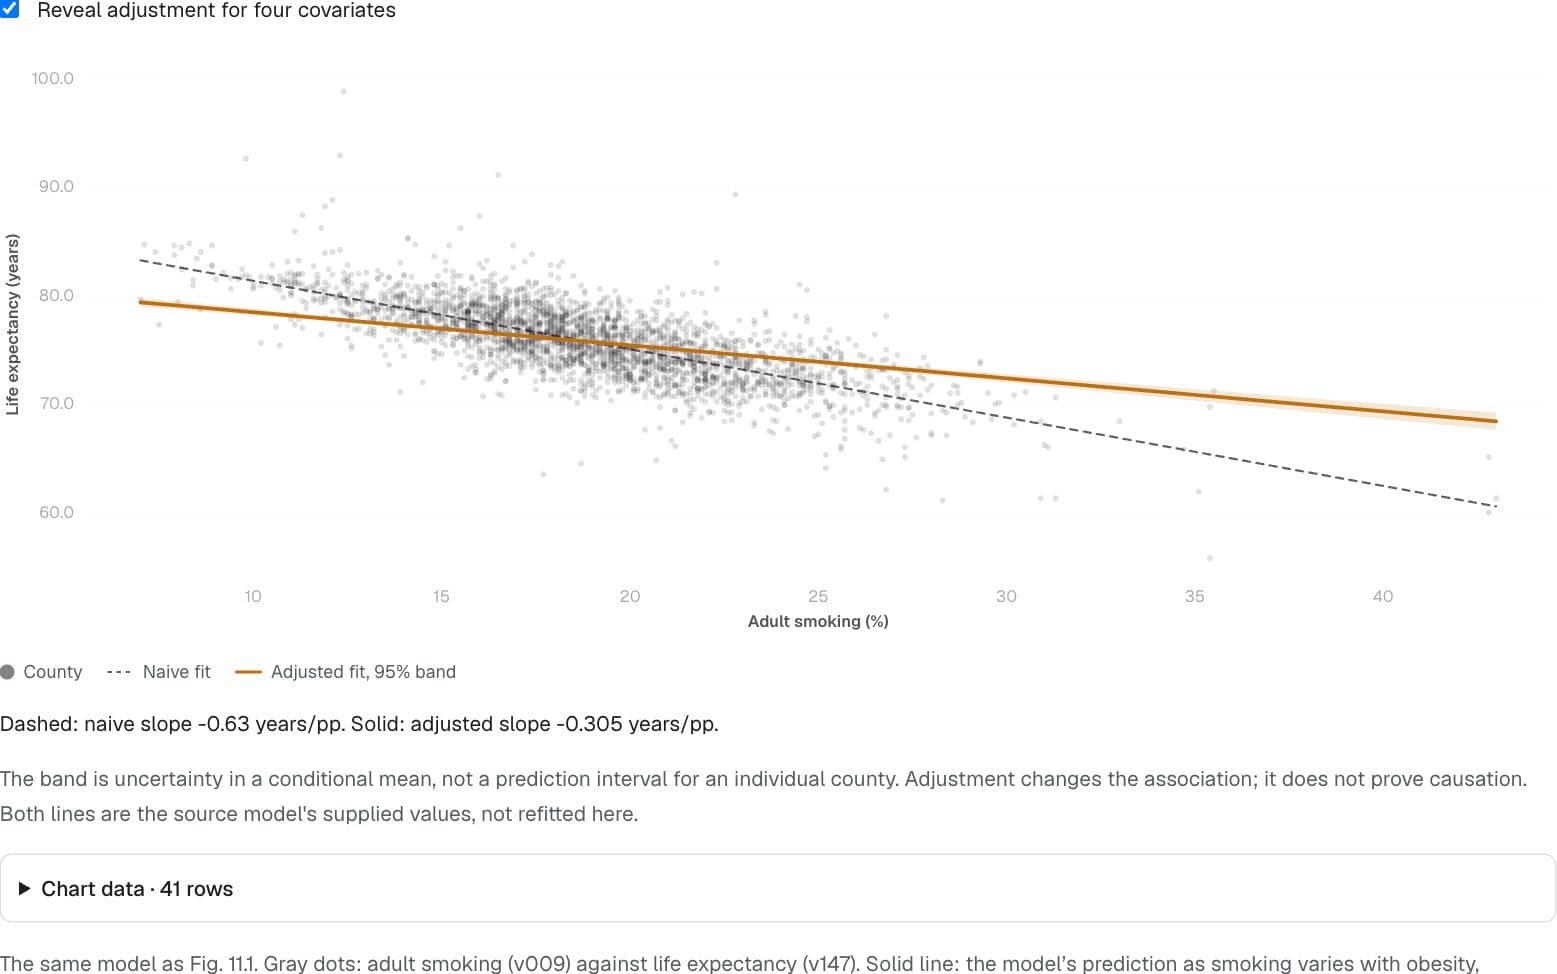
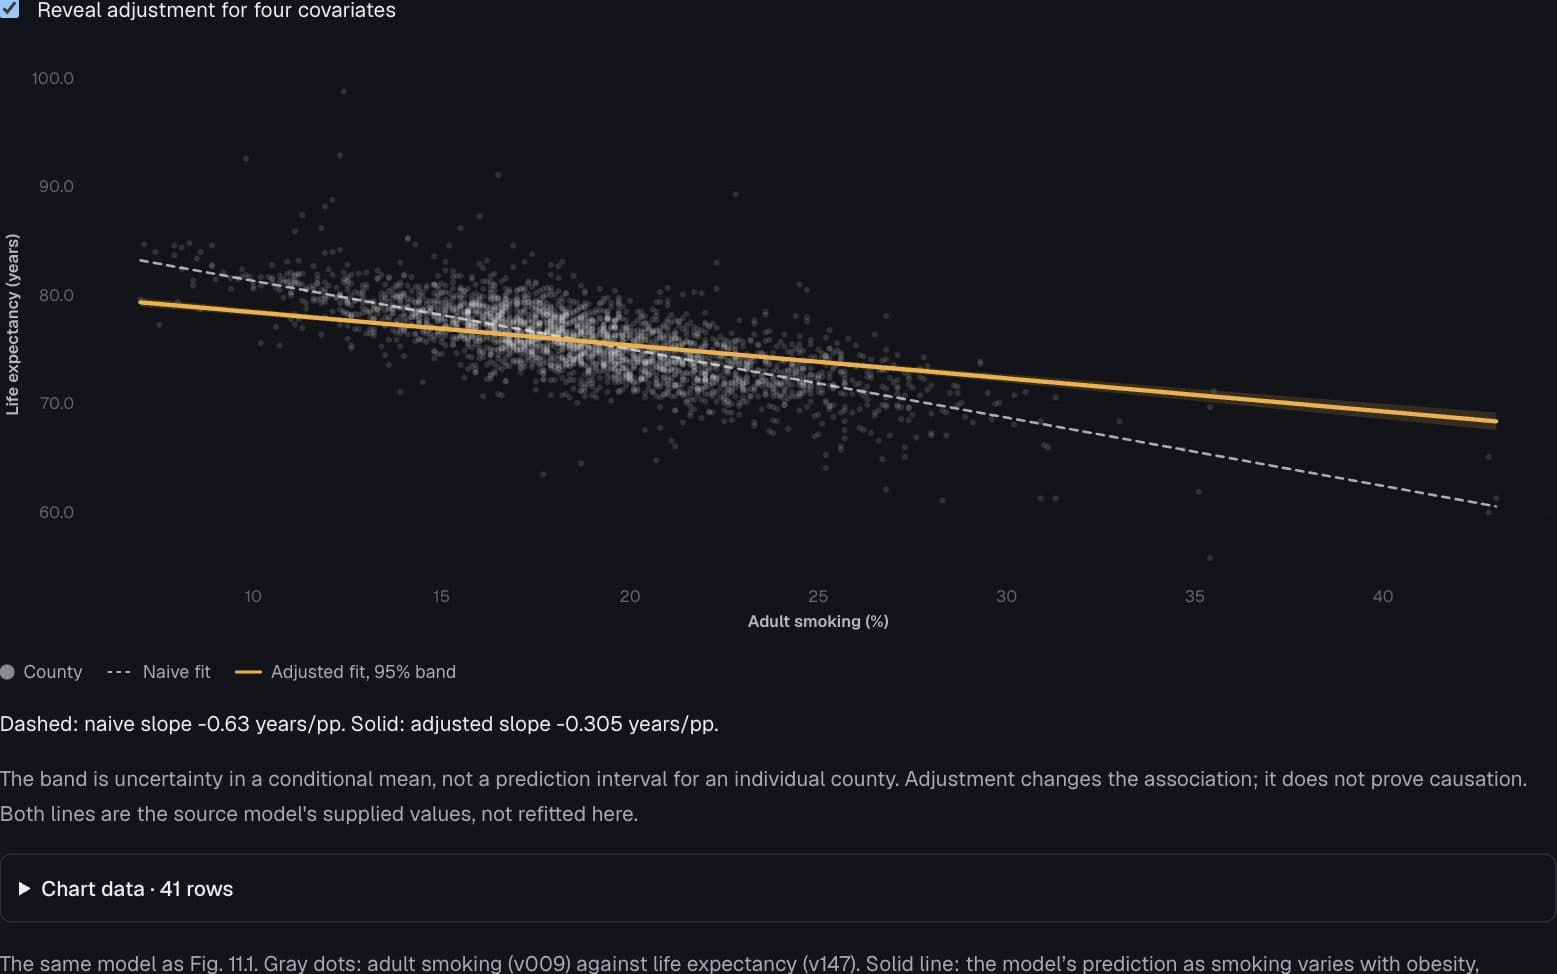
County Health Rankings & Roadmaps 2024, UW Population Health Institute
Adjustment changes the slope
How much of the smoking association remains with four covariates held fixed?
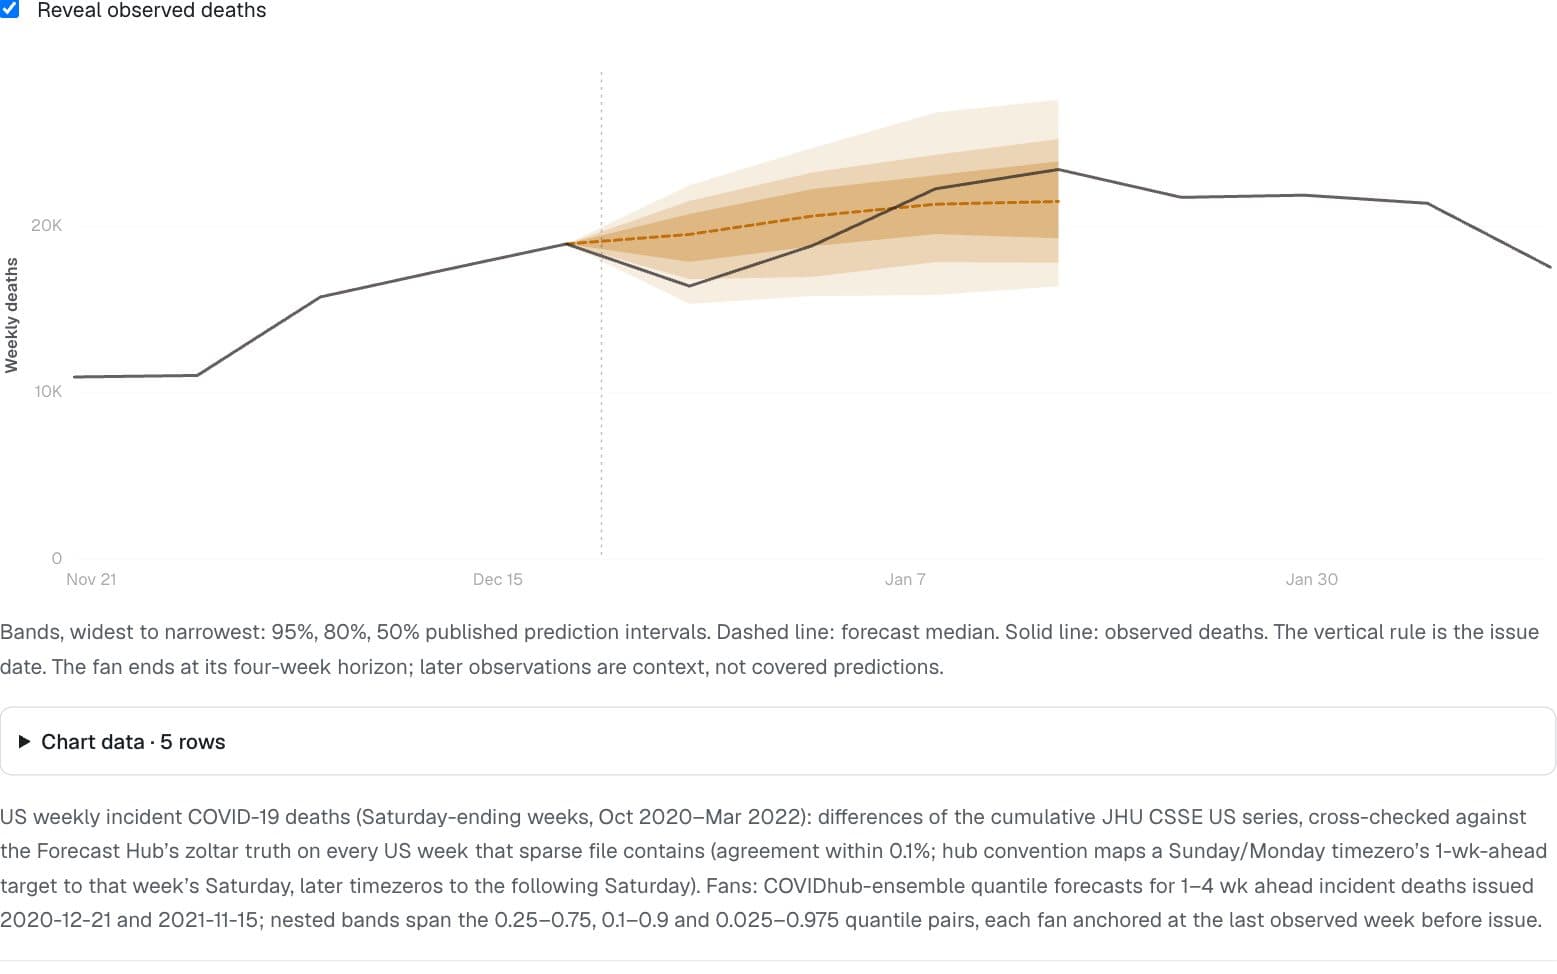
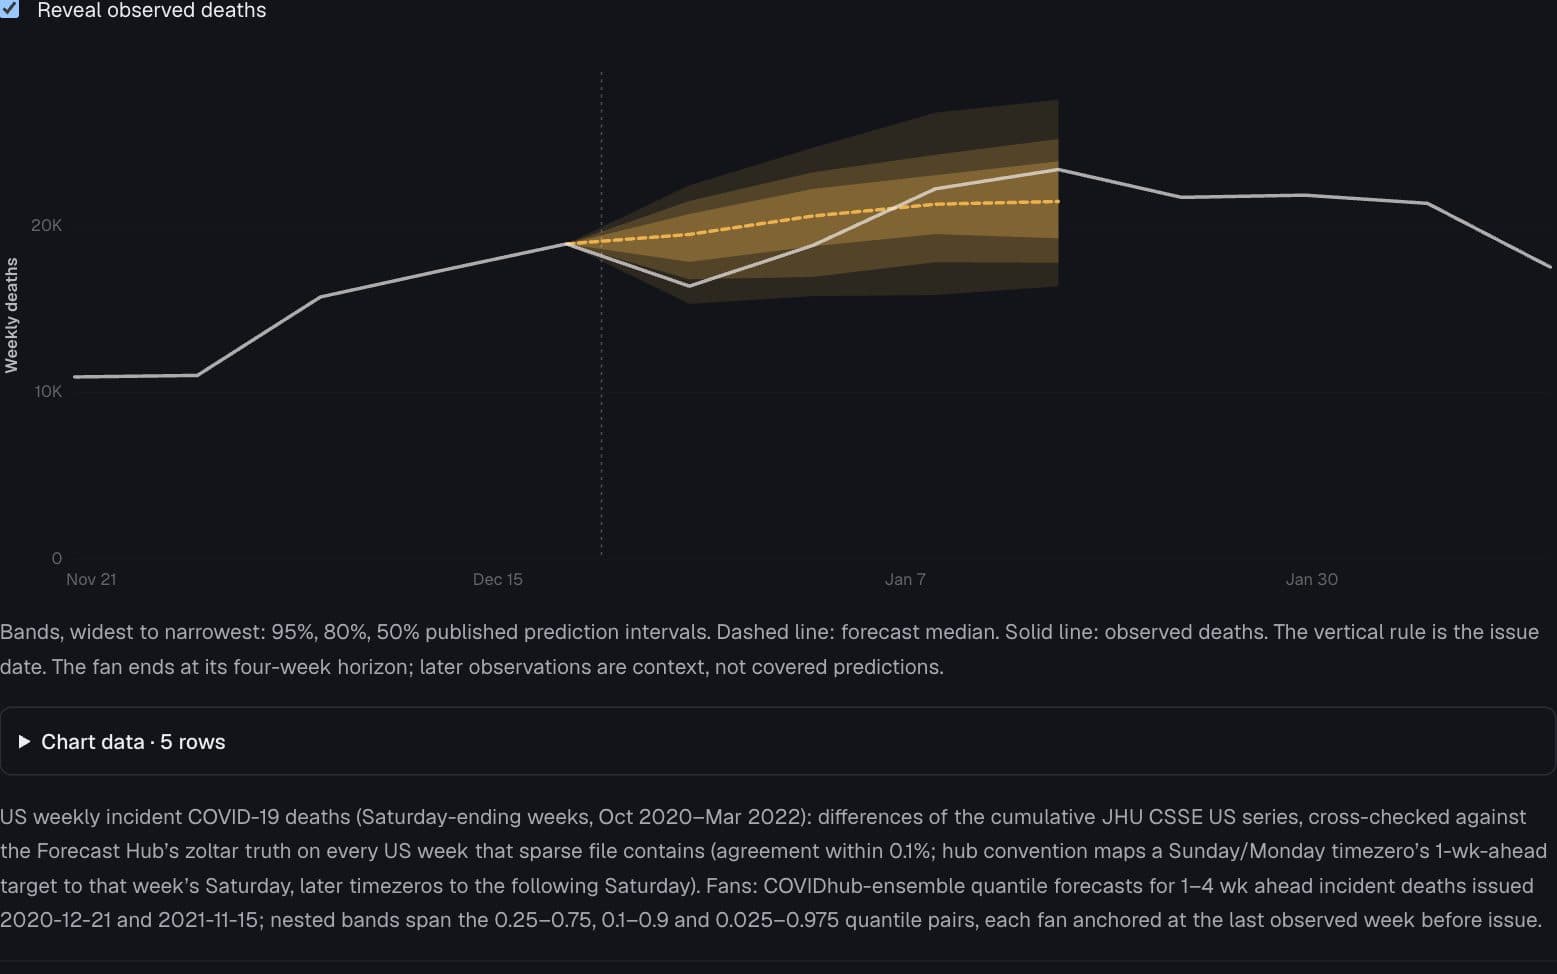
Cramer EY et al. "The United States COVID-19 Forecast Hub dataset." Scientific Data 9, 462 (2022).
A forecast comes with doubt
Where did observed deaths land relative to published forecast intervals?
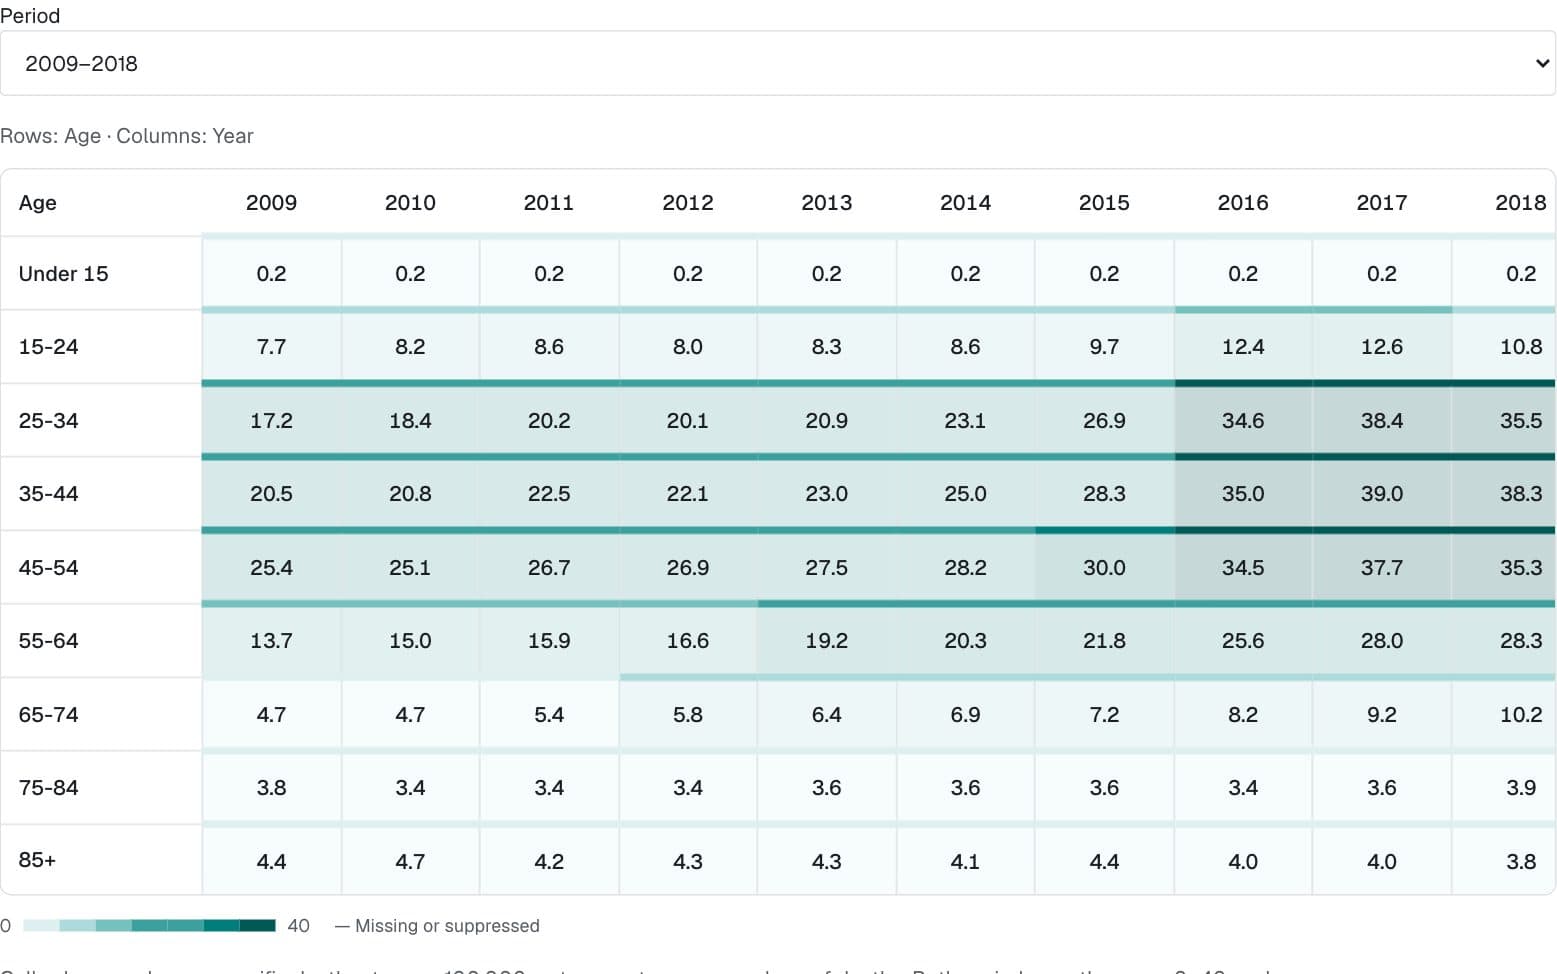
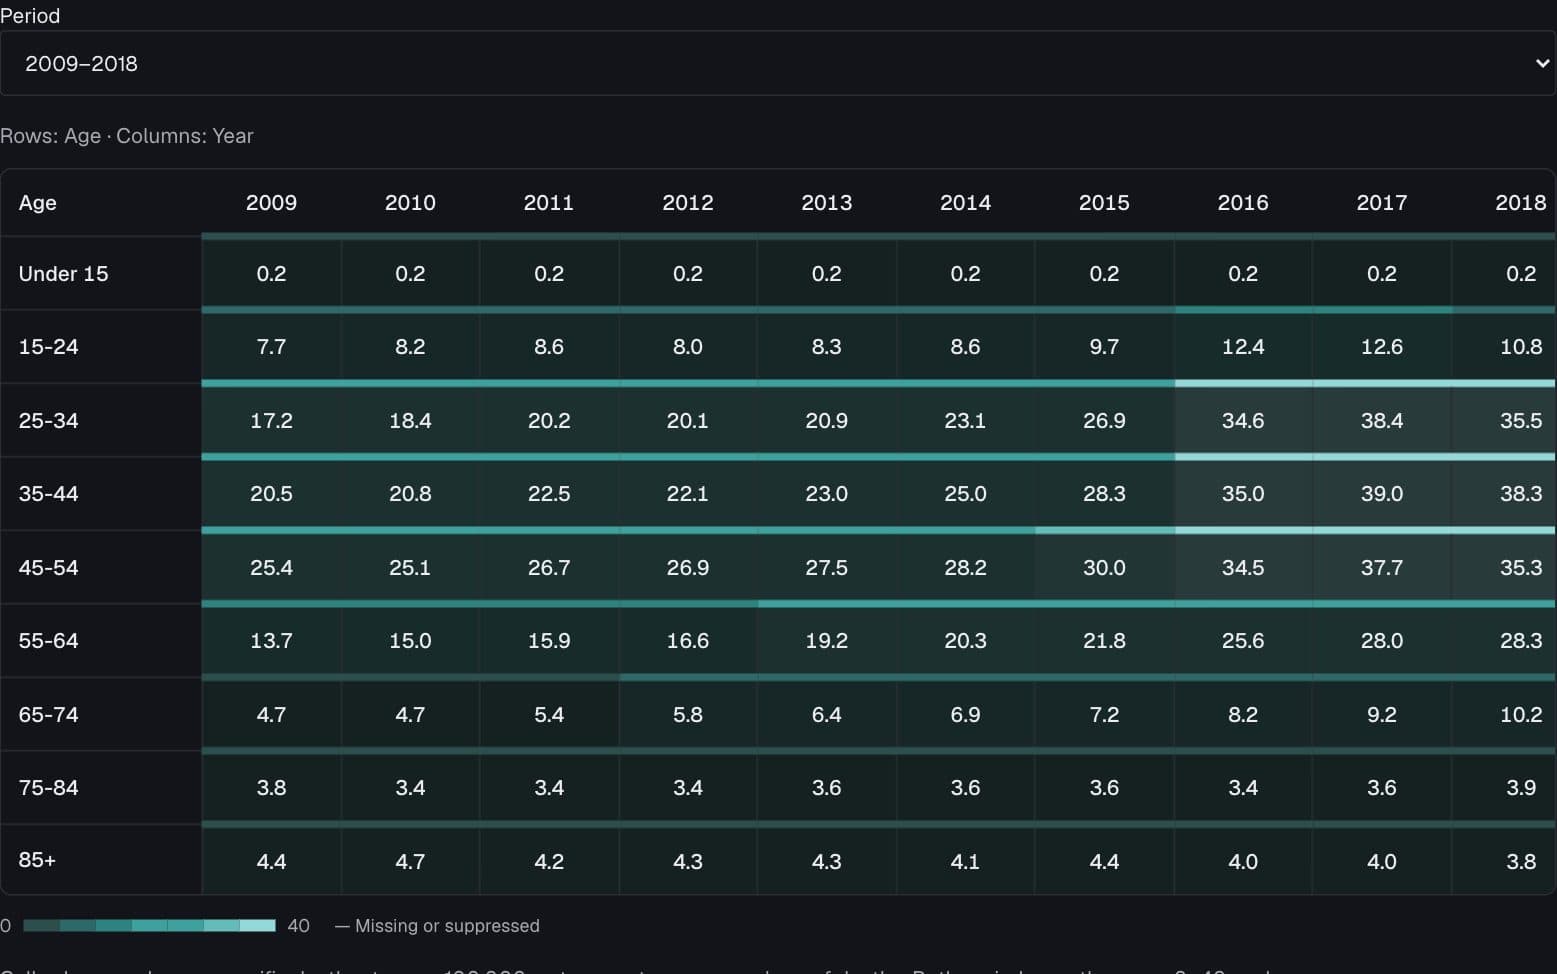
NCHS, "Drug overdose death rates, by drug type, sex, age, race, and Hispanic origin: United States" (data.cdc.gov 95ax-ymtc)
The overdose wave across ages
Which age groups saw the largest changes in overdose mortality?
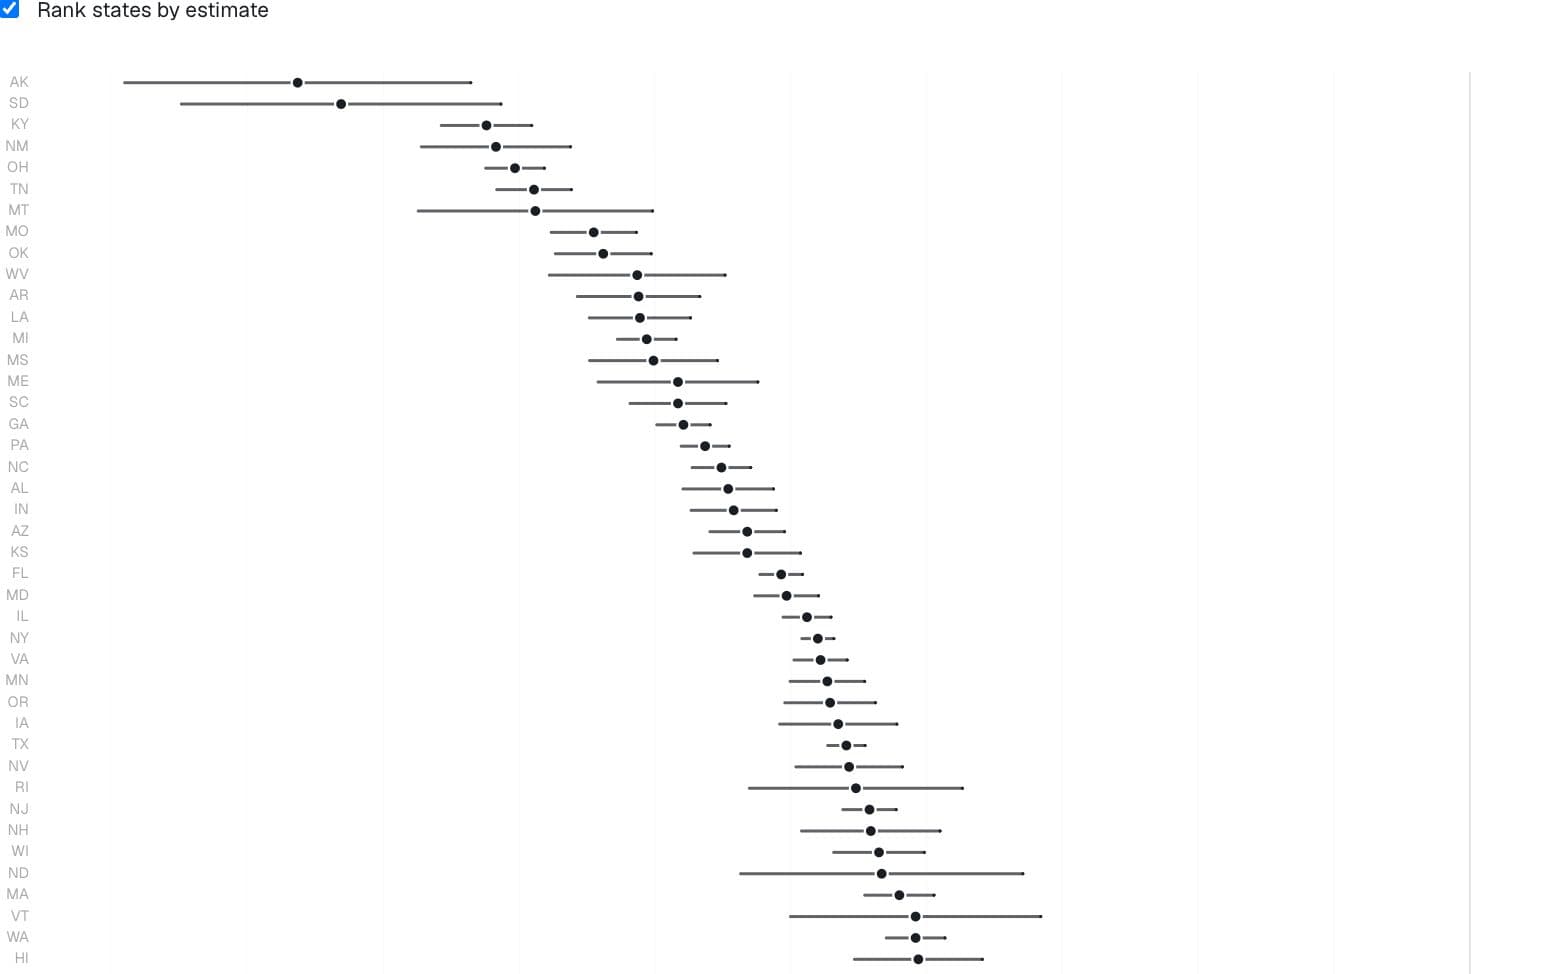
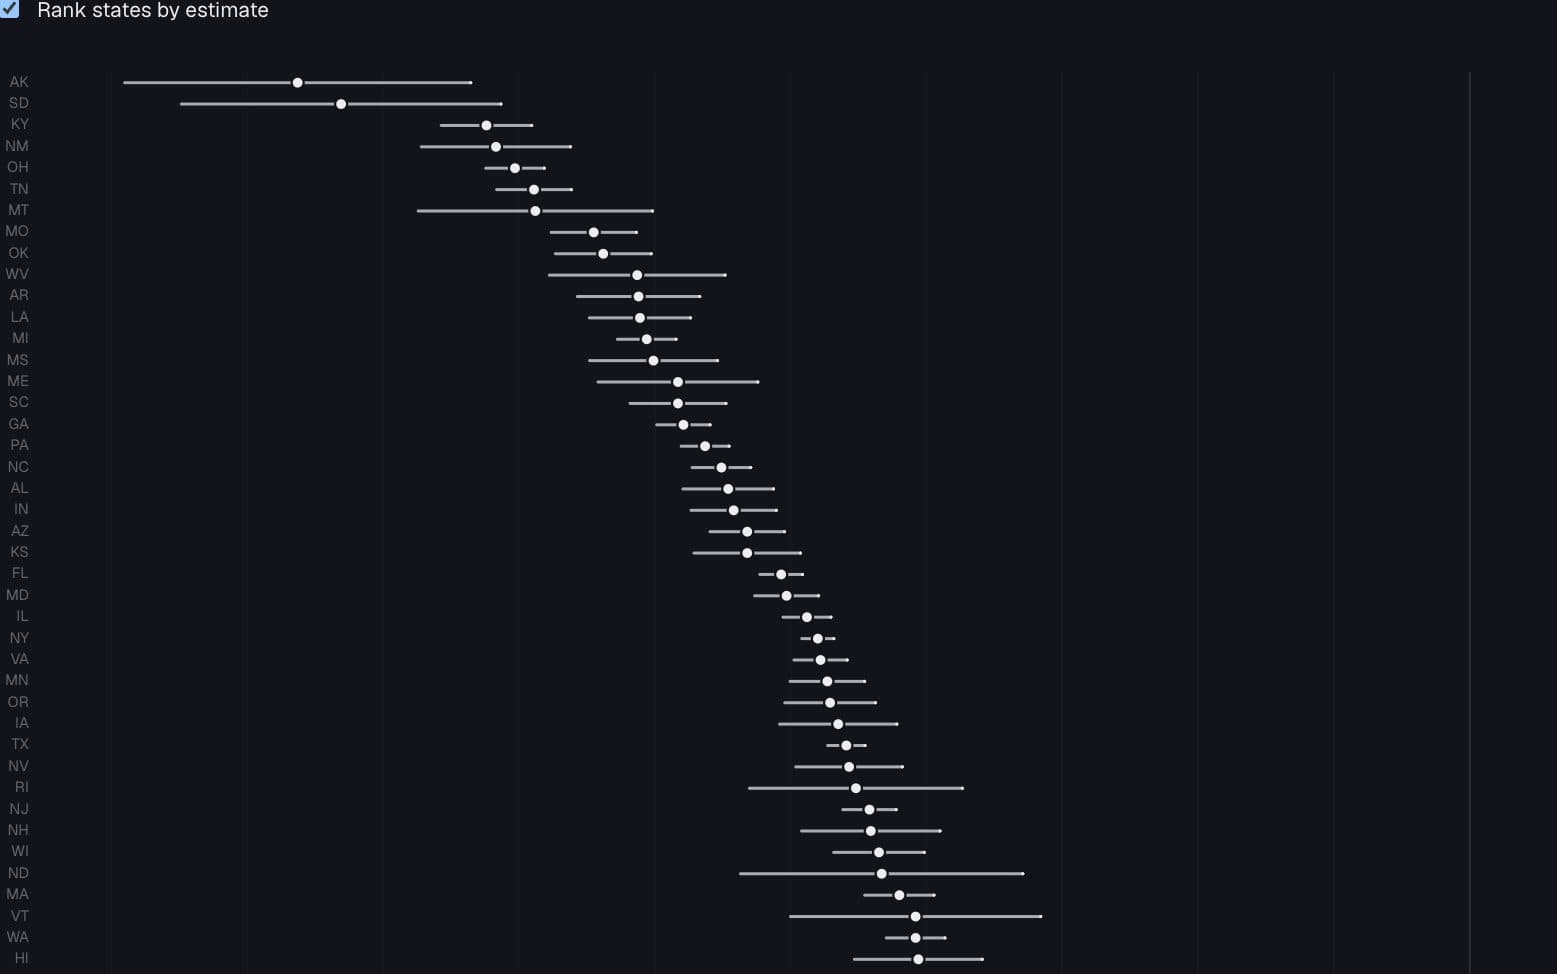
Captured state income-gradient estimates
The rank is not the result
Do state income gradients remain distinct once uncertainty is shown?
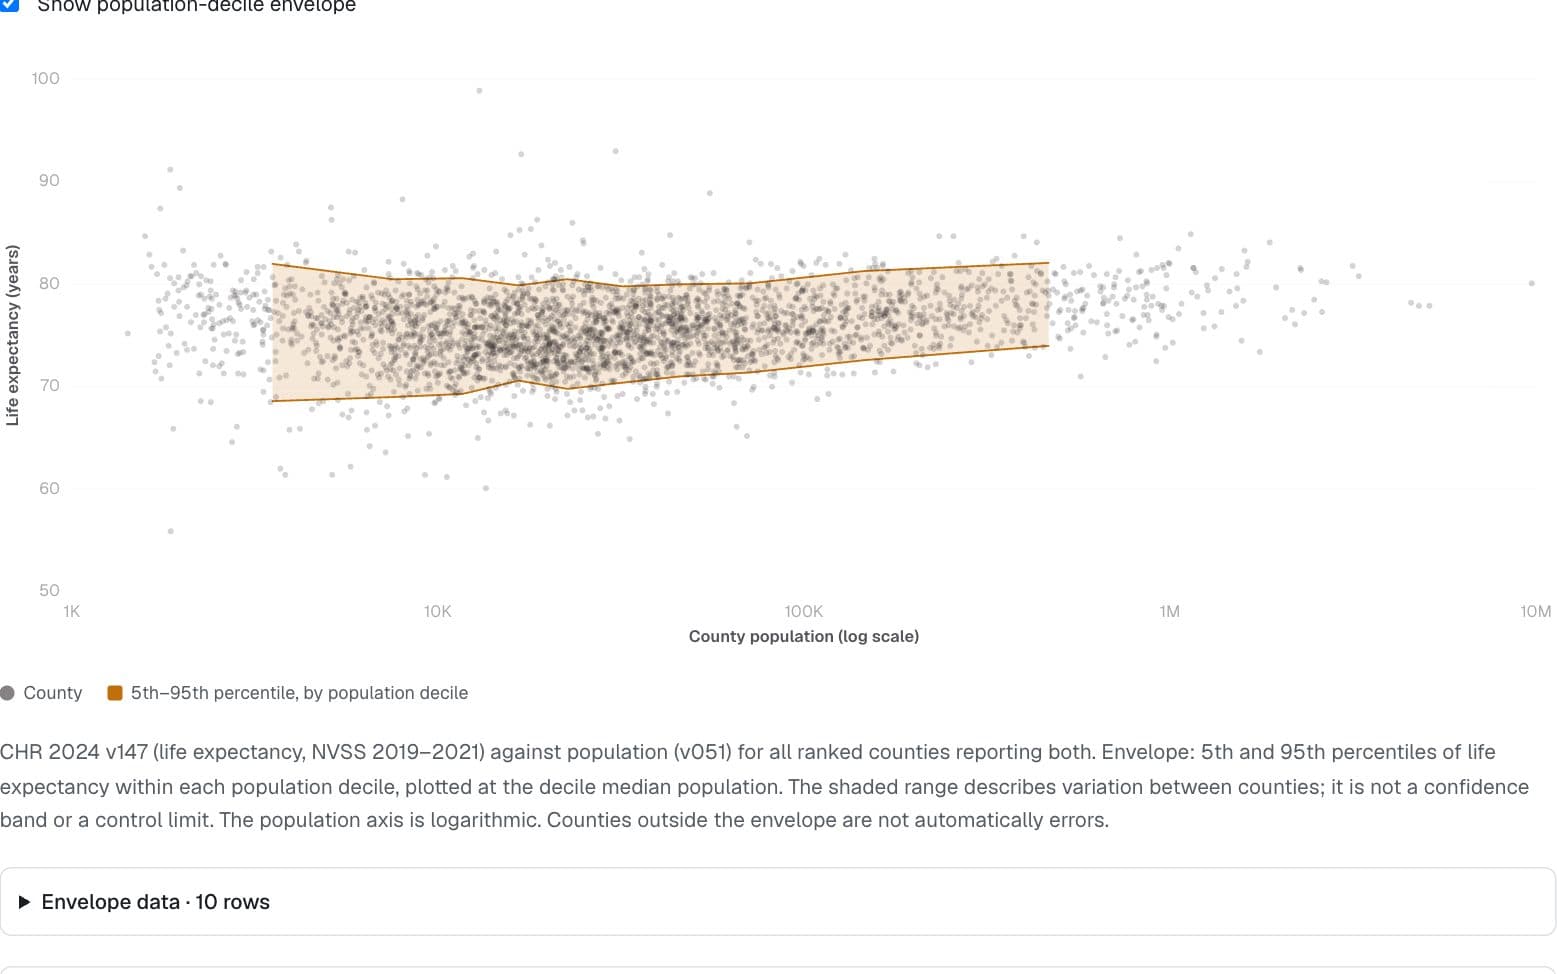
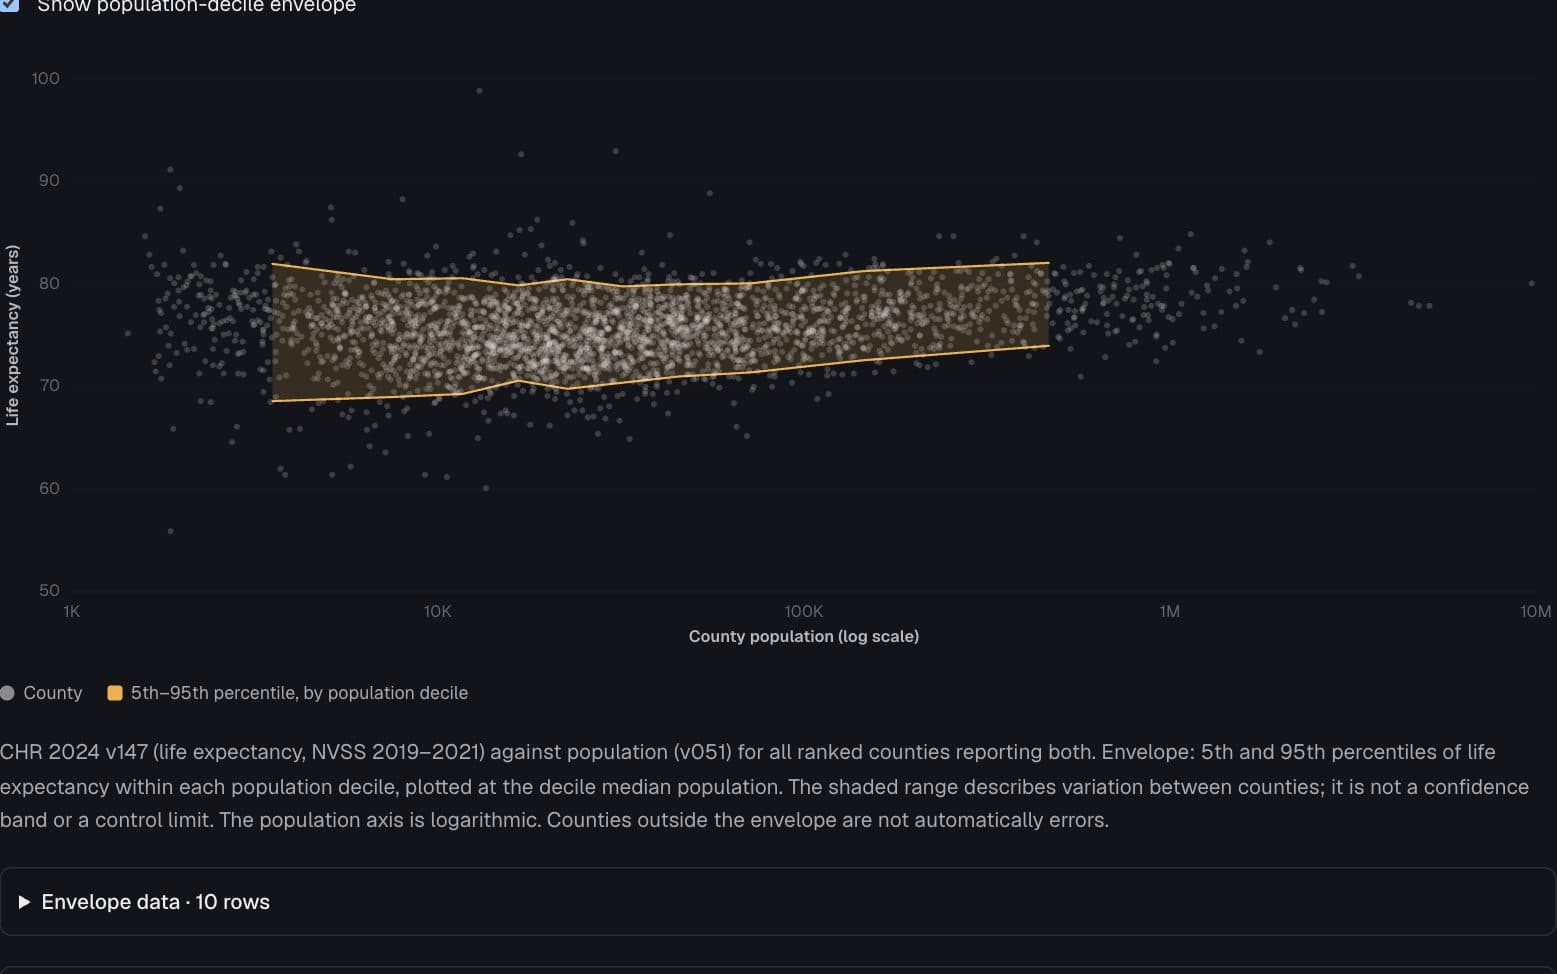
County Health Rankings & Roadmaps 2024
Small counties, wider variation
How does the spread of county life expectancy change with population size?
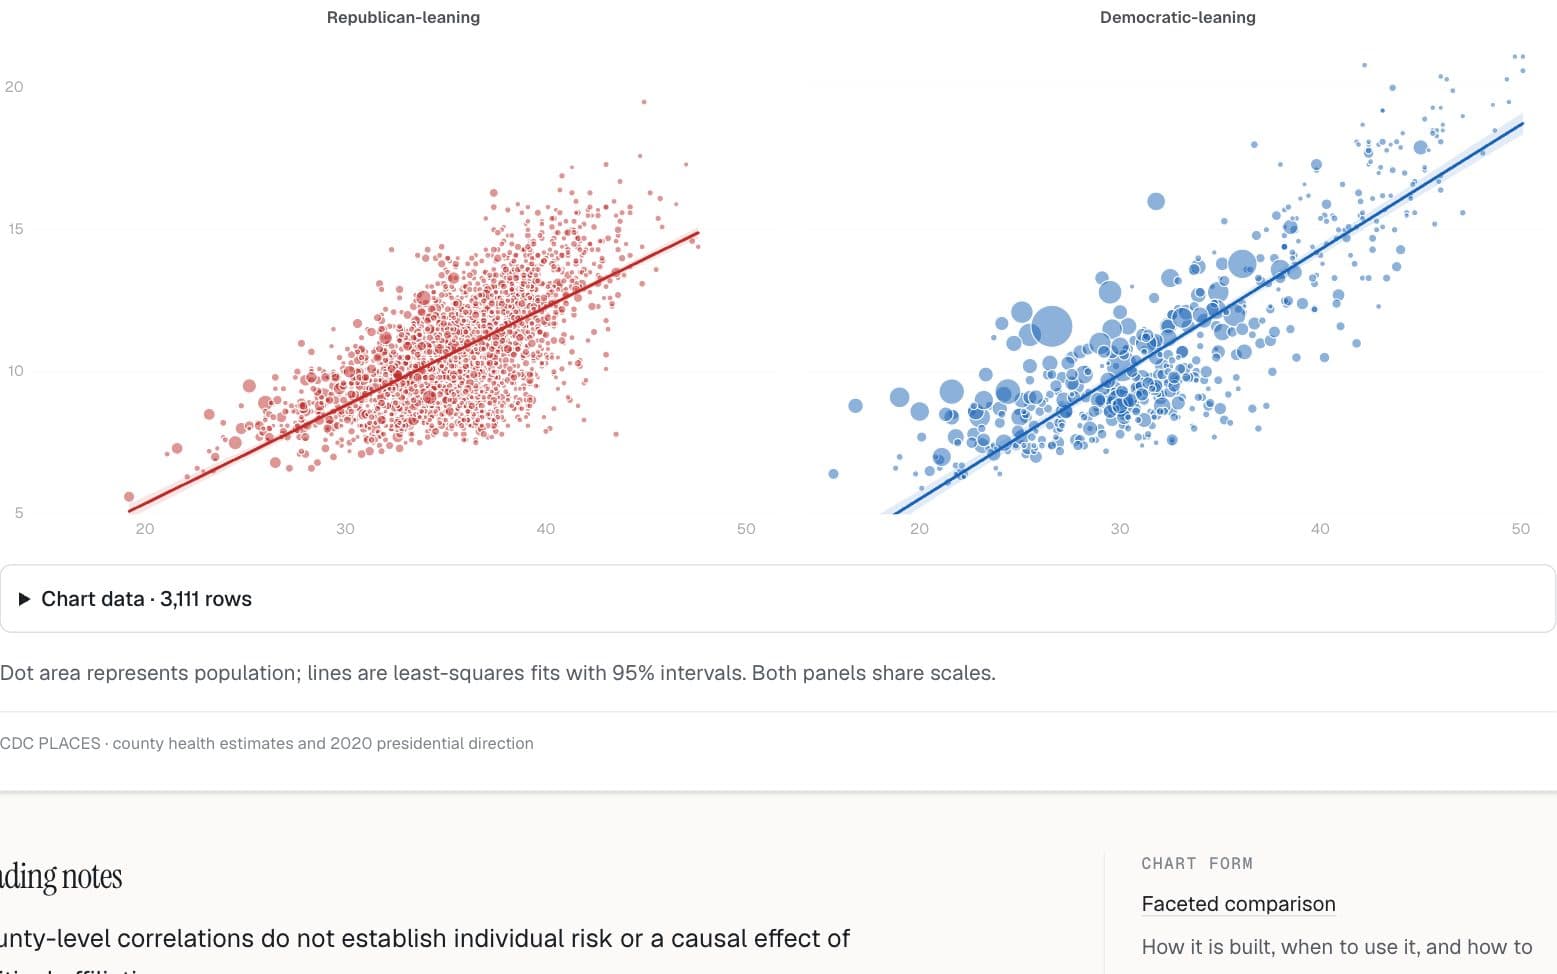
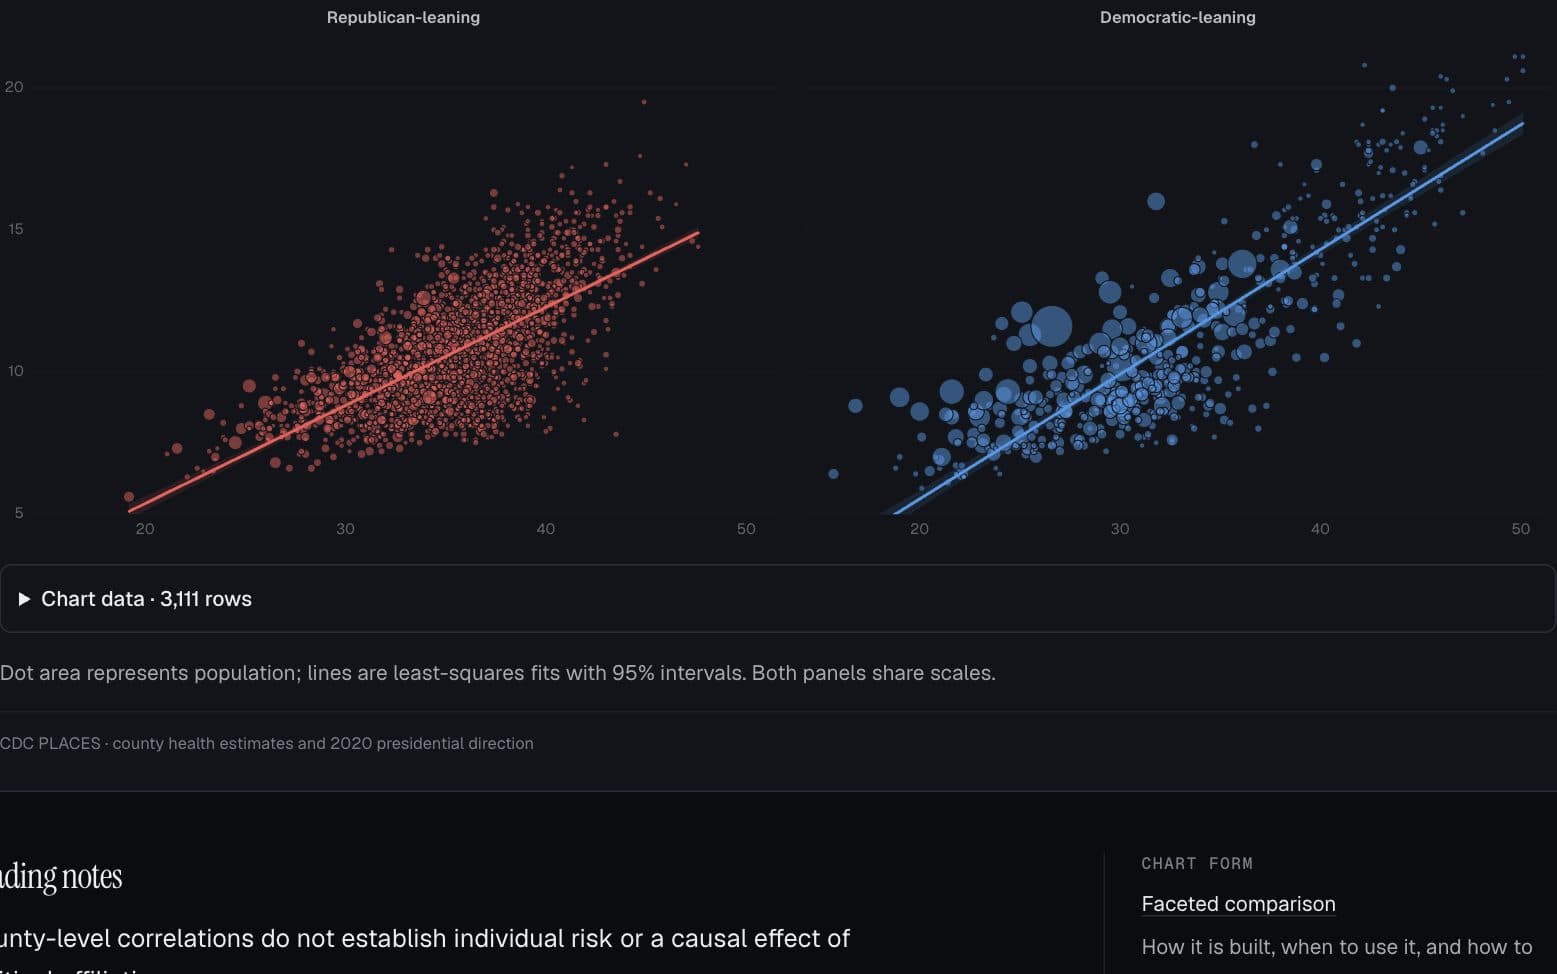
CDC PLACES
Obesity and diabetes, county by county
Does the association look similar in counties with different 2020 vote directions?
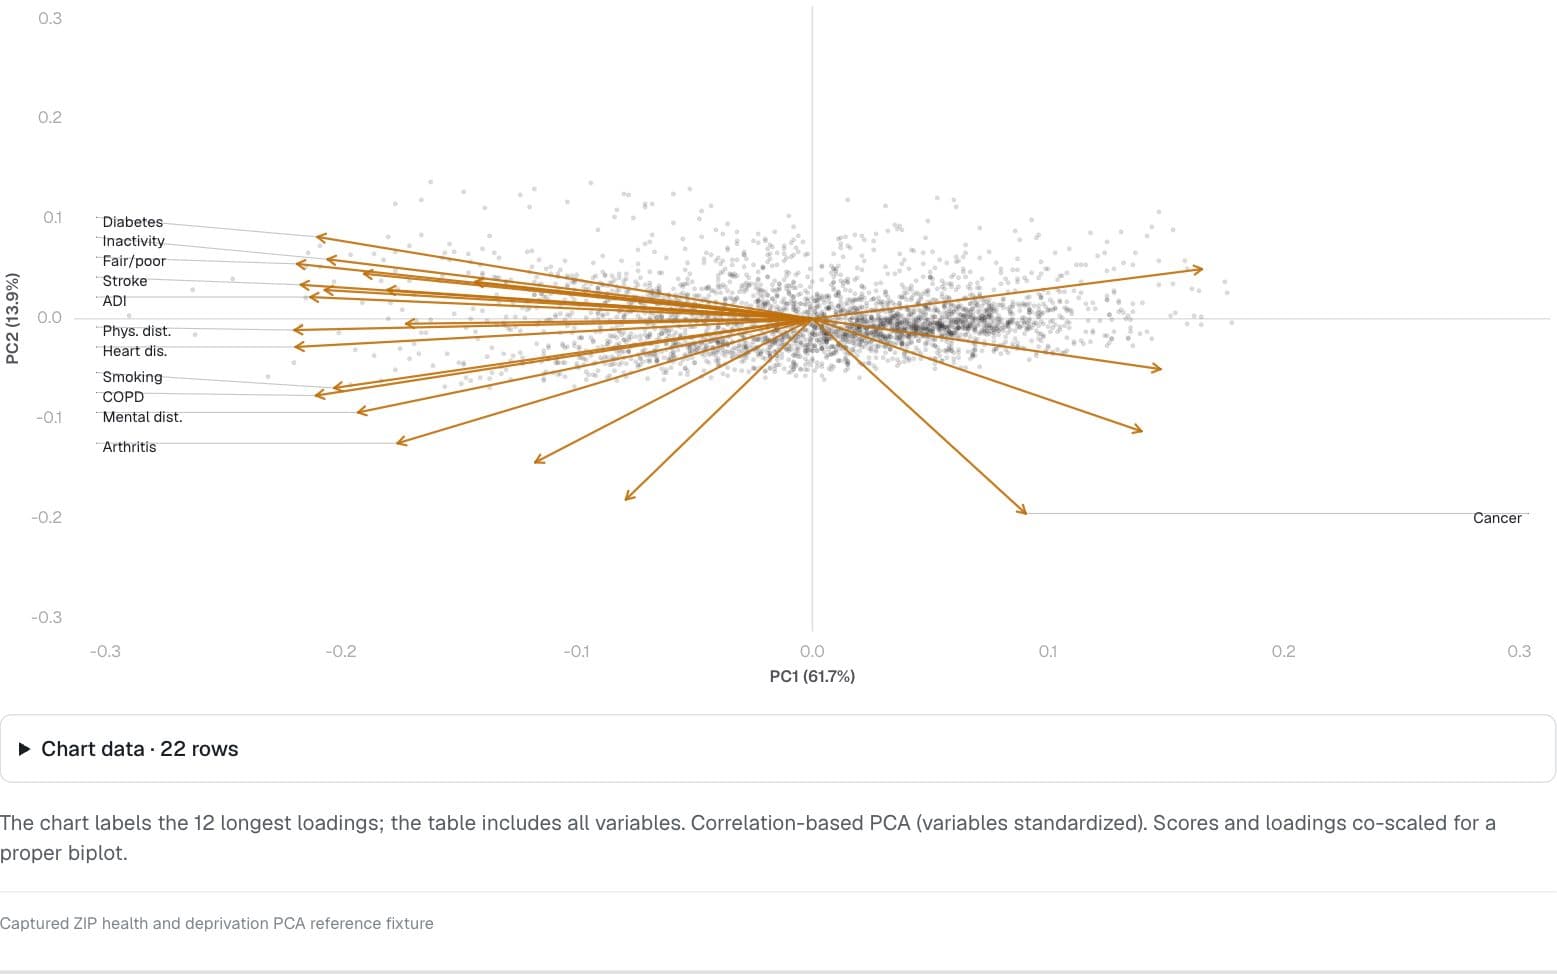
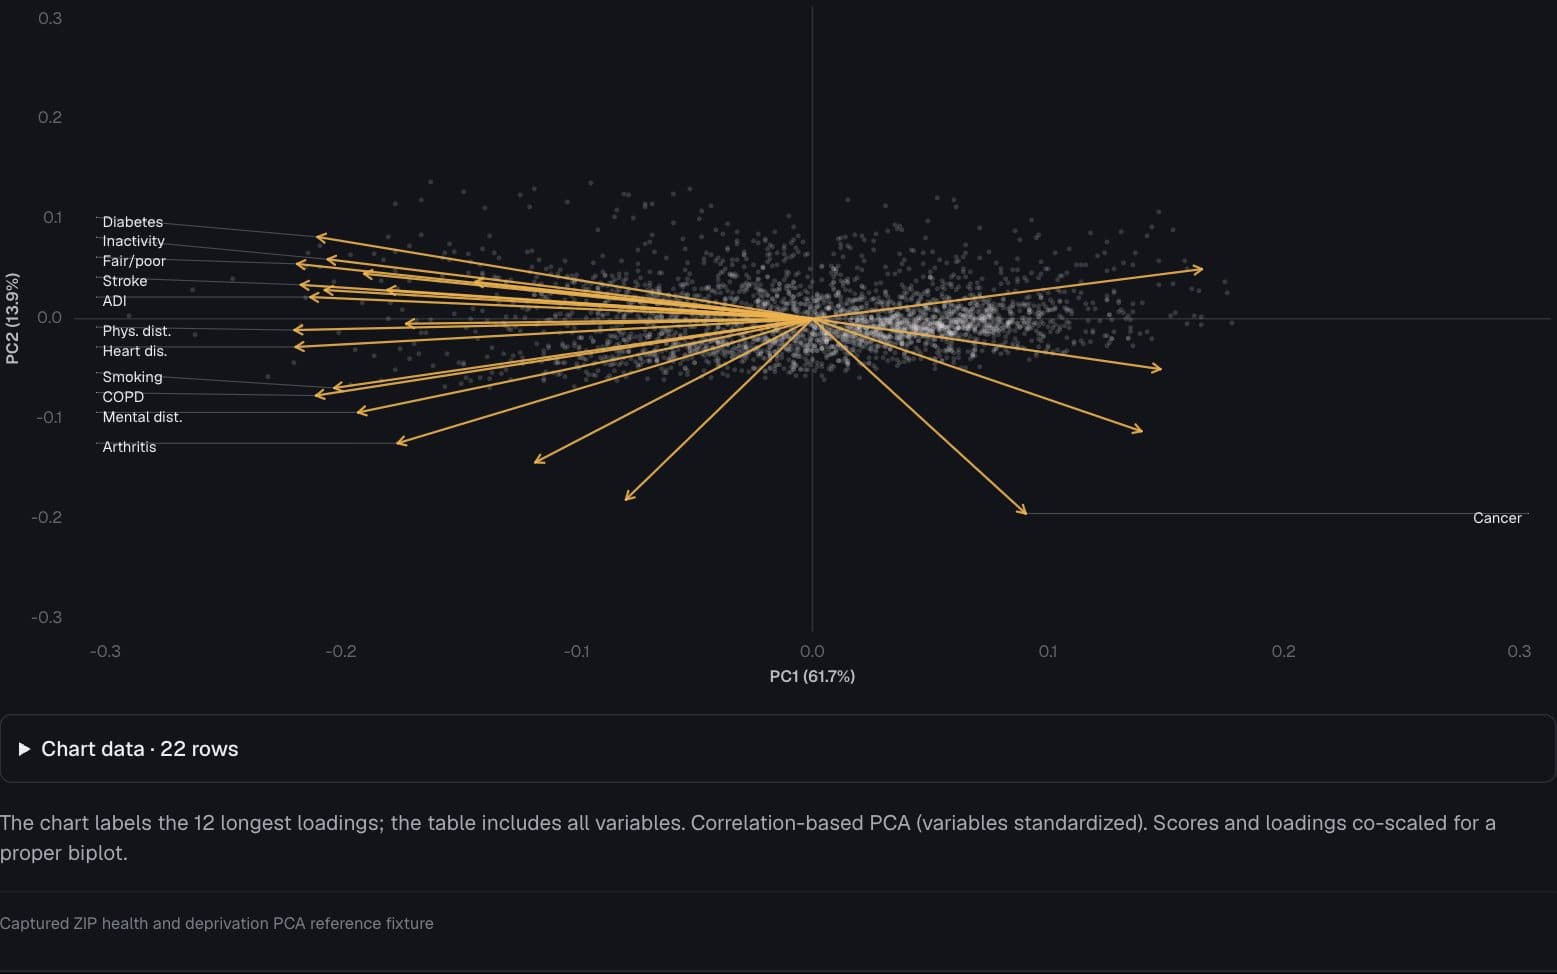
Captured ZIP health and deprivation PCA reference fixture
The dimensions of health and deprivation
Which ZIP-level health and deprivation measures move together?
Longer pages on health
Several figures together, with the components that draw them. These open in the component documentation.