Concentration (Lorenz) curve
Show how much of an outcome the most-concentrated share of a population holds.
CDC · firearm homicide, 2022–2024
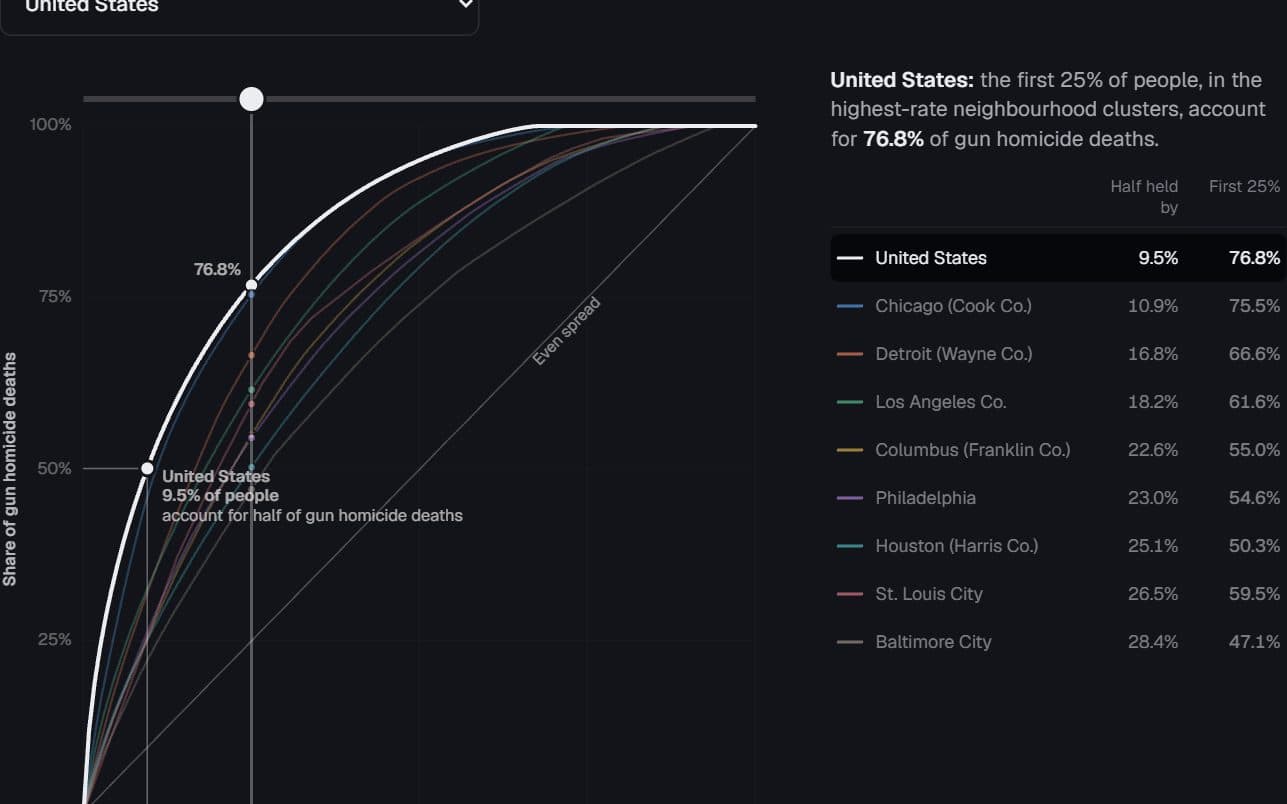
Cumulative share of gun homicide deaths against cumulative share of people, neighbourhood clusters ranked from the highest rate to the lowest — nationally and within eight large jurisdictions. The diagonal is an even spread.
United States: the first 25% of people, in the highest-rate neighbourhood clusters, account for 76.8% of gun homicide deaths.
Half held byFirst 25%
The unit is the CDC’s neighbourhood cluster: firearm mortality is published only for aggregates of about five census tracts, built to reach reportable death counts, so true block-level concentration is higher than shown. Clusters are ranked from the highest firearm homicide rate (model-smoothed, not age-adjusted, 2022–2024 average) to the lowest; deaths are rate × ACS population. City curves are within each county or county-equivalent city, so they depend on where the boundary falls: Baltimore and St. Louis exclude their suburbs and look less concentrated than Cook or Wayne. The half-share counts whole clusters from the top until half of deaths are covered. With St. Louis’s 19 clusters the one that crosses the line carries the total to 62%, which is why its dot sits well above the halfway mark. Values between the plotted vertices, including the reader, are straight-line interpolations.
Half-shares and the reader · 9 rows
| Area | People holding half of deaths (%) | Deaths held by the first 25% of people (%) | Deaths a year | Neighbourhood clusters |
|---|---|---|---|---|
| United States | 9.5 | 76.8 | — | — |
| Chicago (Cook Co.) | 10.9 | 75.5 | 625 | 312 |
| Detroit (Wayne Co.) | 16.8 | 66.6 | 216 | 105 |
| Los Angeles Co. | 18.2 | 61.6 | 276 | 600 |
| Columbus (Franklin Co.) | 22.6 | 55 | 95 | 77 |
| Philadelphia | 23 | 54.6 | 289 | 91 |
| Houston (Harris Co.) | 25.1 | 50.3 | 343 | 284 |
| St. Louis City | 26.5 | 59.5 | 104 | 19 |
| Baltimore City | 28.4 | 47.1 | 154 | 37 |
Page 1 of 1
Curve vertices · 683 rows
| Area | People, cumulative (%) | Gun homicide deaths, cumulative (%) |
|---|---|---|
| United States | 0 | 0 |
| United States | 0.83 | 11.97 |
| United States | 1.65 | 18.9 |
| United States | 2.48 | 24.12 |
| United States | 3.34 | 28.66 |
| United States | 4.18 | 32.5 |
| United States | 5.01 | 35.9 |
| United States | 5.88 | 39.15 |
| United States | 6.75 | 42.12 |
| United States | 7.61 | 44.85 |
| United States | 8.47 | 47.35 |
| United States | 9.34 | 49.72 |
| United States | 10.22 | 51.97 |
| United States | 11.12 | 54.15 |
| United States | 11.98 | 56.1 |
| United States | 12.82 | 57.92 |
| United States | 13.65 | 59.63 |
| United States | 14.5 | 61.29 |
| United States | 15.33 | 62.83 |
| United States | 16.21 | 64.39 |
Page 1 of 35
CDC tract-level firearm mortality (multi-tract aggregates), 2022–2024 average · ACS population
Preview
How to read it
Units are ranked from most to least concentrated and cumulated, so every curve runs from the origin to 100%, 100%. The further a curve bows above the diagonal, the more concentrated the outcome. The dot marks the supplied share of the population holding half; the reader reports every curve at one population share.
When to use it
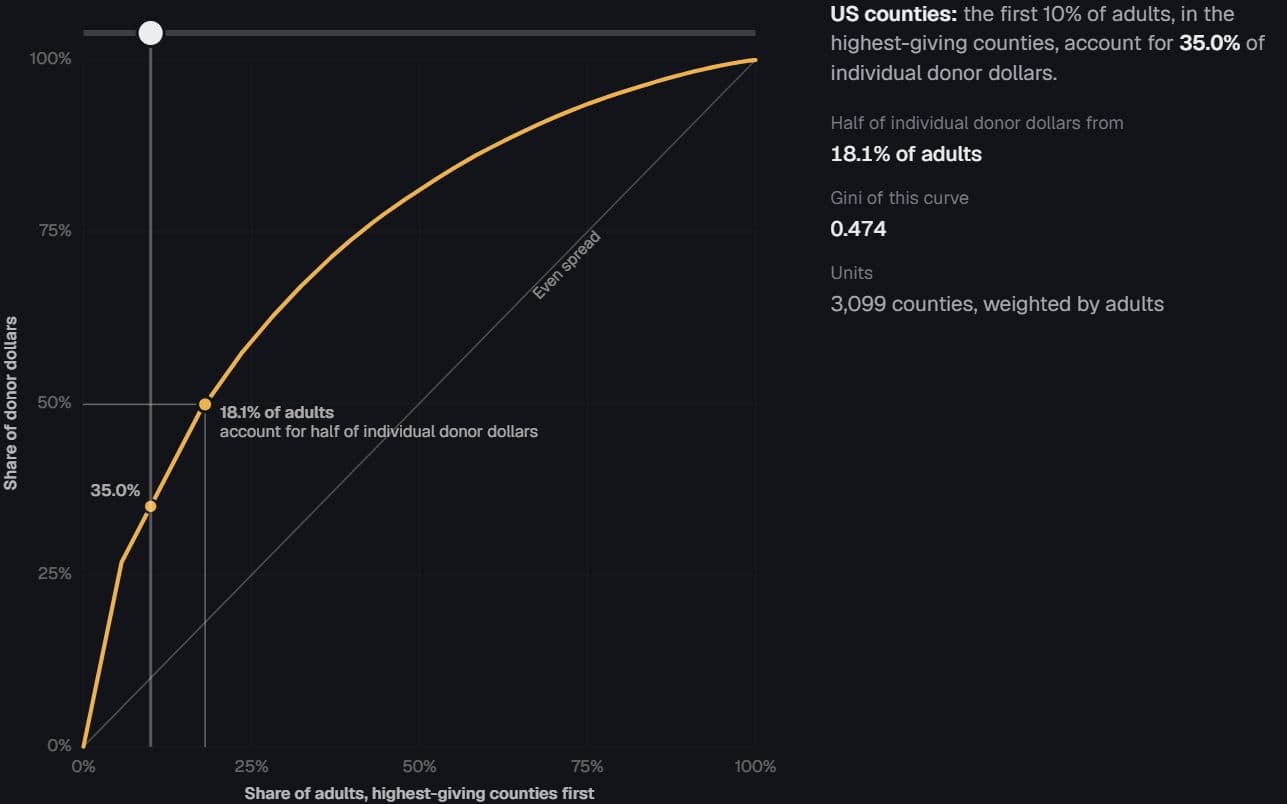
Deaths across neighbourhoods, donations across counties, income or wealth across households: any total summed over units that can be ranked by intensity.
Watch out for
Do not compare curves built on different units or boundaries without saying so (a county-equivalent city leaves out its suburbs). Do not present a Gini recomputed from a downsampled curve as the source’s, or quote a Gini that ranks a different quantity.
Data shape & units
series: { key, label, points, half?, gini?, note?, reference? }[]; points are cumulative [population %, outcome %] pairs from 0,0 to 100,100, most concentrated first. half is the population share holding half the outcome, as supplied.
Missing values
Values between supplied vertices are straight-line interpolations and are labelled as such. A curve with no supplied half-share gets no callout, and a Gini appears only when supplied for that curve.
Controls & accessibility
Hover a curve to bring it forward with its half-share callout; the key buttons and a select keep one forward. Drag the handle above the plot, or focus it and use the arrow keys, Home and End: every curve reports the share its first N% hold, as dots, in the key and in the status line.
Use the component
Install from the CTZN registry, then pass your prepared rows. Examples below illustrate the component contract.
npx shadcn add @ctzn-viz/concentration-curve<ConcentrationCurve series={curves} defaultFocused="us"
populationLabel="people" outcomeLabel="gun homicide deaths"
xLabel="Share of people" yLabel="Share of deaths"
ariaLabel="Concentration of gun homicide deaths" />Examples using this form
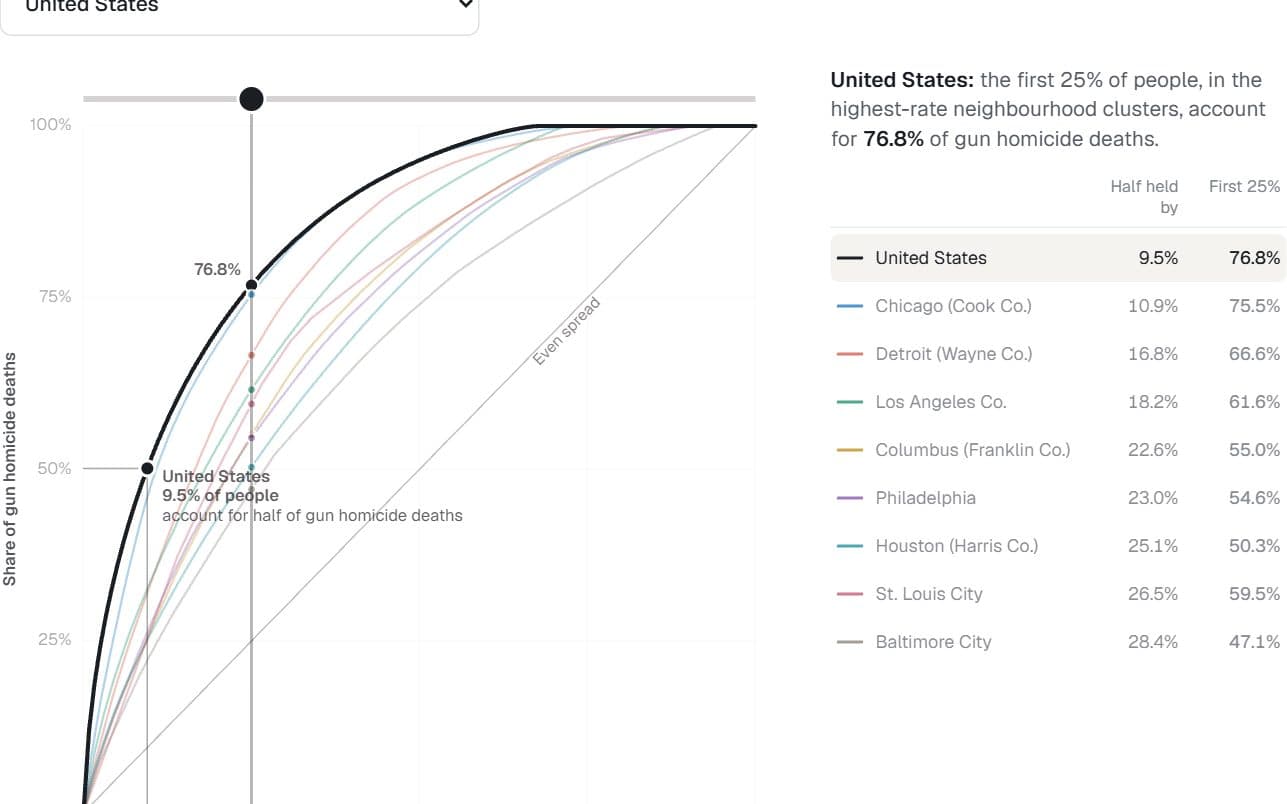
US and eight large jurisdictions · CDC firearm homicide, 2022–2024
Half the deaths, a sliver of the map
What share of people account for half of gun homicide deaths, nationally and within big cities?
Hides: The true concentration, which is higher: the finest unit published is a cluster of about five tracts.
Try it: Drag along the curve
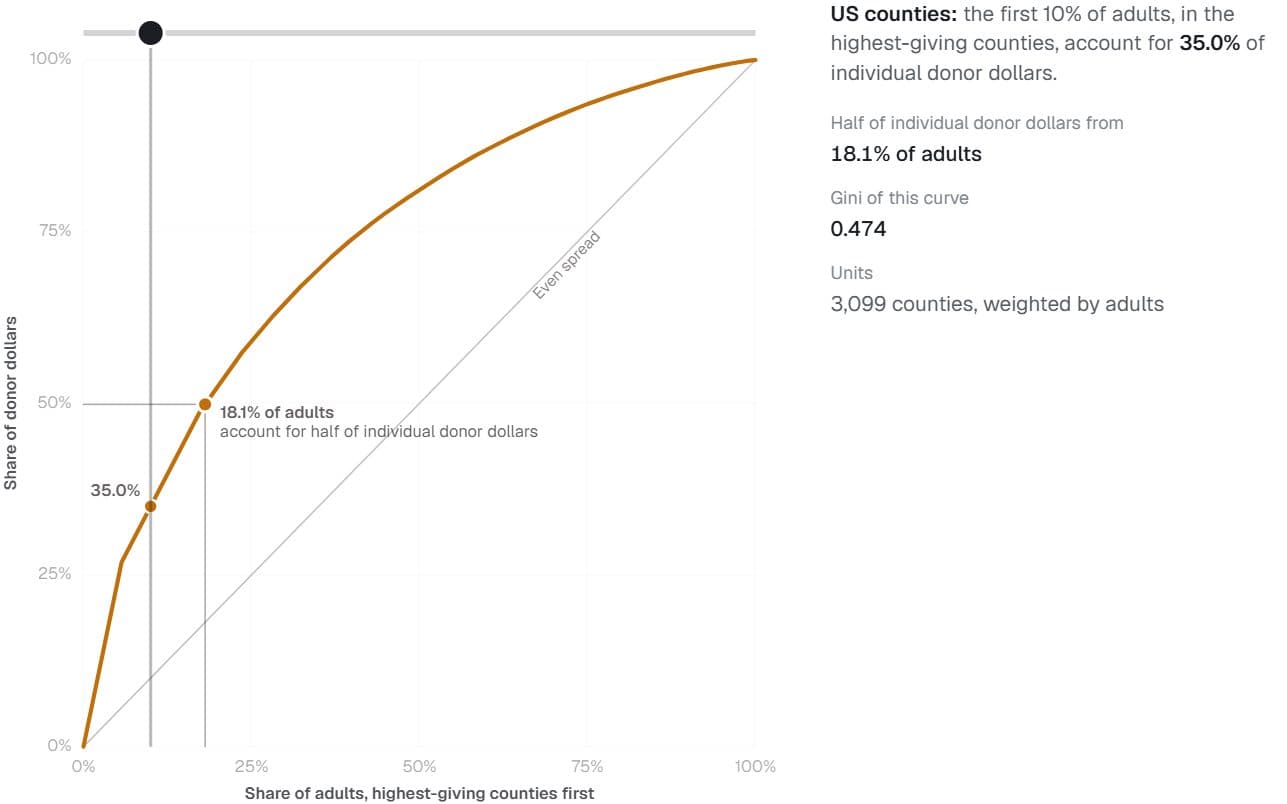
3,099 US counties · Stanford DIME donations and adult population
A sliver of the country funds the rest
What share of American adults supply half of all individual campaign donations?
Hides: Individual donors. Counties are the unit, so a curve over people would be steeper still.
Try it: Drag along the curve