Interval scatter
Place units by two estimates at once, each with its own interval, so both kinds of uncertainty stay in view.
GSS 1972–2024 · ANES 1948–2024
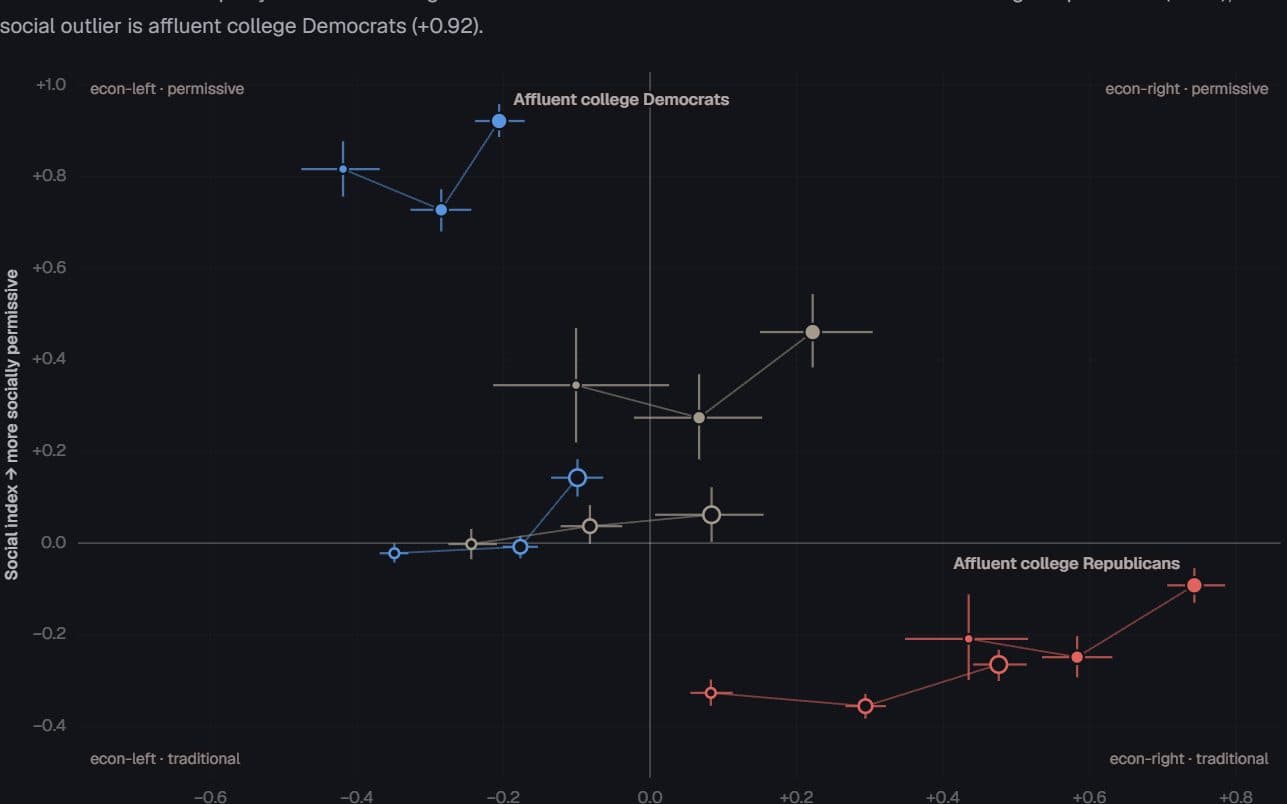
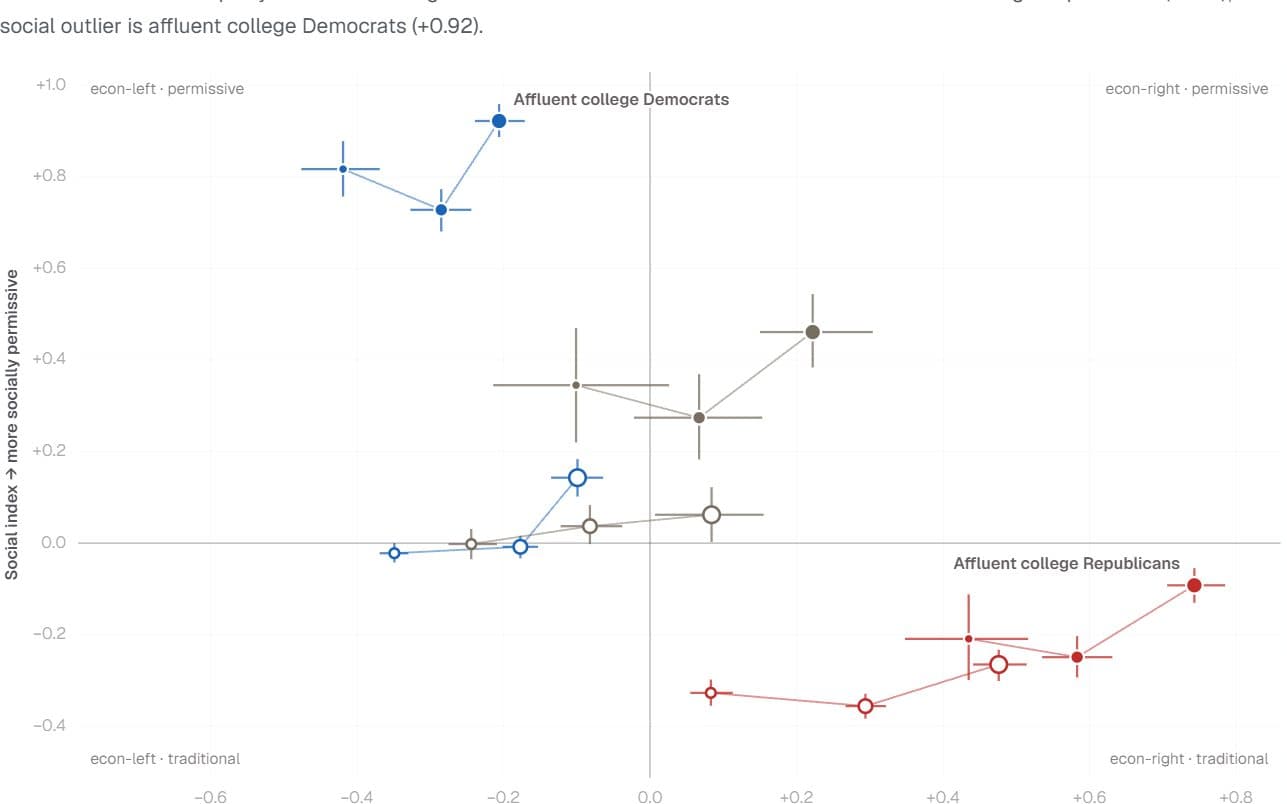
Party × income × college cells placed by their economic and social index means; whiskers are 95% bootstrap intervals on both axes.
GSS 1972–2024: all 18 party × income × college cells on both indices. The economic outlier is affluent college Republicans (+0.74); the social outlier is affluent college Democrats (+0.92).
- Democrats
- Independents
- Republicans
College degreeNo degreeDot size: income third, low → high; a thin line joins each group’s thirdsWhiskers: 95% bootstrap intervals
Economic items
Social items
GSS cells: Economic index and Social index · 18 rows
| Party | Income third | Degree | Economic index | Across: lower 95% | Across: upper 95% | Social index | Up: lower 95% | Up: upper 95% | N across | N up |
|---|---|---|---|---|---|---|---|---|---|---|
| Democrats | Low-income | No college | -0.35 | -0.37 | -0.33 | -0.02 | -0.04 | 0 | 12,047 | 12,063 |
| Democrats | Low-income | College | -0.42 | -0.48 | -0.37 | 0.82 | 0.76 | 0.88 | 1,583 | 1,551 |
| Democrats | Middle-income | No college | -0.18 | -0.2 | -0.15 | -0.01 | -0.03 | 0.02 | 7,739 | 7,810 |
| Democrats | Middle-income | College | -0.29 | -0.33 | -0.24 | 0.73 | 0.68 | 0.77 | 2,828 | 2,738 |
| Democrats | Affluent | No college | -0.1 | -0.14 | -0.06 | 0.14 | 0.1 | 0.18 | 3,468 | 3,499 |
| Democrats | Affluent | College | -0.21 | -0.24 | -0.17 | 0.92 | 0.89 | 0.96 | 3,523 | 3,444 |
| Independents | Low-income | No college | -0.24 | -0.28 | -0.21 | -0 | -0.04 | 0.03 | 4,618 | 4,507 |
| Independents | Low-income | College | -0.1 | -0.21 | 0.03 | 0.35 | 0.22 | 0.47 | 391 | 376 |
| Independents | Middle-income | No college | -0.08 | -0.12 | -0.04 | 0.04 | -0 | 0.08 | 2,495 | 2,445 |
| Independents | Middle-income | College | 0.07 | -0.02 | 0.15 | 0.27 | 0.18 | 0.37 | 636 | 622 |
| Independents | Affluent | No college | 0.08 | 0.01 | 0.16 | 0.06 | 0 | 0.12 | 1,051 | 1,038 |
| Independents | Affluent | College | 0.22 | 0.15 | 0.3 | 0.46 | 0.38 | 0.54 | 717 | 689 |
| Republicans | Low-income | No college | 0.08 | 0.06 | 0.11 | -0.33 | -0.36 | -0.3 | 6,329 | 6,245 |
| Republicans | Low-income | College | 0.44 | 0.35 | 0.52 | -0.21 | -0.3 | -0.11 | 885 | 845 |
| Republicans | Middle-income | No college | 0.29 | 0.27 | 0.32 | -0.36 | -0.38 | -0.33 | 5,801 | 5,730 |
| Republicans | Middle-income | College | 0.58 | 0.54 | 0.63 | -0.25 | -0.29 | -0.2 | 2,052 | 1,993 |
| Republicans | Affluent | No college | 0.48 | 0.44 | 0.51 | -0.27 | -0.3 | -0.23 | 3,669 | 3,634 |
| Republicans | Affluent | College | 0.74 | 0.71 | 0.79 | -0.09 | -0.13 | -0.06 | 3,302 | 3,208 |
Page 1 of 1
Cells: party (D/I/R, leaners folded in) x income (weighted within-year terciles, GSS realinc; ANES income_5cat collapsed) x college (BA+ vs not). Economic index: weighted z-scored mean of government-role/redistribution items; higher = economic-right. GSS items: helppoor, helpsick, helpnot, goveqinc, natfare, natheal, natsoc. ANES items: jobs_7pt, health_ins_7pt, spend_welfare_incr, spend_poor_incr, spend_social_sec_incr, spend_schools_incr, spend_environment_incr, aid_blacks_7pt. Social index: weighted z-scored mean of moral/social items; higher = socially permissive (left). GSS items: abany, homosex, gunlaw, grass, prayer, premarsx, fefam, pornlaw, cappun, divlaw. ANES items: favor_death_penalty, guns_harder, favor_gay_adoption, favor_lgbt_protection, abort_legal_4cat. Items: each item z-scored then signed by its own weighted correlation with party (Republican-increasing); orientation verified empirically, not hand-coded. Tiles show each item’s absolute correlation with party; its sign only reflects how the question was coded. Intervals: seeded weighted bootstrap, 600 reps, 2.5/97.5 percentiles. Suppression: cells with n<150 or Kish effective N<100 suppressed. Both indices are z-scored, so the rules at zero mark each survey’s pooled average. The GSS moved to web administration in 2021; those years are pooled here with earlier interviews.
General Social Survey 1972–2024 (NORC) and ANES Cumulative Data File 1948–2024 · weighted party × income × college cells
Preview
How to read it
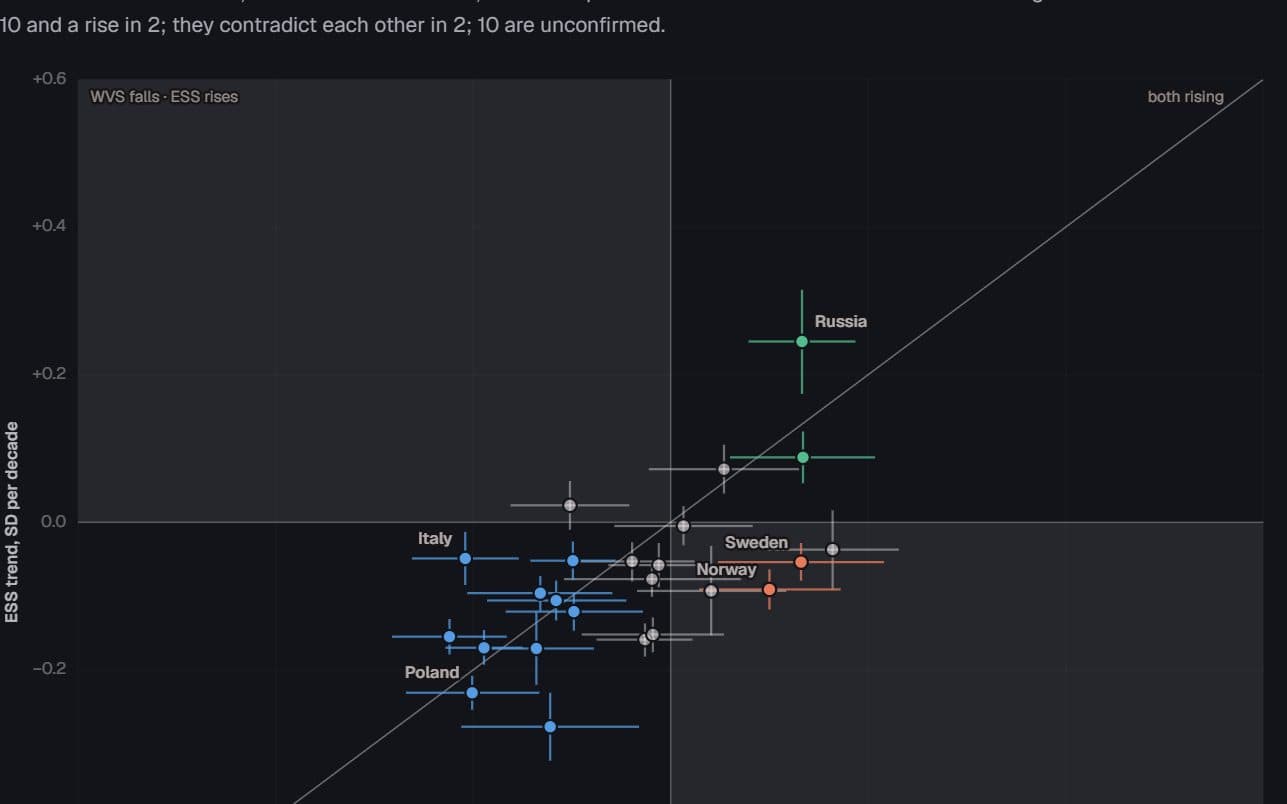
Each dot is one unit; the horizontal whisker is the interval on the first estimate and the vertical whisker the interval on the second. Rules mark each axis’s reference; on an agreement chart the diagonal is where both estimates are equal.
When to use it
Group positions on two indices, the same quantity measured by two instruments, or predicted against observed values when both carry intervals.
Watch out for
Do not draw whiskers the source did not publish, and do not read overlapping one-dimensional intervals as a test of difference. Past a few dozen points the whiskers become a mesh.
Data shape & units
{ key, label, x, y, xLo?, xHi?, yLo?, yHi?, group?, hollow?, r?, trace?, order?, details? }[]. Stable keys let a data swap move points rather than redraw them.
Missing values
A point missing either coordinate is omitted, never parked on a rule. An axis without published bounds gets no whisker, and the tooltip says so.
Controls & accessibility
Hover or arrow-key to a point for both estimates with intervals and n; Enter or click selects it into the status line. Survey, item and family switches move keyed points; the item explorer is a radio group of tiles (arrows, Home, End).
Use the component
Install from the CTZN registry, then pass your prepared rows. Examples below illustrate the component contract.
npx shadcn add @ctzn-viz/interval-scatter<IntervalScatter data={cells} colors={partyColors}
xDomain={[-0.8, 0.9]} yDomain={[-0.5, 1]}
quadrantLabels={{ topLeft: "econ-left · permissive" }}
xLabel="Economic index" yLabel="Social index"
ariaLabel="Cells on two indices" />Examples using this form
US voters · General Social Survey and ANES, 1948–2024
The outlier depends on the axis
Which slice of the electorate stands furthest from everyone else — and does the answer change between economic and social questions?
Hides: Design-based uncertainty. The intervals are bootstrap estimates, and the GSS moved online in 2021.
Try it: Switch survey items
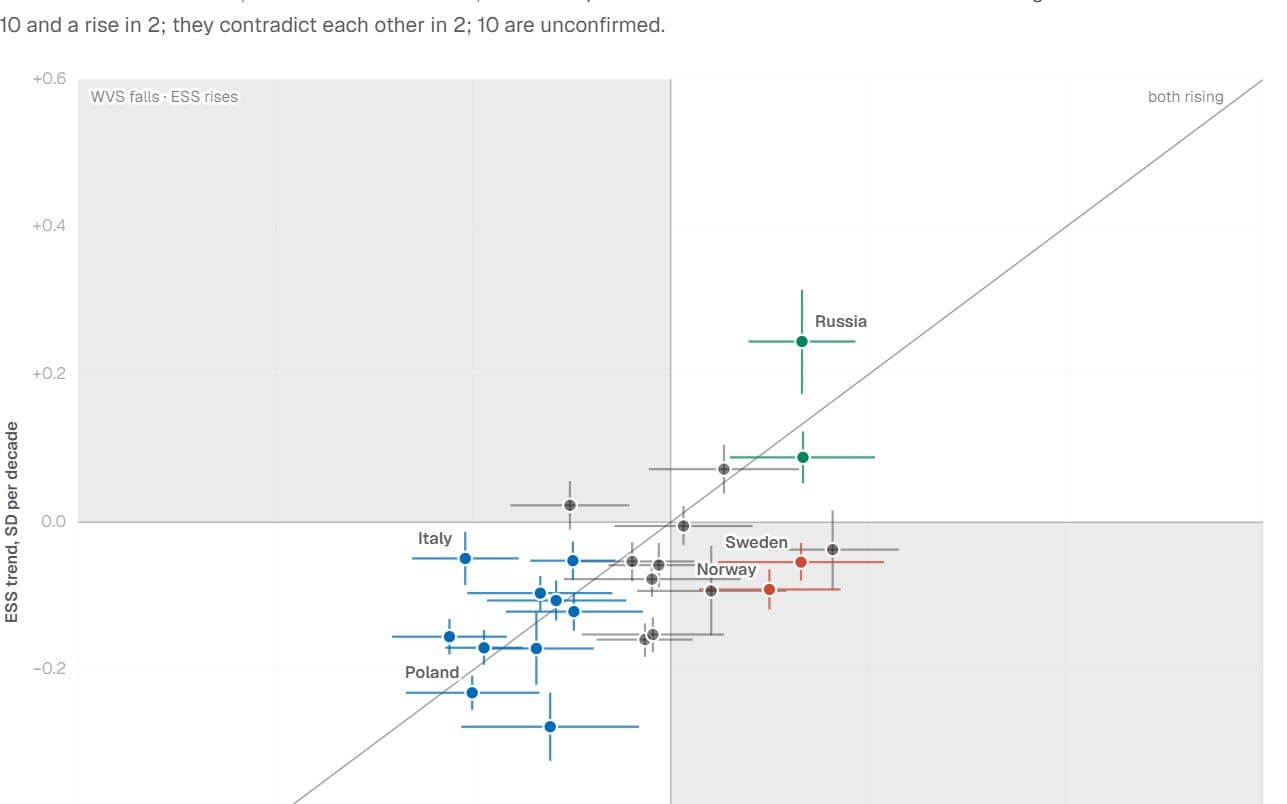
European countries · World/European Values Study and European Social Survey
Two instruments, one trend?
When two major surveys measure the same country, do they see religion changing in the same direction?
Hides: A pooled estimate. Each survey is analysed on its own, and the two are compared country by country.
Try it: Switch the trend compared