Value heatmap
Compare a quantity across two categorical dimensions, without hiding the numbers.
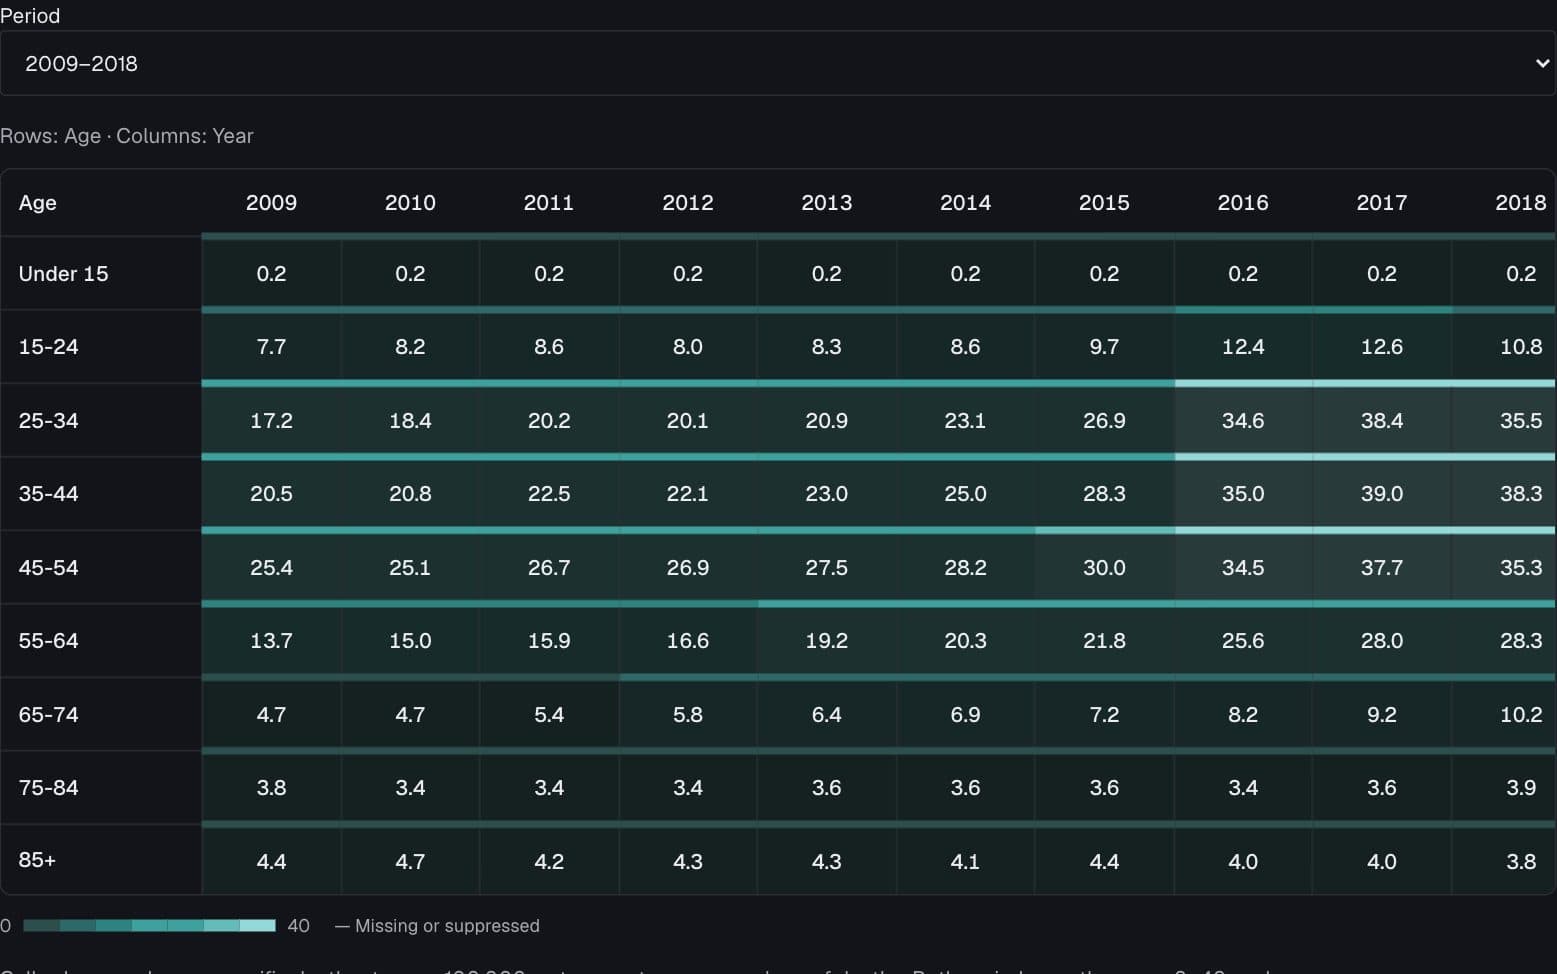
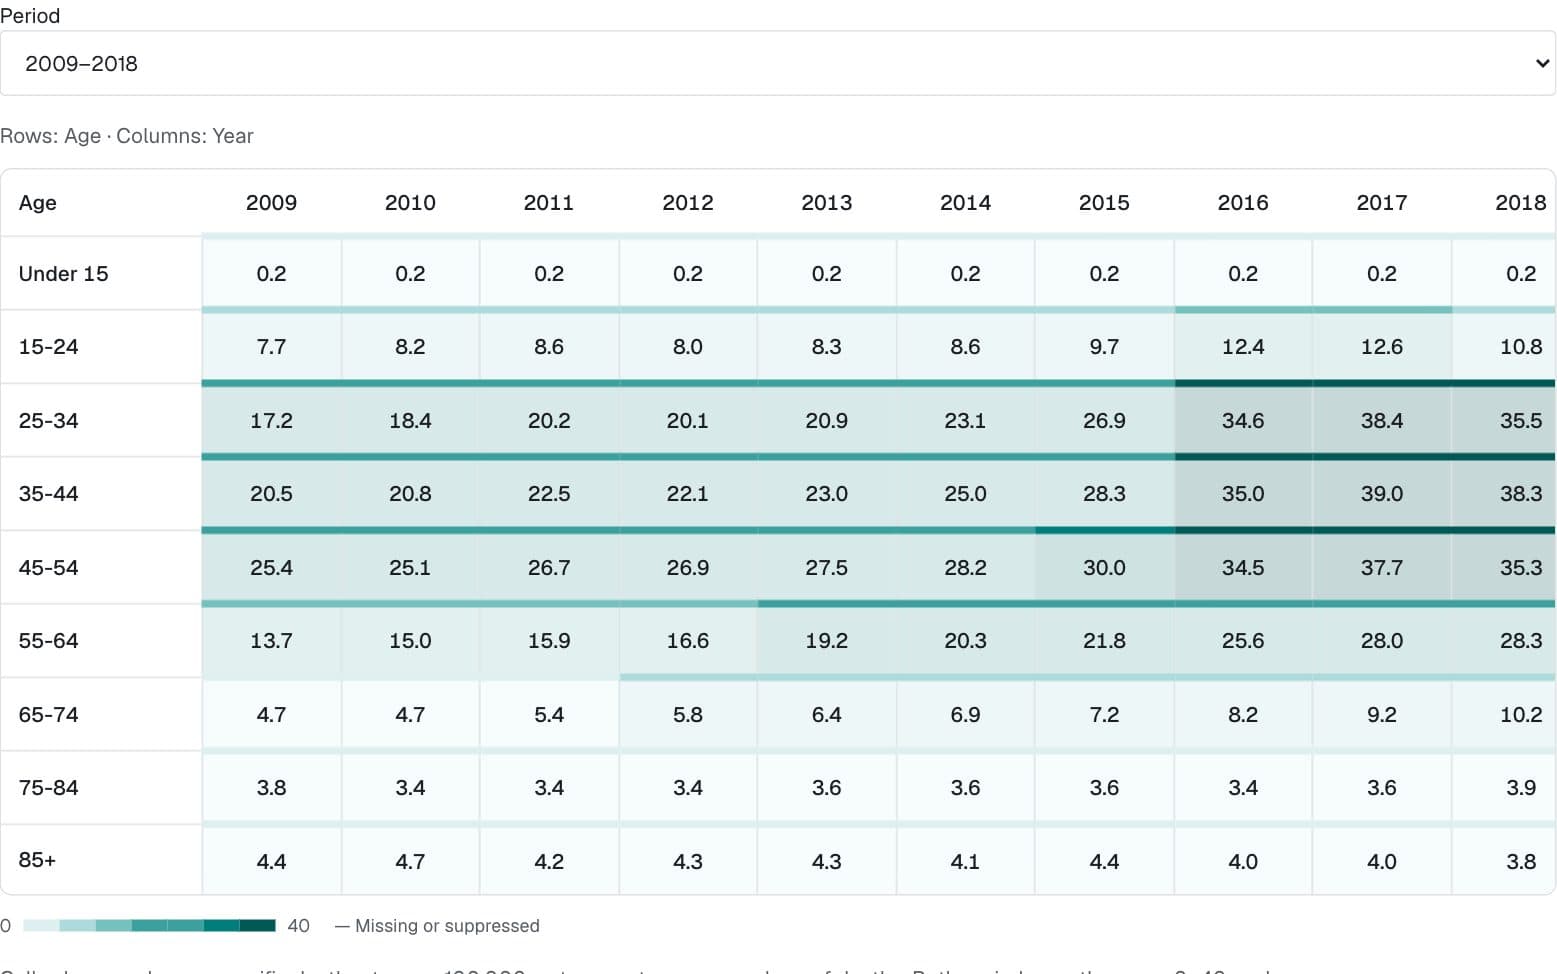
Rows: Age · Columns: Year
| Age | 2009 | 2010 | 2011 | 2012 | 2013 | 2014 | 2015 | 2016 | 2017 | 2018 |
|---|---|---|---|---|---|---|---|---|---|---|
| Under 15 | 0.2 | 0.2 | 0.2 | 0.2 | 0.2 | 0.2 | 0.2 | 0.2 | 0.2 | 0.2 |
| 15-24 | 7.7 | 8.2 | 8.6 | 8.0 | 8.3 | 8.6 | 9.7 | 12.4 | 12.6 | 10.8 |
| 25-34 | 17.2 | 18.4 | 20.2 | 20.1 | 20.9 | 23.1 | 26.9 | 34.6 | 38.4 | 35.5 |
| 35-44 | 20.5 | 20.8 | 22.5 | 22.1 | 23.0 | 25.0 | 28.3 | 35.0 | 39.0 | 38.3 |
| 45-54 | 25.4 | 25.1 | 26.7 | 26.9 | 27.5 | 28.2 | 30.0 | 34.5 | 37.7 | 35.3 |
| 55-64 | 13.7 | 15.0 | 15.9 | 16.6 | 19.2 | 20.3 | 21.8 | 25.6 | 28.0 | 28.3 |
| 65-74 | 4.7 | 4.7 | 5.4 | 5.8 | 6.4 | 6.9 | 7.2 | 8.2 | 9.2 | 10.2 |
| 75-84 | 3.8 | 3.4 | 3.4 | 3.4 | 3.6 | 3.6 | 3.6 | 3.4 | 3.6 | 3.9 |
| 85+ | 4.4 | 4.7 | 4.2 | 4.3 | 4.3 | 4.1 | 4.4 | 4.0 | 4.0 | 3.8 |
0
40— Missing or suppressed
Cells show crude age-specific death rates per 100,000, not percentages or numbers of deaths. Both periods use the same 0–40 scale.
Crude rates per 100,000 within each age group, all drug overdose deaths.
NCHS, "Drug overdose death rates, by drug type, sex, age, race, and Hispanic origin: United States" (data.cdc.gov 95ax-ymtc)
Preview
How to read it
Follow a row or column to compare values. Every cell uses the same scale; darker or stronger marks indicate more of the measured quantity.
When to use it
Age × party, circumstance × year, and other modest-sized cross-tabulations.
Watch out for
Do not rescale each row independently when values should be comparable. Use a diverging encoding only when the quantity has a meaningful midpoint.
Data shape & units
{ row: string, column: string, value: number | null, n?: number }. Ordered rows and columns define the complete grid; percentages are 0–100.
Missing values
Pass null or omit a cell for unavailable/suppressed values. Missing years stay absent. Keep low-N suppression separate from a measured zero.
Controls & accessibility
Use question and period controls to keep comparisons readable. Wide tables scroll within their own keyboard-focusable region; values remain visible without hover.
Use the component
Install from the CTZN registry, then pass your prepared rows. Examples below illustrate the component contract.
npx shadcn add @ctzn-viz/value-matrix<ValueMatrix rows={parties} columns={ages} cells={cells}
domain={[0, 100]} rowLabel="Party" columnLabel="Age"
ariaLabel="Support by age and party" />Examples using this form
NCHS, "Drug overdose death rates, by drug type, sex, age, race, and Hispanic origin: United States" (data.cdc.gov 95ax-ymtc)
The overdose wave across ages
Which age groups saw the largest changes in overdose mortality?
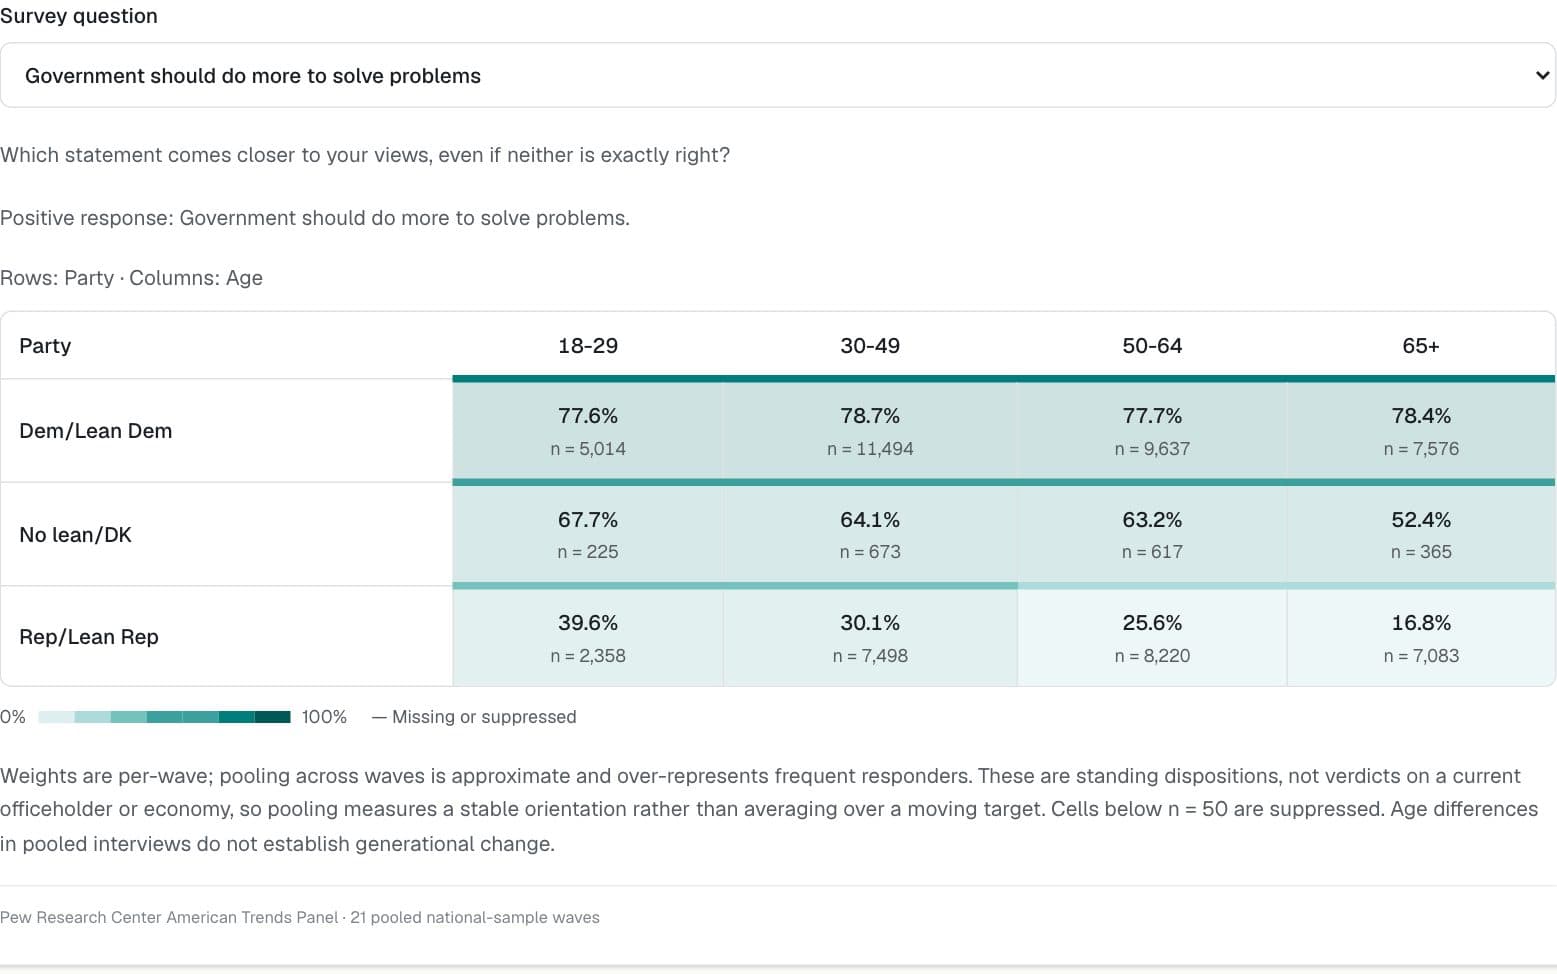
Pew Research Center American Trends Panel
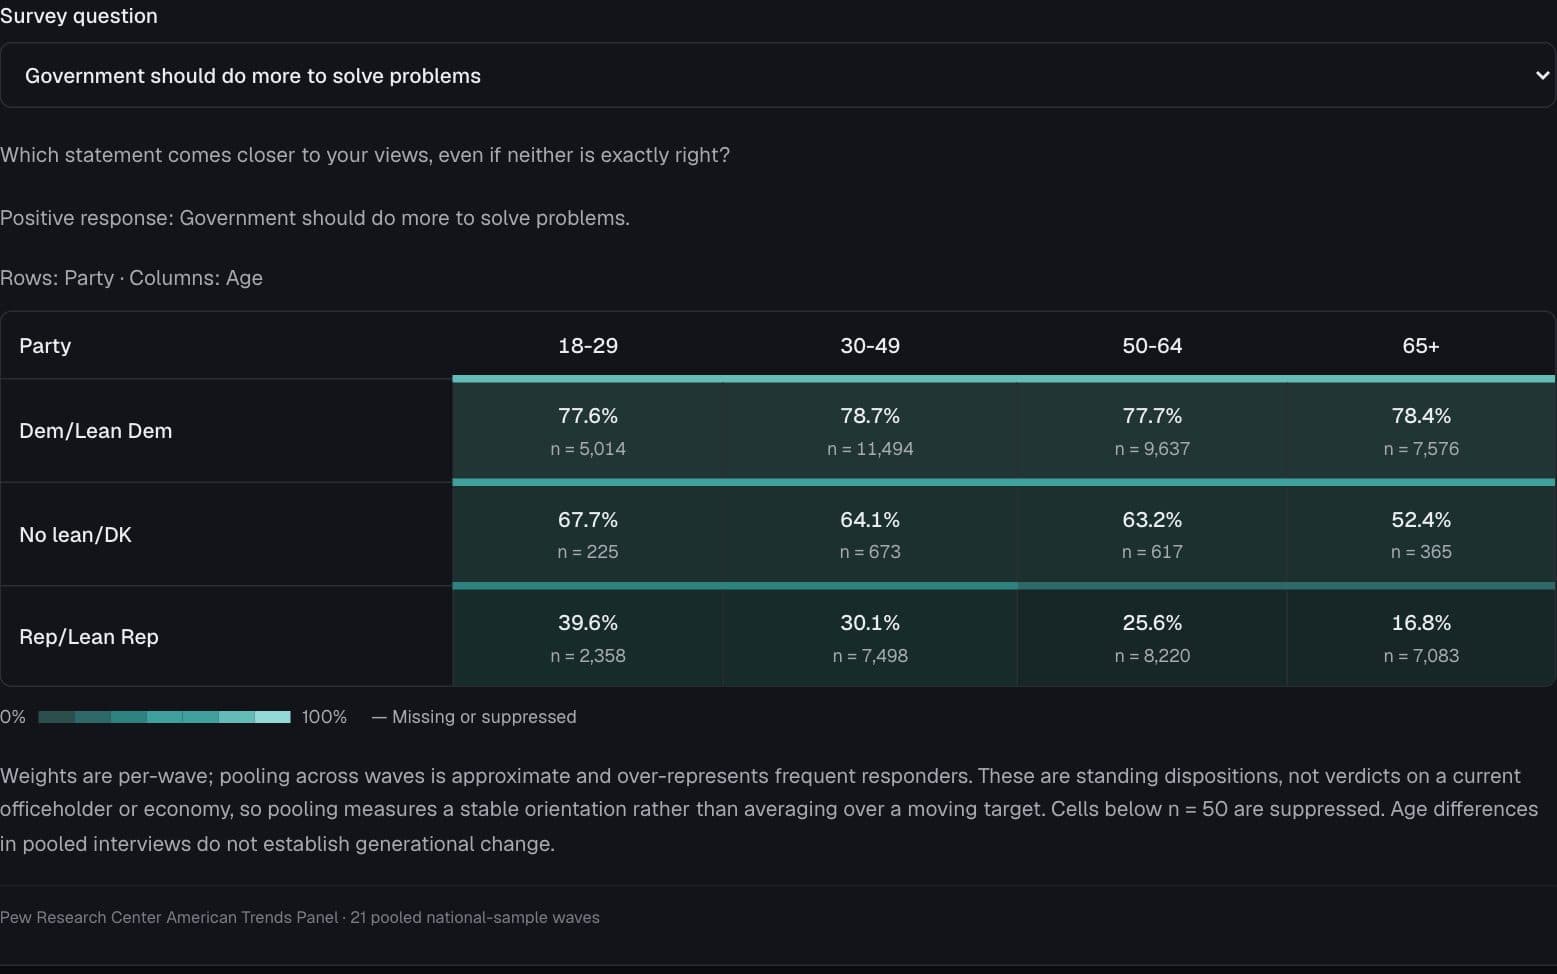
Age divides, within party lines
Do age differences look the same among Democrats and Republicans?
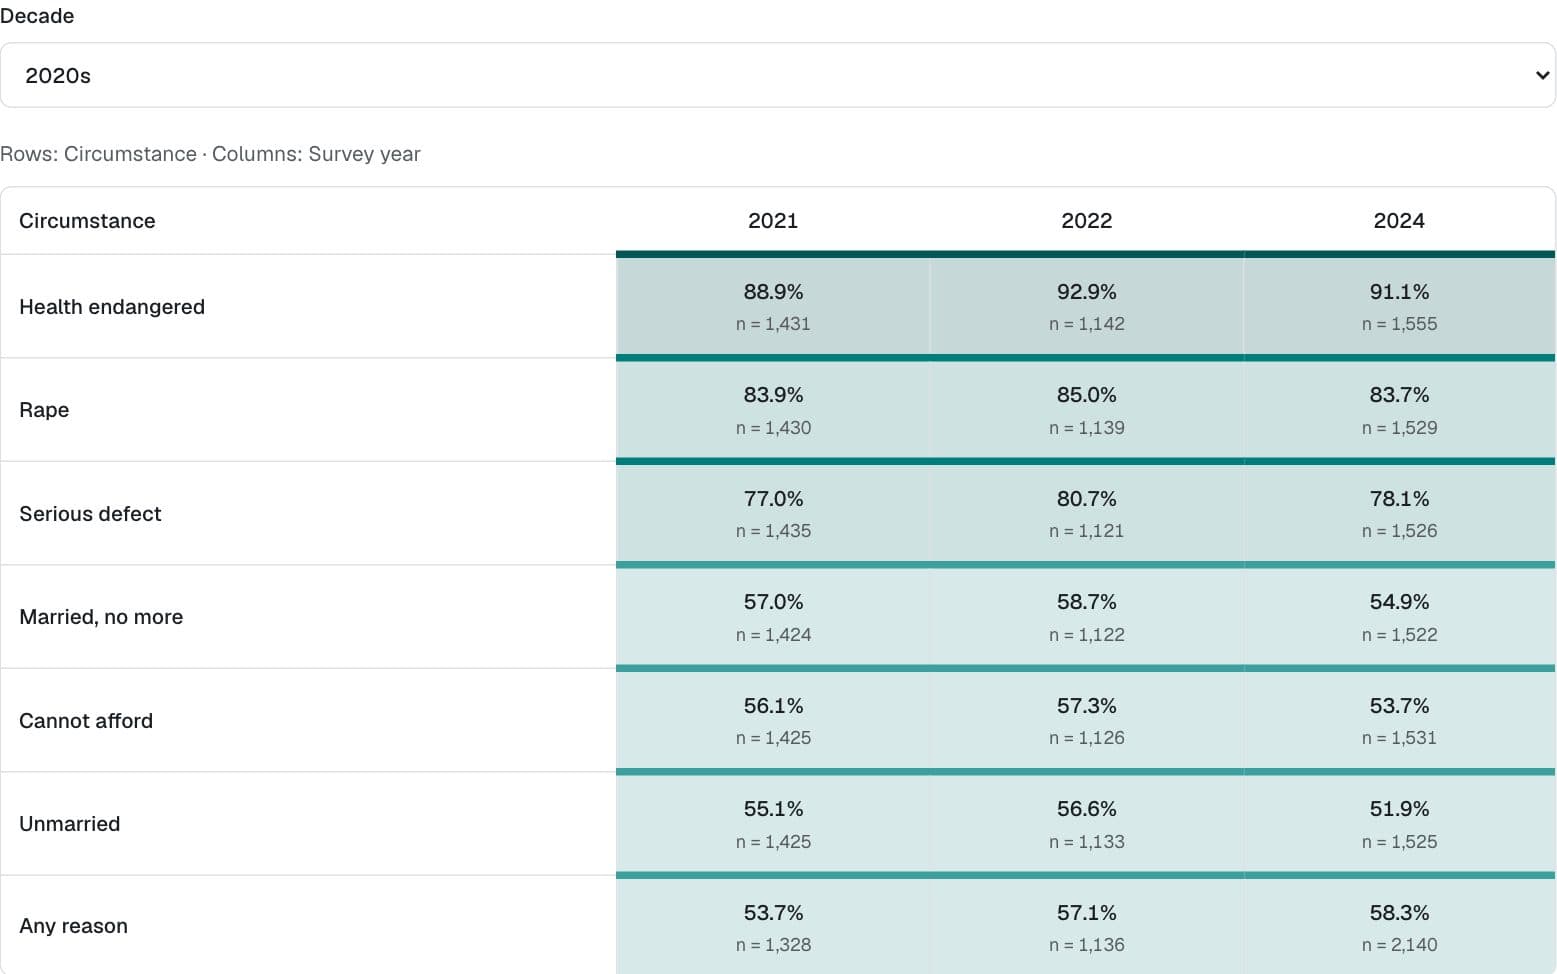
General Social Survey
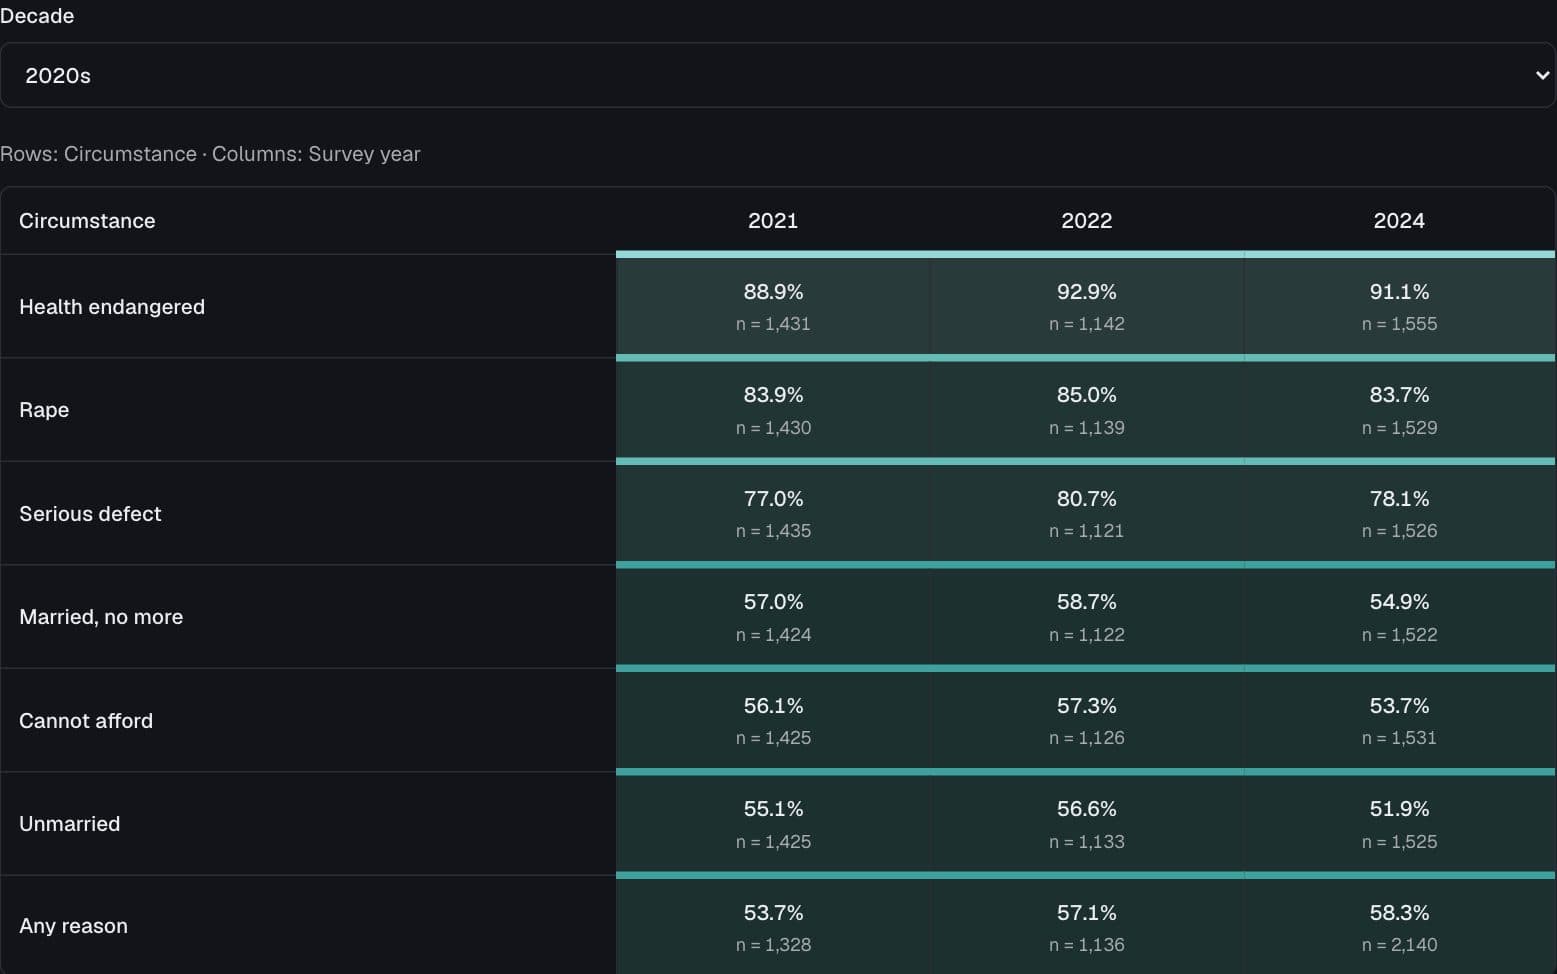
Seven circumstances, different answers
How does support for legal abortion depend on the circumstance and survey year?