Interrupted time series with a movable cut
Test a dated break by moving the cut and watching where the estimated jump is largest.
Nationscape · weekly waves, 2019–2021
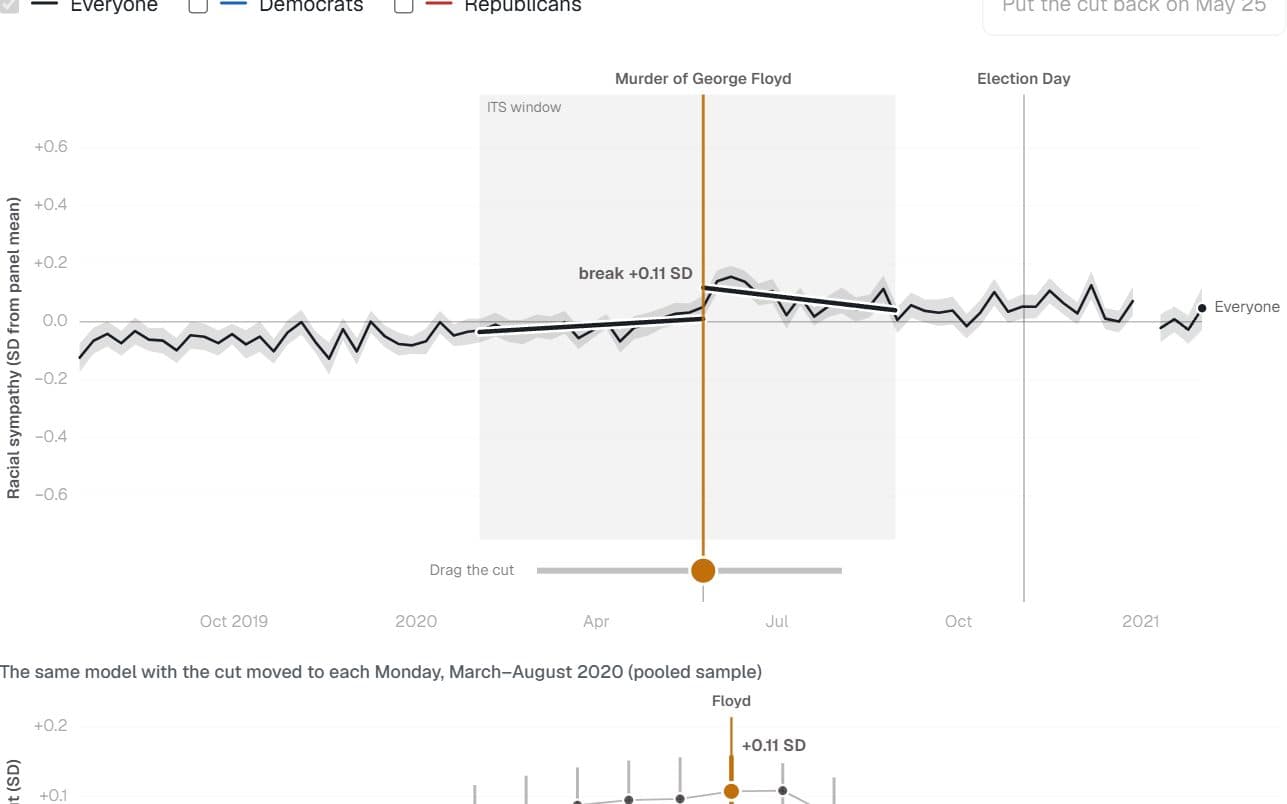
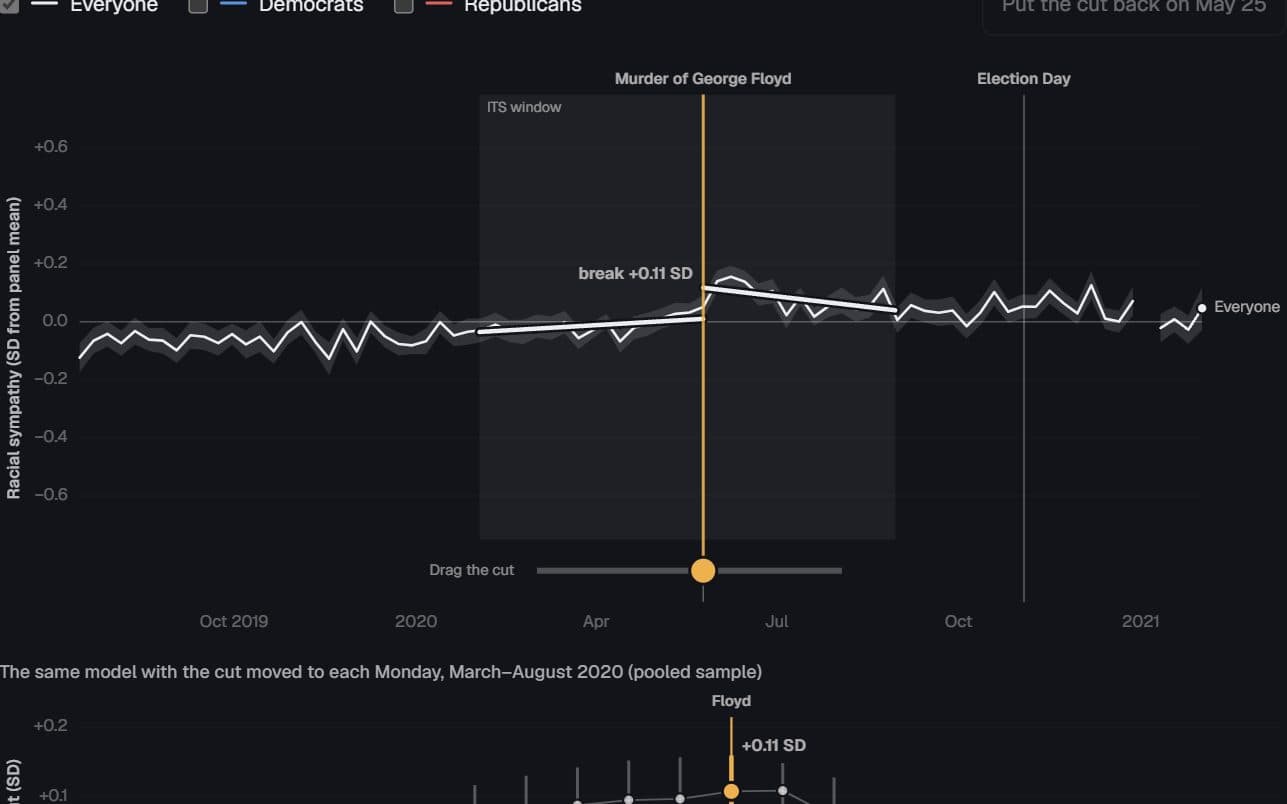
Weekly racial-sympathy index, in standard deviations from the panel mean, with 95% intervals and the interrupted-time-series fit at 25 May 2020. Drag the cut along the weeks: the panel below re-reads the break at every candidate Monday, and it peaks at the murder.
The same model with the cut moved to each Monday, March–August 2020 (pooled sample)
Cut at May 25, 2020 (the murder): break +0.11 SD (95% CI +0.06 to +0.16) in the pooled sample. The largest, +0.11 SD, is at Jun 1, 2020.
Each weekly point is the weighted mean of a two-item racial-sympathy index — the ANES “try harder” and “generations of slavery” battery, signed so higher is more sympathetic — standardized within Nationscape, so 0 is the panel’s pooled mean and one unit is one standard deviation. Bands are 95% intervals; a week needs at least 250 respondents, and the source has no estimate for the week of 4 January 2021, so the lines break there. The straight segments are the chapter’s interrupted-time-series fit (sympathy ~ t + post + t × post, weighted, week-clustered errors, 2 February – 30 August 2020). The lower panel refits that model with the cut moved to each Monday; a real shock should give its largest break at its own date, not at an arbitrary one. The pre-period trend is +0.0028 SD a week. Nationscape is an online, weighted nonprobability panel: read the timing, not the level. The vertical scale stays put as series are toggled, so a break keeps its size on screen.
The break at May 25, group by group
The same model estimated within each group, in SD units with week-clustered 95% intervals. Groups need at least 5,000 respondents in the window. Positive nearly everywhere; largest among Democrats and Black respondents, and indistinguishable from zero among Republicans.
Party
Race of respondent
Education
Weekly estimates · 82 rows
| Week of | Series | Index (SD) | Lower 95% | Upper 95% | n |
|---|---|---|---|---|---|
| 2019-07-15 | Everyone | -0.12 | -0.17 | -0.07 | 4,913 |
| 2019-07-22 | Everyone | -0.07 | -0.11 | -0.02 | 6,208 |
| 2019-07-29 | Everyone | -0.04 | -0.09 | 0 | 6,432 |
| 2019-08-05 | Everyone | -0.07 | -0.12 | -0.03 | 5,655 |
| 2019-08-12 | Everyone | -0.03 | -0.08 | 0.01 | 5,543 |
| 2019-08-19 | Everyone | -0.06 | -0.1 | -0.02 | 7,640 |
| 2019-08-26 | Everyone | -0.07 | -0.11 | -0.02 | 5,503 |
| 2019-09-02 | Everyone | -0.1 | -0.14 | -0.06 | 5,833 |
| 2019-09-09 | Everyone | -0.05 | -0.09 | 0 | 5,558 |
| 2019-09-16 | Everyone | -0.05 | -0.1 | -0.01 | 6,027 |
| 2019-09-23 | Everyone | -0.07 | -0.12 | -0.03 | 5,924 |
| 2019-09-30 | Everyone | -0.04 | -0.08 | -0.01 | 8,963 |
| 2019-10-07 | Everyone | -0.08 | -0.13 | -0.03 | 4,778 |
| 2019-10-14 | Everyone | -0.05 | -0.1 | 0 | 3,982 |
| 2019-10-21 | Everyone | -0.1 | -0.14 | -0.06 | 6,745 |
| 2019-10-28 | Everyone | -0.04 | -0.08 | 0.01 | 7,178 |
| 2019-11-04 | Everyone | -0 | -0.04 | 0.04 | 5,750 |
| 2019-11-11 | Everyone | -0.07 | -0.11 | -0.03 | 7,346 |
| 2019-11-18 | Everyone | -0.13 | -0.18 | -0.07 | 3,600 |
| 2019-11-25 | Everyone | -0.03 | -0.06 | 0.01 | 7,755 |
Page 1 of 5
Break at each candidate cut (pooled sample) · 23 rows
| Cut at | Break (SD) | Lower 95% | Upper 95% | n |
|---|---|---|---|---|
| 2020-03-02 | 0.01 | -0.03 | 0.04 | 197,386 |
| 2020-03-09 | -0 | -0.04 | 0.03 | 197,386 |
| 2020-03-16 | 0 | -0.03 | 0.03 | 197,386 |
| 2020-03-23 | -0.01 | -0.04 | 0.02 | 197,386 |
| 2020-03-30 | 0.02 | -0.02 | 0.06 | 197,386 |
| 2020-04-06 | 0.04 | -0 | 0.07 | 197,386 |
| 2020-04-13 | 0.03 | -0.02 | 0.08 | 197,386 |
| 2020-04-20 | 0.06 | 0.01 | 0.12 | 197,386 |
| 2020-04-27 | 0.08 | 0.02 | 0.13 | 197,386 |
| 2020-05-04 | 0.09 | 0.03 | 0.14 | 197,386 |
| 2020-05-11 | 0.09 | 0.04 | 0.15 | 197,386 |
| 2020-05-18 | 0.1 | 0.04 | 0.16 | 197,386 |
| 2020-05-25 | 0.11 | 0.06 | 0.16 | 197,386 |
| 2020-06-01 | 0.11 | 0.07 | 0.15 | 197,386 |
| 2020-06-08 | 0.07 | 0.01 | 0.13 | 197,386 |
| 2020-06-15 | 0.02 | -0.04 | 0.08 | 197,386 |
| 2020-06-22 | -0.02 | -0.08 | 0.04 | 197,386 |
| 2020-06-29 | -0.04 | -0.1 | 0.02 | 197,386 |
| 2020-07-06 | -0.07 | -0.13 | -0.01 | 197,386 |
| 2020-07-13 | -0.05 | -0.12 | 0.01 | 197,386 |
Page 1 of 2
Break at May 25 by group · 12 rows
| Lens | Group | Break (SD) | Lower 95% | Upper 95% | n |
|---|---|---|---|---|---|
| education | College | 0.12 | 0.03 | 0.2 | 43,401 |
| education | HS or less | 0.1 | 0.04 | 0.15 | 65,627 |
| education | Postgrad | 0.16 | 0.1 | 0.22 | 27,471 |
| education | Some college | 0.09 | 0.04 | 0.15 | 60,887 |
| party | Democrats | 0.17 | 0.09 | 0.26 | 89,718 |
| party | Independents | 0.06 | -0.01 | 0.13 | 30,059 |
| party | Republicans | 0.04 | -0.01 | 0.1 | 77,451 |
| race | Asian | 0.12 | -0 | 0.23 | 9,057 |
| race | Black | 0.2 | 0.13 | 0.28 | 21,473 |
| race | Hispanic | 0.04 | -0.05 | 0.14 | 29,980 |
| race | Other | 0.11 | -0.04 | 0.26 | 6,437 |
| race | White | 0.11 | 0.05 | 0.18 | 130,439 |
Page 1 of 1
Democracy Fund + UCLA Nationscape · weighted weekly waves, July 2019 – February 2021 · The Public Mind, “The Floyd Inflection”
Preview
How to read it
The line is the series with its intervals; the straight segments are the model fitted at the analyst’s cut, and the gap between them is the break. The handle moves the cut through the candidate dates, and the lower panel shows the break estimated at every candidate with the selected one highlighted. A real event produces its largest break at its own date.
When to use it
Policy changes, shocks and events with a known date, when a placebo profile (the same model re-fitted at many candidate cuts) is available to show beside the fit.
Watch out for
Do not re-fit models in the browser or draw fits at cuts that were not estimated. A peak in the placebo profile dates a change; it does not identify its mechanism. A nonprobability panel dates change better than it measures levels.
Data shape & units
data: { x, series, estimate, lo?, hi?, n? }[] with x in epoch milliseconds (or any number with timeAxis={false}); candidates: { cut, estimate, lo?, hi?, n? }[]; segments: { series, x0, y0, x1, y1 }[]; breaks: Record<series, { estimate, lo?, hi? }>; events: { x, label, shortLabel? }[].
Missing values
A null estimate breaks the line and its band rather than bridging the gap, so write unreported weeks as explicit null rows. Candidates without bounds draw a bare dot. The cut can only sit on a candidate; nothing is interpolated between them.
Controls & accessibility
Drag the handle, or use the arrow, Home and End keys on it; click an estimate in the lower panel, or press Enter on it, to move the cut there. A status line states the cut, its break and 95% interval, the peak, and the fitted breaks for other visible series. Toggling series leaves the y scale unchanged.
Use the component
Install from the CTZN registry, then pass your prepared rows. Examples below illustrate the component contract.
npx shadcn add @ctzn-viz/shock-window<ShockWindow data={weekly} candidates={placebo}
trueCut={floyd} cut={cut} onCutChange={setCut}
segments={fit} breaks={breaks} events={events}
formatValue={{ kind: "delta", digits: 2, suffix: " SD" }}
ariaLabel="Weekly index with a movable cut" />