Ranking under uncertainty
Expose the uncertainty a league table usually hides.
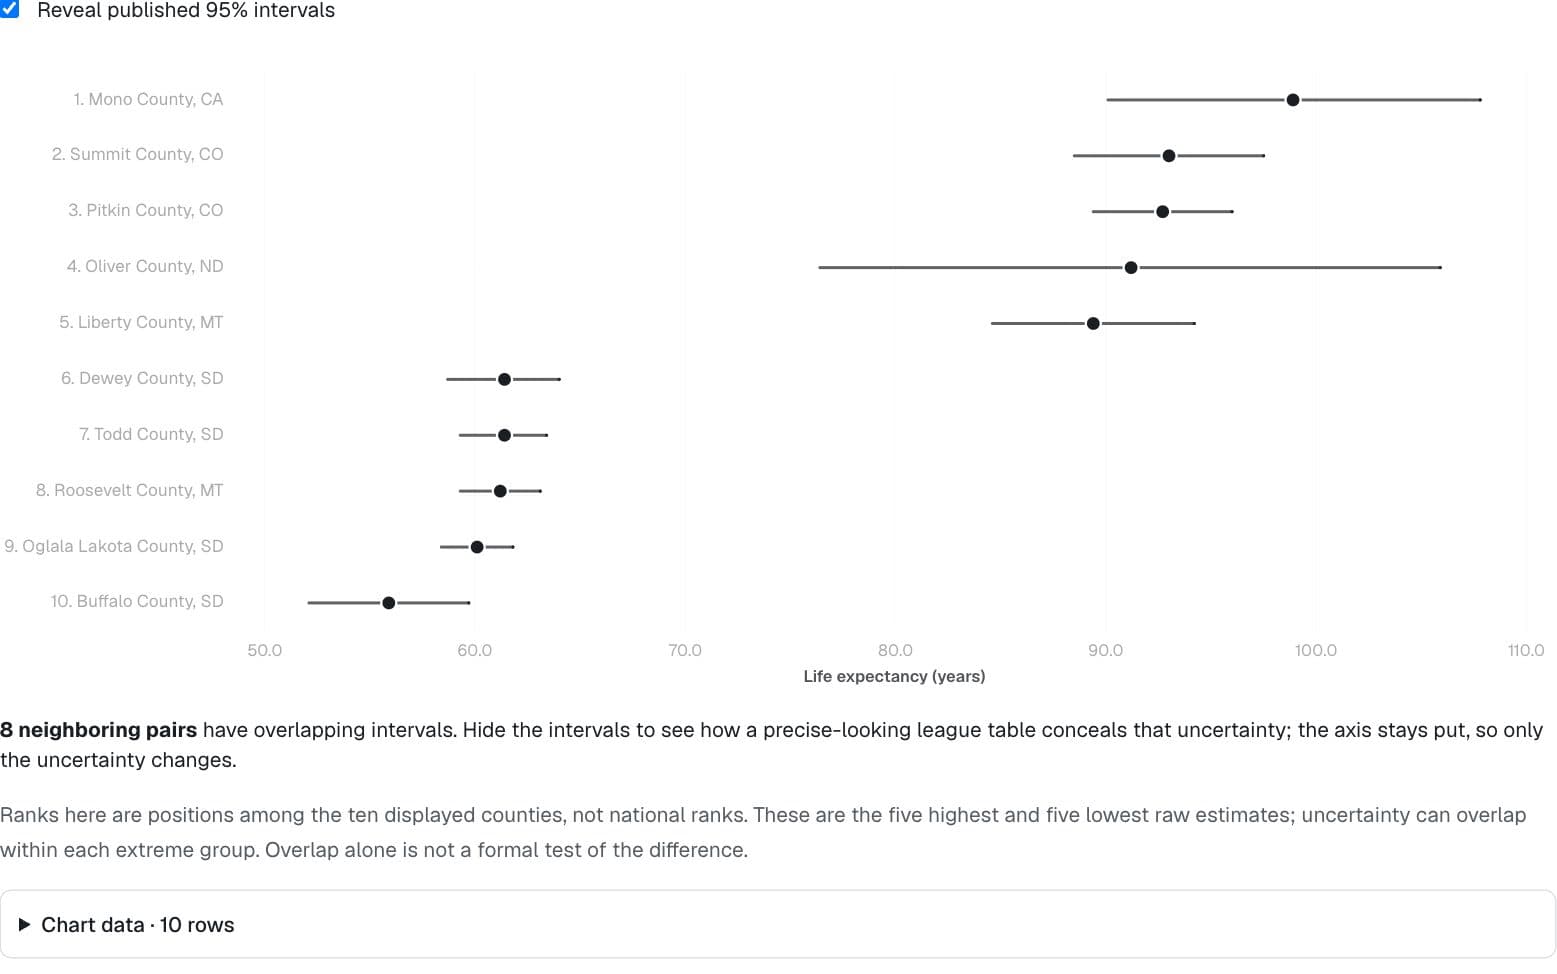
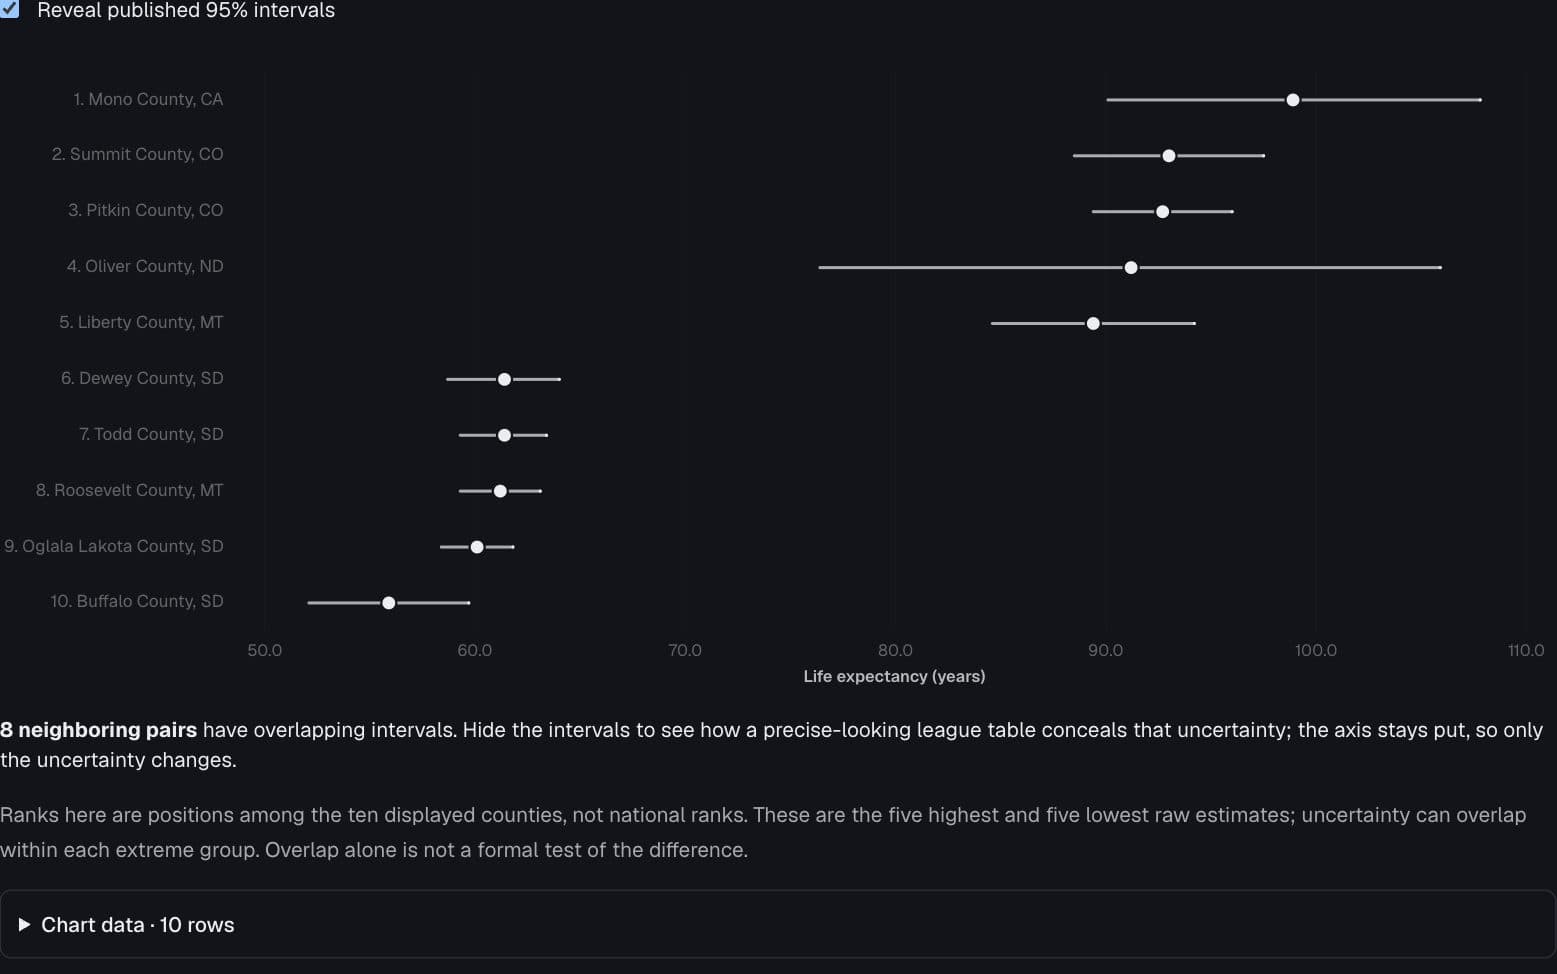
8 neighboring pairs have overlapping intervals. Hide the intervals to see how a precise-looking league table conceals that uncertainty; the axis stays put, so only the uncertainty changes.
Ranks here are positions among the ten displayed counties, not national ranks. These are the five highest and five lowest raw estimates; uncertainty can overlap within each extreme group. Overlap alone is not a formal test of the difference.
Chart data · 10 rows
| County | Estimate | Lower 95% | Upper 95% | Population |
|---|---|---|---|---|
| Mono County, CA | 98.9 | 90.1 | 107.8 | 12,978 |
| Summit County, CO | 93 | 88.5 | 97.5 | 30,565 |
| Pitkin County, CO | 92.7 | 89.4 | 96 | 16,876 |
| Oliver County, ND | 91.2 | 76.4 | 105.9 | 1,856 |
| Liberty County, MT | 89.4 | 84.6 | 94.2 | 1,972 |
| Dewey County, SD | 61.4 | 58.7 | 64 | 5,140 |
| Todd County, SD | 61.4 | 59.3 | 63.4 | 9,220 |
| Roosevelt County, MT | 61.2 | 59.3 | 63.1 | 10,572 |
| Oglala Lakota County, SD | 60.1 | 58.4 | 61.8 | 13,519 |
| Buffalo County, SD | 55.9 | 52.1 | 59.7 | 1,861 |
Page 1 of 1
CHR 2024 v147 with published 95% CIs; the five highest and five lowest raw estimates among counties reporting intervals.
County Health Rankings & Roadmaps 2024, UW Population Health Institute
Preview
How to read it
Compare the same rank order with and without whiskers; the domain stays fixed in both views.
When to use it
Published league tables and extreme rankings with measured uncertainty.
Watch out for
Use the reveal control: a precise-looking ordering becomes a set of overlapping intervals. Overlap is a warning, not a formal pairwise test.
Data shape & units
{ label, estimate, lo, hi }[]; estimates and bounds share units. ForestPlot sorts and numbers the rows, and keeps the bounds in its domain while they are hidden.
Missing values
Missing intervals must not become zero-width whiskers. Label ranks as positions among the selected rows.
Controls & accessibility
Toggle intervals to see the failure mode directly. Exact values are available in the table.
Use the component
Install from the CTZN registry, then pass your prepared rows. Examples below illustrate the component contract.
npx shadcn add @ctzn-viz/forest-plot<ForestPlot data={rows} sort="descending" rankLabels
showIntervals={revealed} reference={null}
ariaLabel="County rankings and uncertainty" />