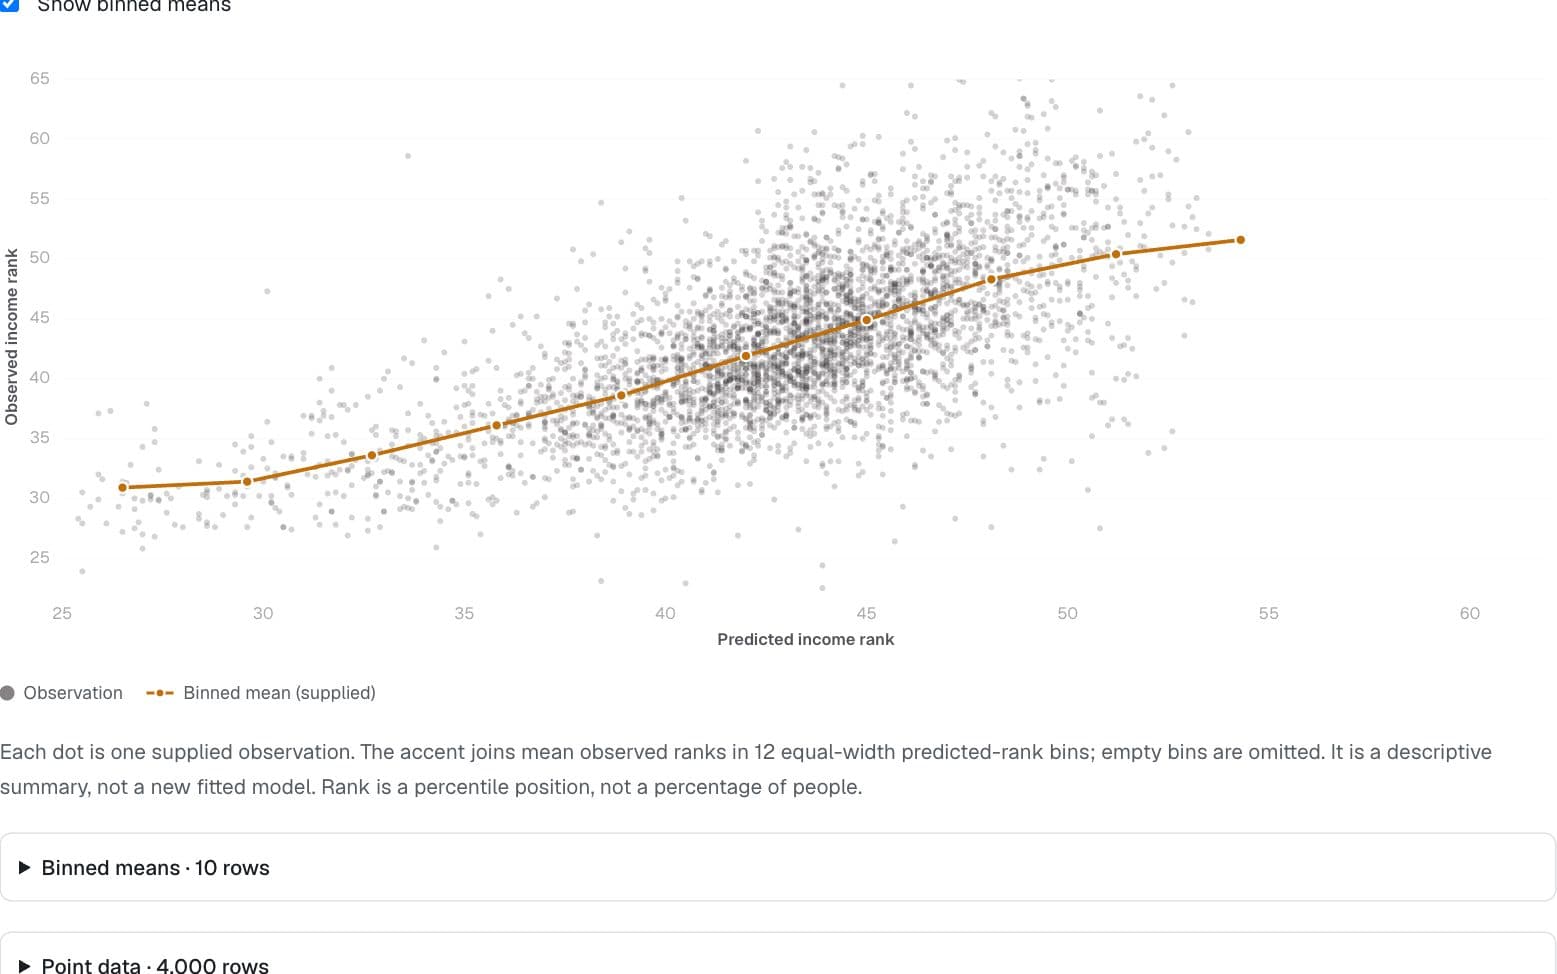
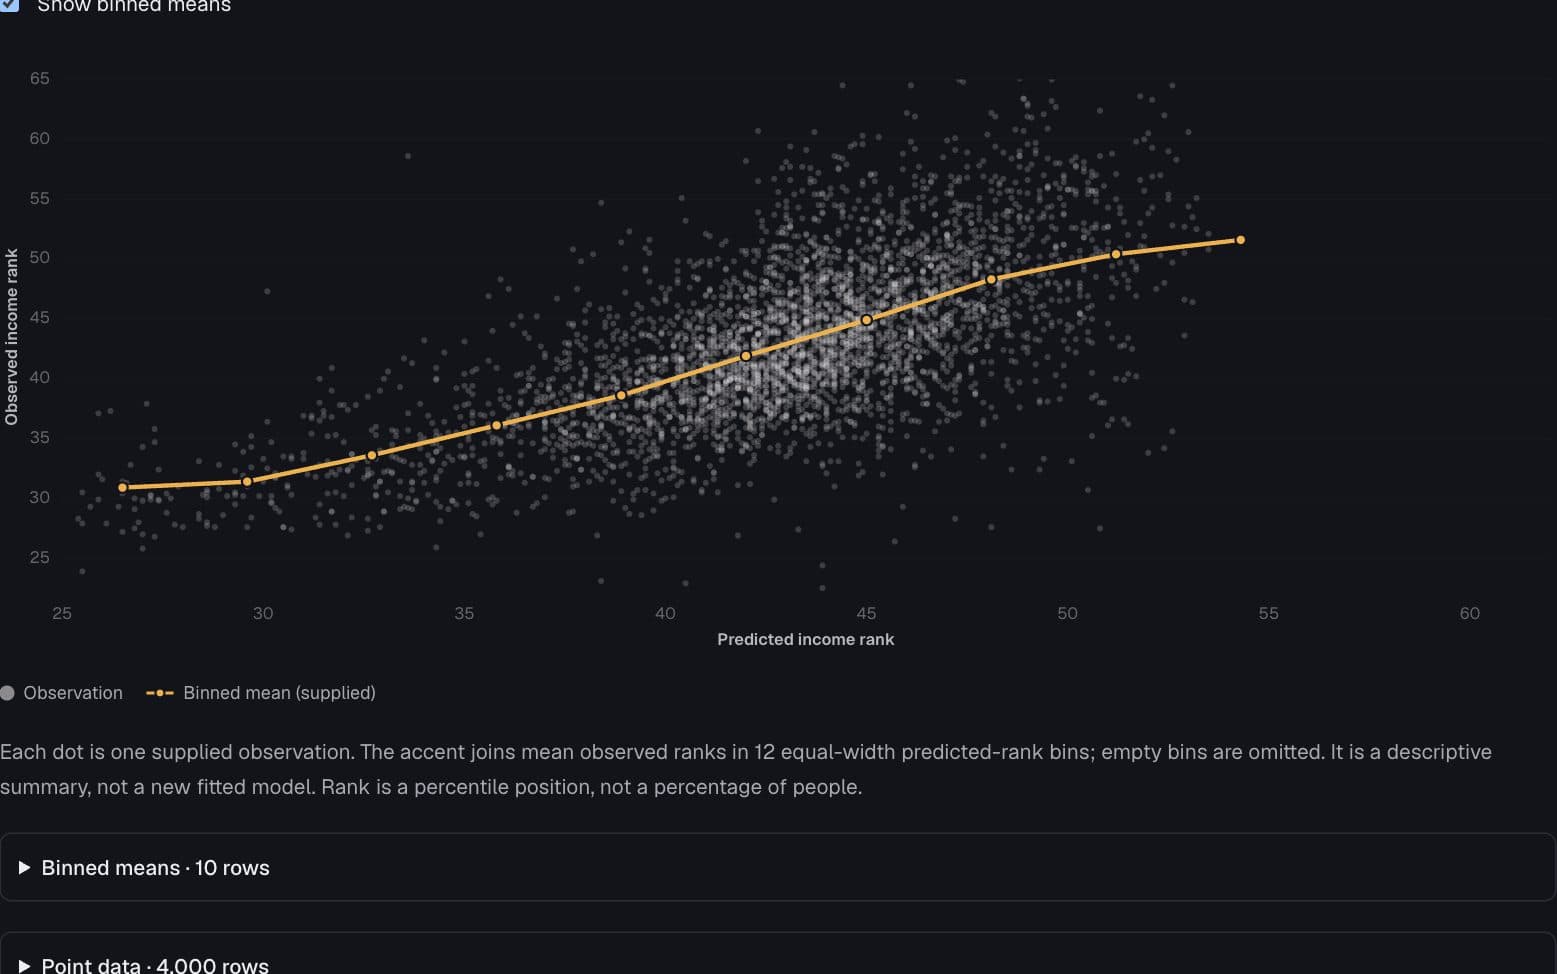
Scatter with binned summary
Keep the observations visible while revealing their local average relationship.
- Observation
- Binned mean (supplied)
Each dot is one supplied observation. The accent joins mean observed ranks in 12 equal-width predicted-rank bins; empty bins are omitted. It is a descriptive summary, not a new fitted model. Rank is a percentile position, not a percentage of people.
Binned means · 10 rows
| Predicted rank (bin center) | Mean observed rank |
|---|---|
| 26.5 | 30.9 |
| 29.6 | 31.4 |
| 32.7 | 33.6 |
| 35.8 | 36.1 |
| 38.9 | 38.6 |
| 42 | 41.9 |
| 45 | 44.9 |
| 48.1 | 48.3 |
| 51.2 | 50.4 |
| 54.3 | 51.6 |
Page 1 of 1
Point data · 4,000 rows
| Predicted rank | Observed rank |
|---|---|
| 40.4 | 40.5 |
| 42.8 | 38.9 |
| 45.4 | 48.1 |
| 33.9 | 37.9 |
| 37.5 | 43 |
| 43.5 | 39.3 |
| 49.9 | 51.2 |
| 44.8 | 43.8 |
| 43 | 39 |
| 37 | 41.8 |
| 49 | 47.9 |
| 46.6 | 33.5 |
| 45.1 | 46 |
| 42.6 | 50.1 |
| 42.5 | 44.9 |
| 44.3 | 44 |
| 44.2 | 40.2 |
| 48.1 | 27.6 |
| 48.9 | 60.7 |
| 47.7 | 46 |
Page 1 of 200
Opportunity Atlas × ACS · captured beat-the-model chart aggregates
Preview
How to read it
Dots show observations. The accent line joins supplied bin means; its x positions are bin centers, not individual observations.
When to use it
Dense relationships where a single fitted straight line would hide local departures.
Watch out for
Bin choice can change the apparent pattern. Do not call a binned mean a regression or interpret prediction-versus-outcome plots as validation without knowing how the model was evaluated.
Data shape & units
data: { x, y, label? }[], plus a line overlay { kind: "line", data: { x, y }[], markers: true } holding the supplied bin means. Explicit xDomain and yDomain keep comparisons stable.
Missing values
Remove invalid coordinates. The supplied mobility example omits empty bins and connects remaining centers; no counts or uncertainty are invented.
Controls & accessibility
Toggle the supplied summary. The associated data tables expose the points and the exact binned values independently.
Use the component
Install from the CTZN registry, then pass your prepared rows. Examples below illustrate the component contract.
npx shadcn add @ctzn-viz/scatter-regression<ScatterRegression data={points} fit="none"
overlays={[{ kind: "line", label: "Binned mean",
data: bins, tone: "accent", markers: true }]}
xDomain={[25, 62]} yDomain={[22, 65]}
xLabel="Predicted rank" yLabel="Observed rank"
ariaLabel="Predicted and observed income rank" />