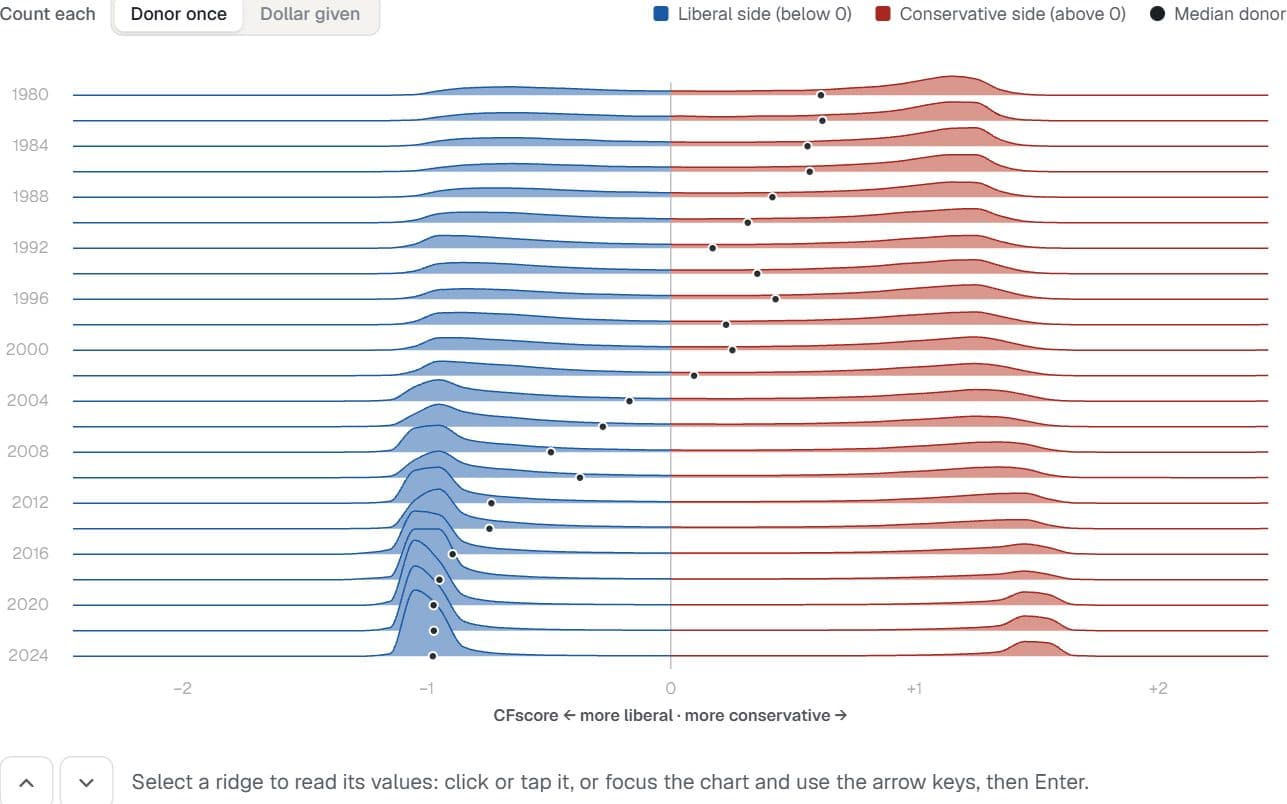
Counties sorted into landslides
Between 1976 and 2024, did counties drift apart gradually or sort into landslides — and how far did the county map part from the national vote?
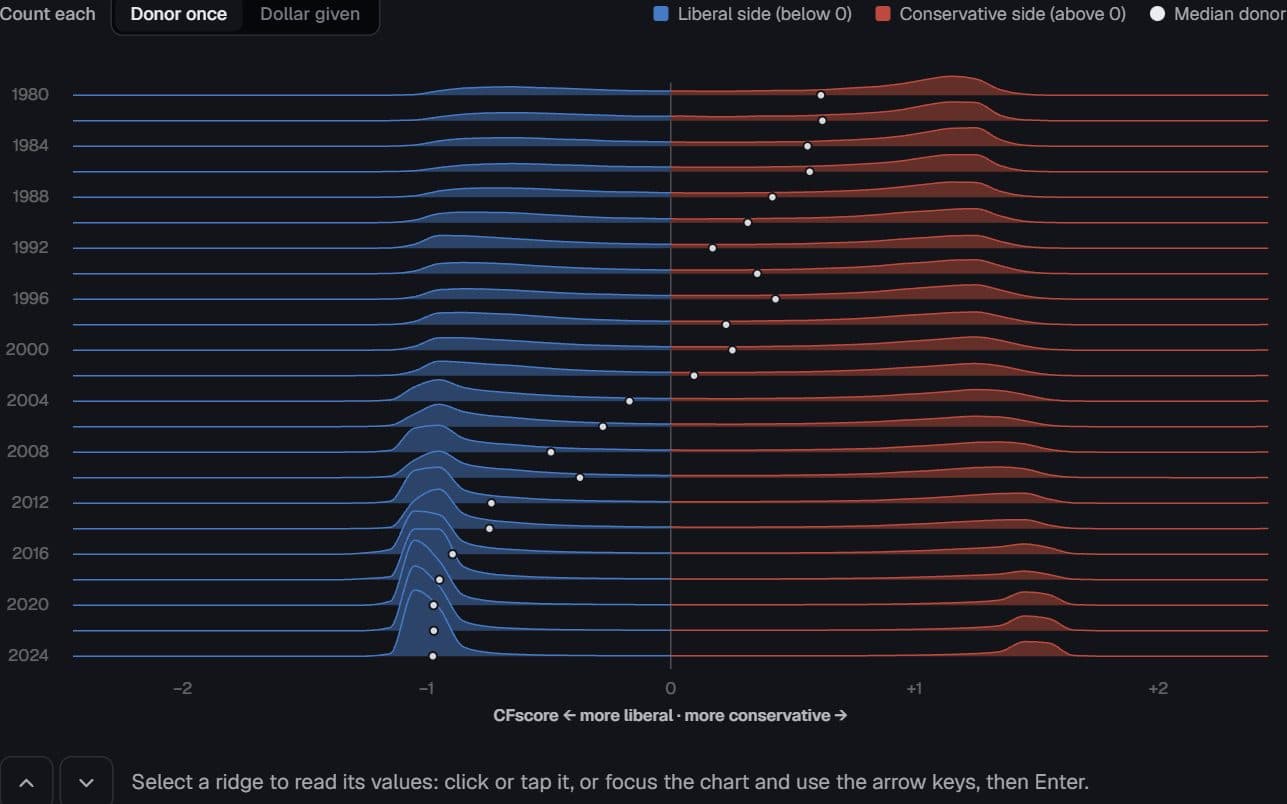
Share of counties at each margin, one ridge per presidential election, every county counted once. Red falls left of an even split, blue right; the dot on each baseline is the national popular-vote margin.
Select an election to read its counties.
Chart data · 13 rows
| Election | Counties | National margin | Median county | Counties won by 20+ points |
|---|---|---|---|---|
| 1,976 | 3,104 | D+2.1 | D+2.0 | 38% |
| 1,980 | 3,106 | R+9.7 | R+14.0 | 51% |
| 1,984 | 3,108 | R+18.2 | R+27.0 | 66% |
| 1,988 | 3,107 | R+7.7 | R+14.0 | 45% |
| 1,992 | 3,108 | D+5.6 | Even | 27% |
| 1,996 | 3,107 | D+8.5 | R+1.0 | 33% |
| 2,000 | 3,112 | D+0.5 | R+17.2 | 51% |
| 2,004 | 3,113 | R+2.5 | R+22.5 | 60% |
| 2,008 | 3,113 | D+7.3 | R+16.0 | 55% |
| 2,012 | 3,113 | D+3.9 | R+23.6 | 64% |
| 2,016 | 3,112 | D+2.1 | R+38.0 | 78% |
| 2,020 | 3,112 | D+4.5 | R+38.5 | 77% |
| 2,024 | 3,113 | R+1.5 | R+40.3 | 78% |
Political history almanac · county presidential returns and national margins, 1976–2024
Reading notes
Every county counts once, whatever its population, so the ridges describe the map rather than the vote: most counties can lean Republican in a year the Democrat wins the popular vote, because Democratic votes are packed into fewer, larger counties. Margins are Democratic minus Republican in points, in four-point bins; a county with no reported return that year is left out, not counted as a tie.
Source & method
Political history almanac · county presidential returns and national margins, 1976–2024
Existing CTZN Viz reference fixture: 21-county-margins.json. This example reuses the captured values; no fresh source retrieval is implied.