Society & world values
Explore mobility, development, and the dimensions that connect social attitudes.
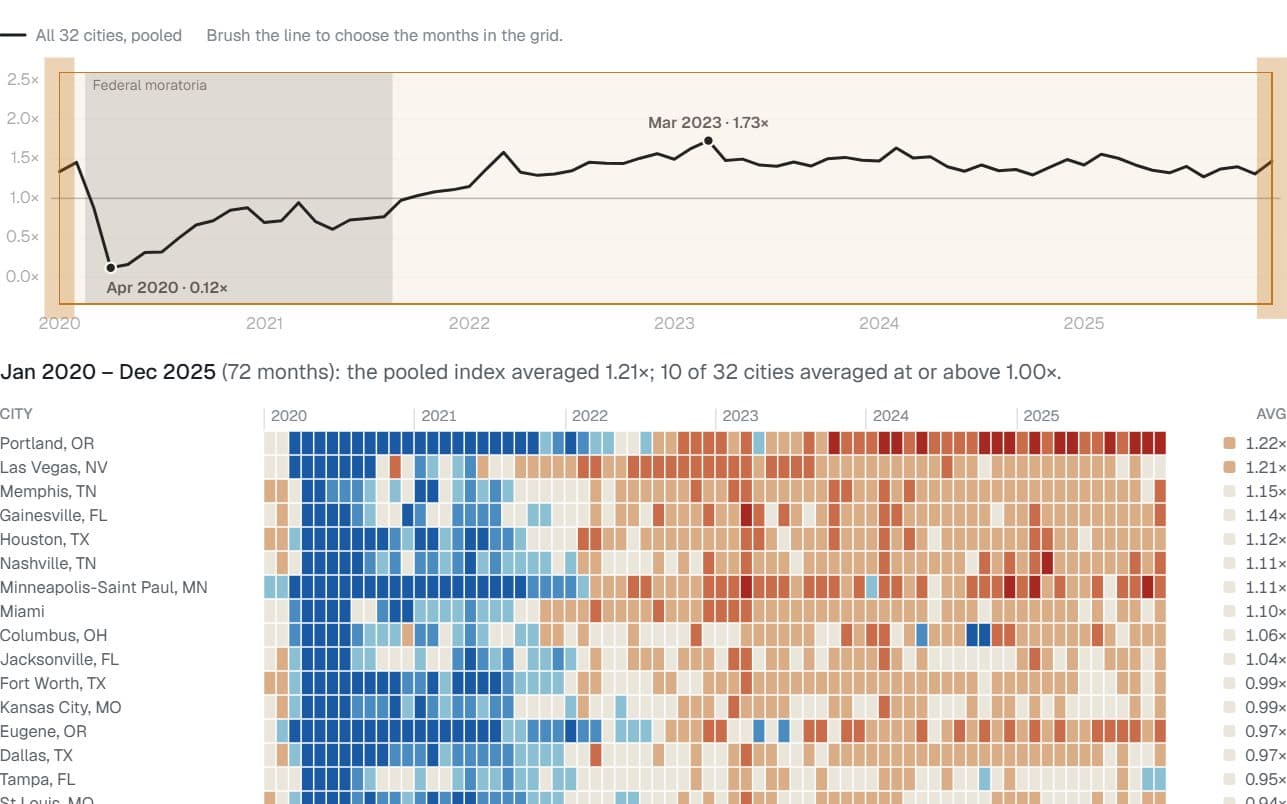
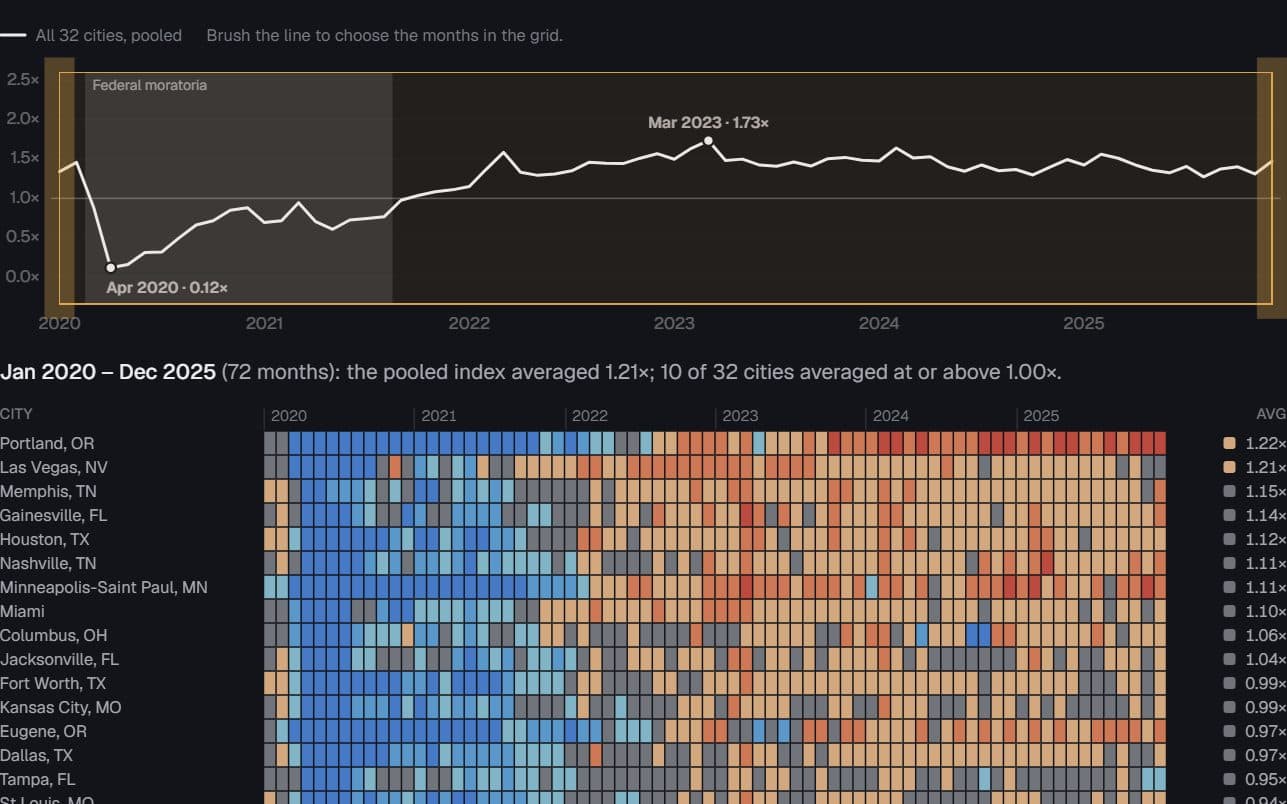
32 US cities · Eviction Lab filings, 2020–2025
Filings froze, then overshot
When did each city’s eviction filings fall below, and later climb past, its own pre-pandemic normal?
Hides: Comparable rates. Each city is measured against its own baseline, so a high index can mean a low baseline.
Try it: Select months on the timeline
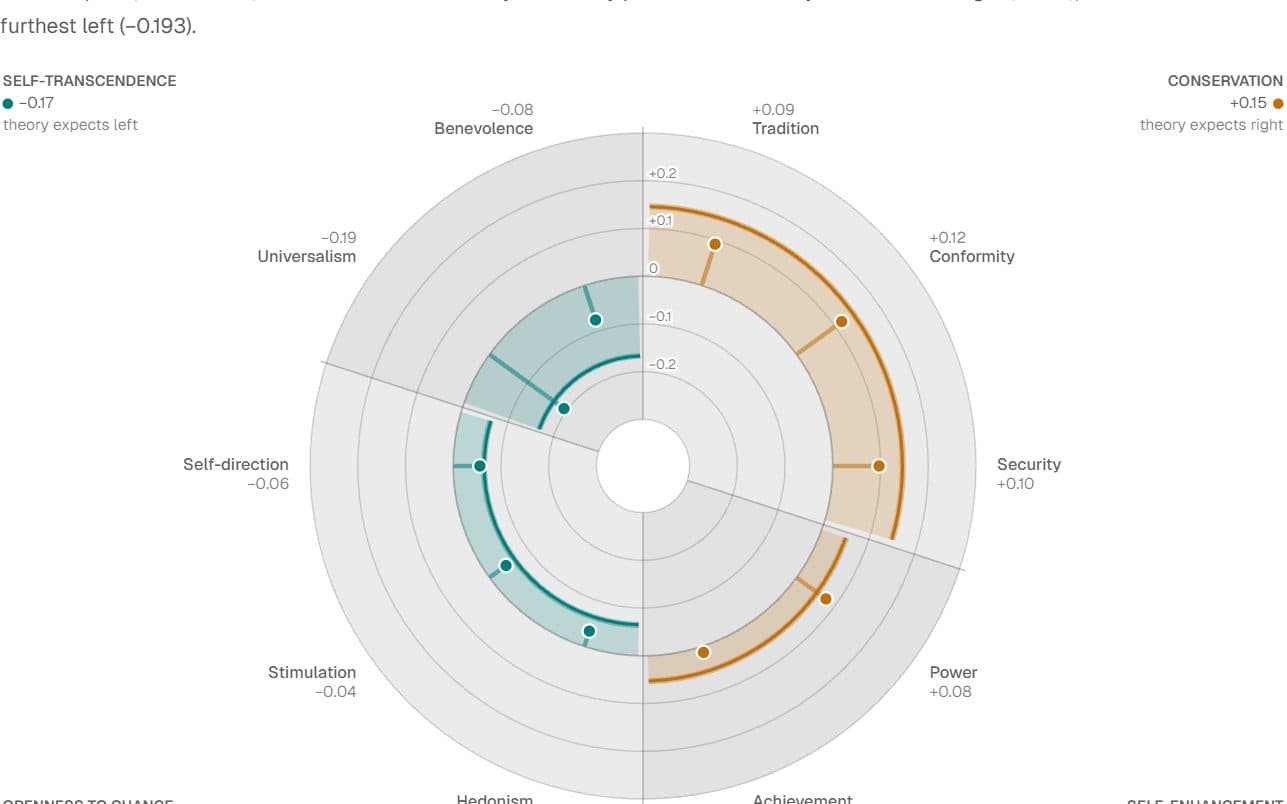
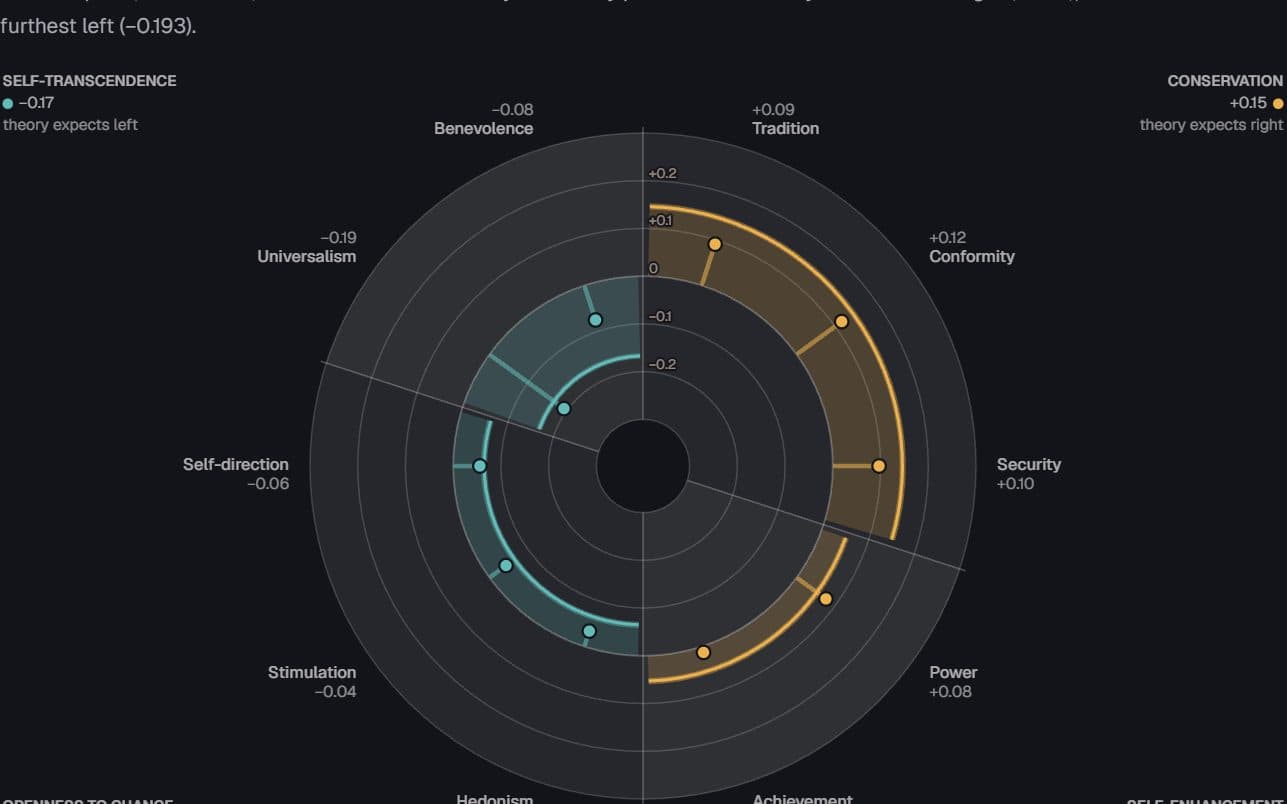
European countries · European Social Survey, 2002–2020
The value circle splits left from right — in the West
Which basic values go with placing yourself on the right or the left, and does the pattern hold in post-communist Europe?
Hides: Party or cause. These are associations with left–right self-placement, and the angles come from theory, not data.
Try it: Pick a country
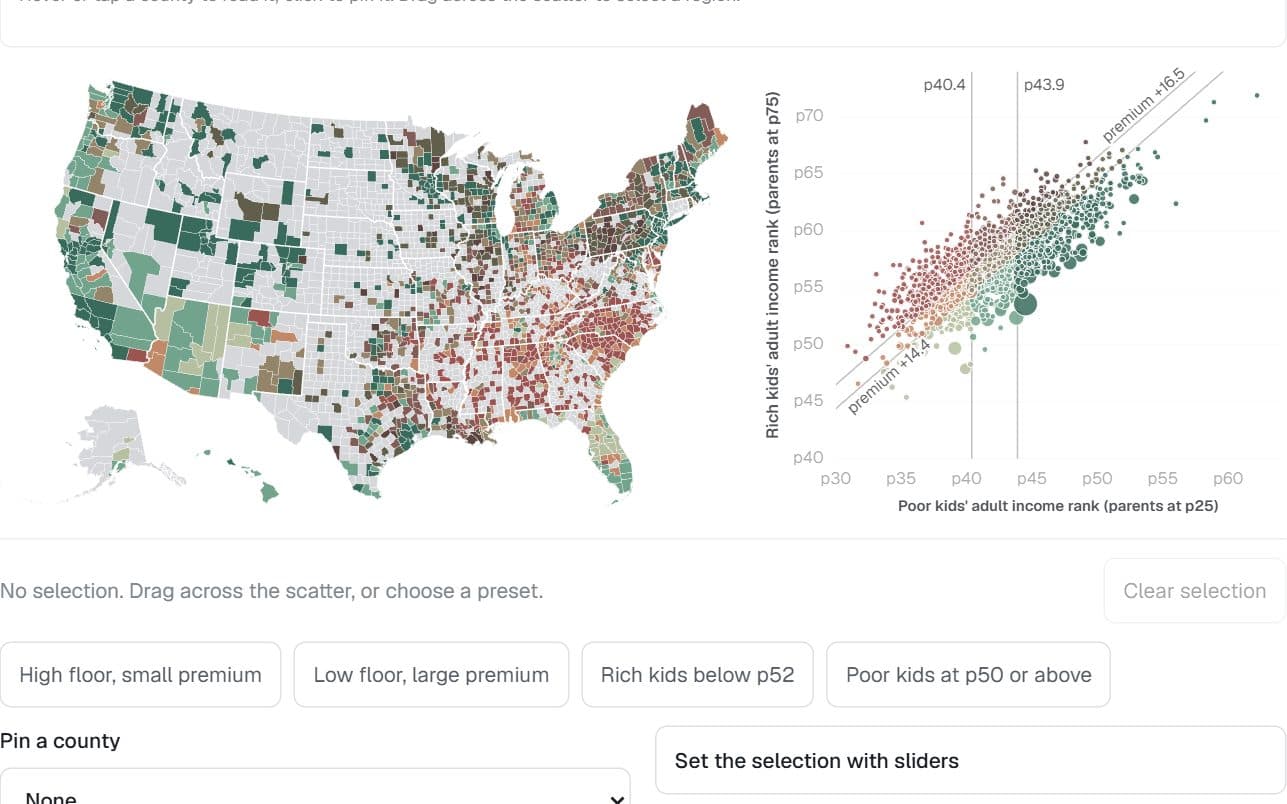
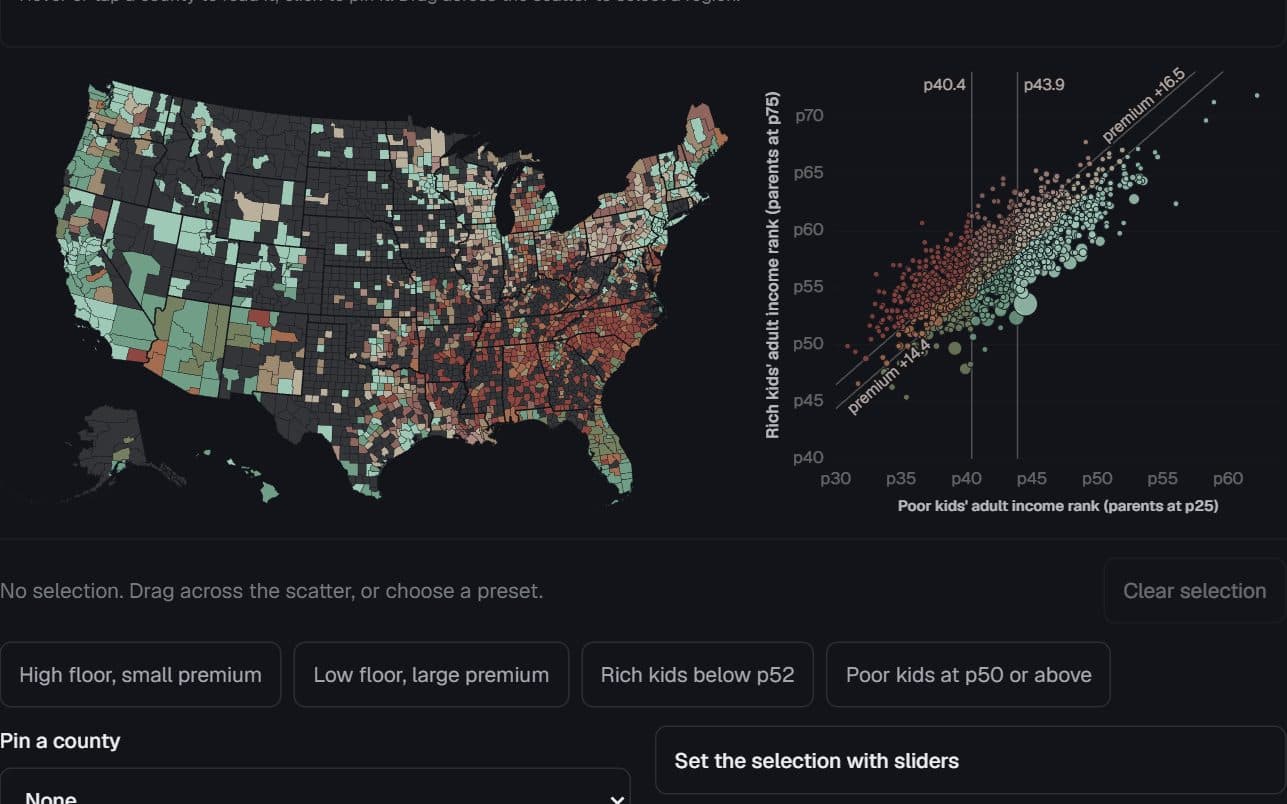
1,581 US counties · Opportunity Atlas, children born 1978–83
Where birth buys the most
Where does a comfortable birth buy the most extra adult income — and is a small premium good news?
Hides: What place does on its own. Effects of place are mixed with who lives there.
Try it: Select counties on the scatter
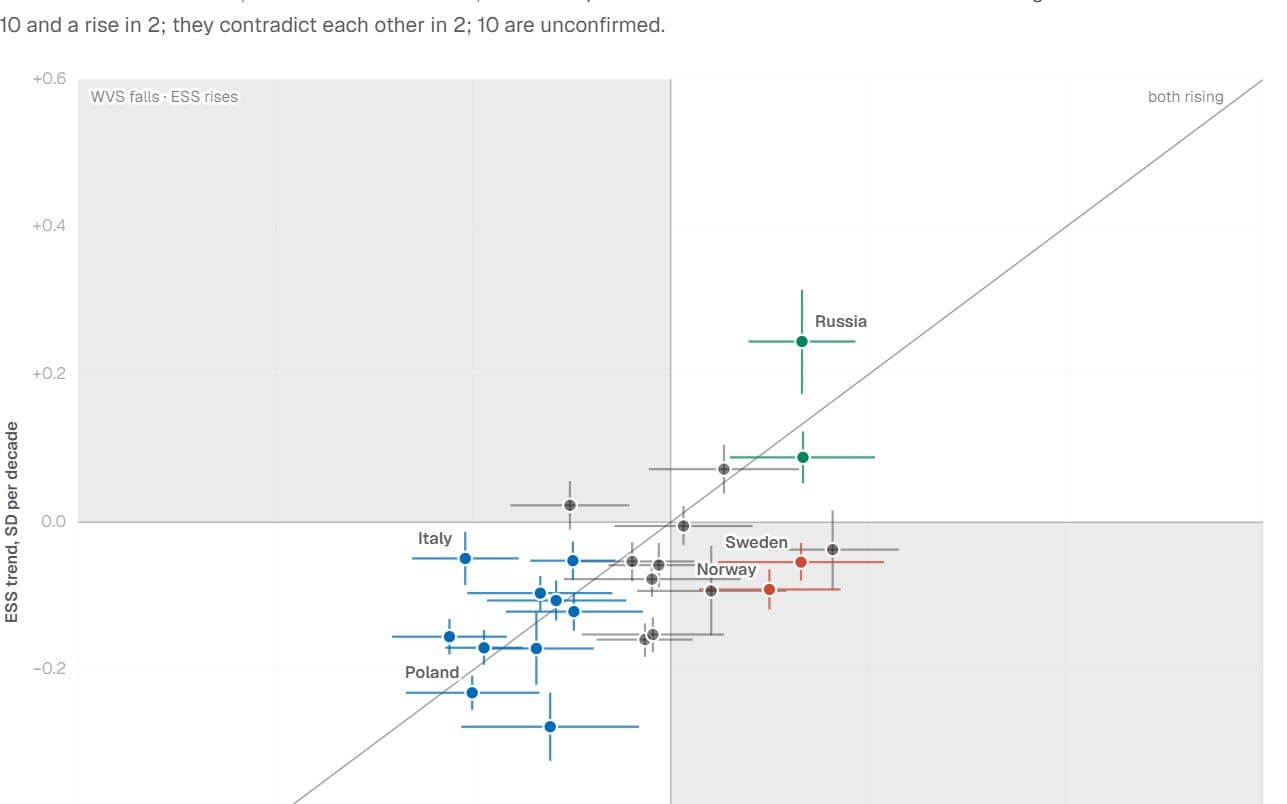
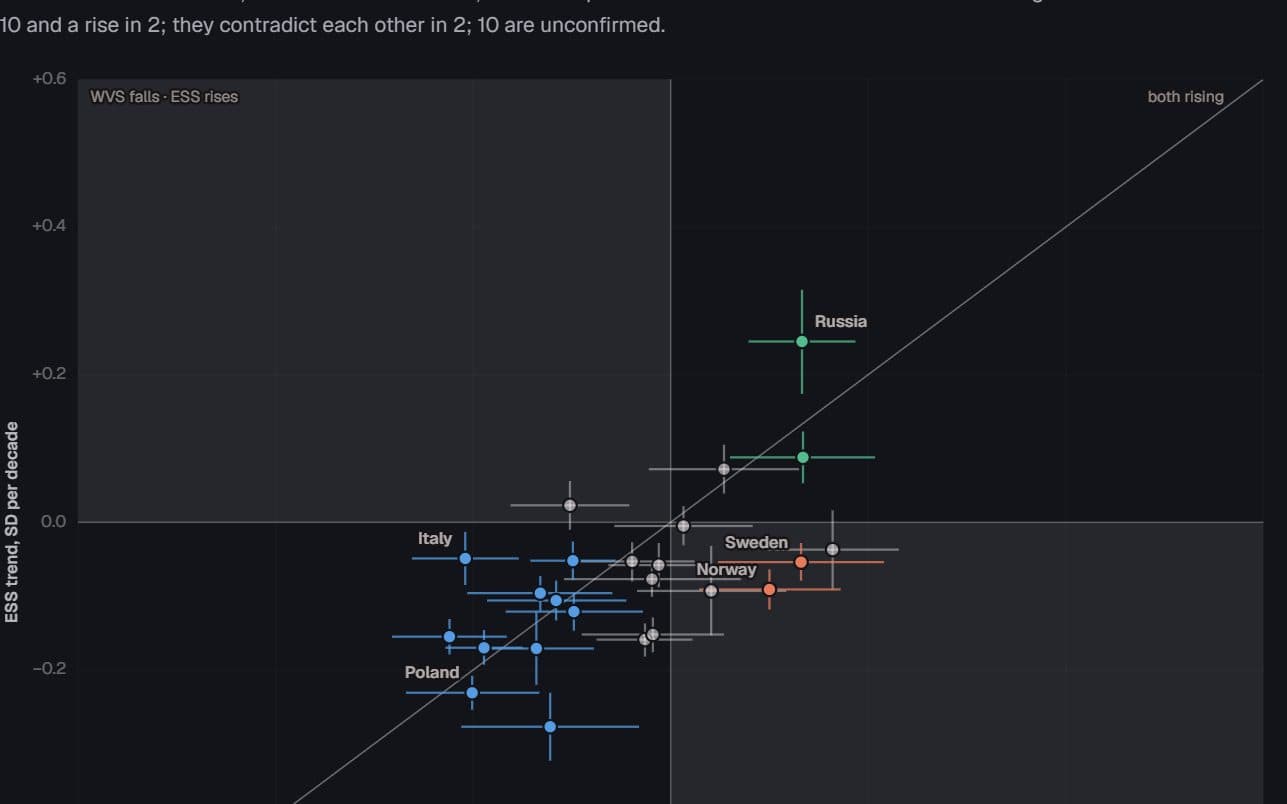
European countries · World/European Values Study and European Social Survey
Two instruments, one trend?
When two major surveys measure the same country, do they see religion changing in the same direction?
Hides: A pooled estimate. Each survey is analysed on its own, and the two are compared country by country.
Try it: Switch the trend compared
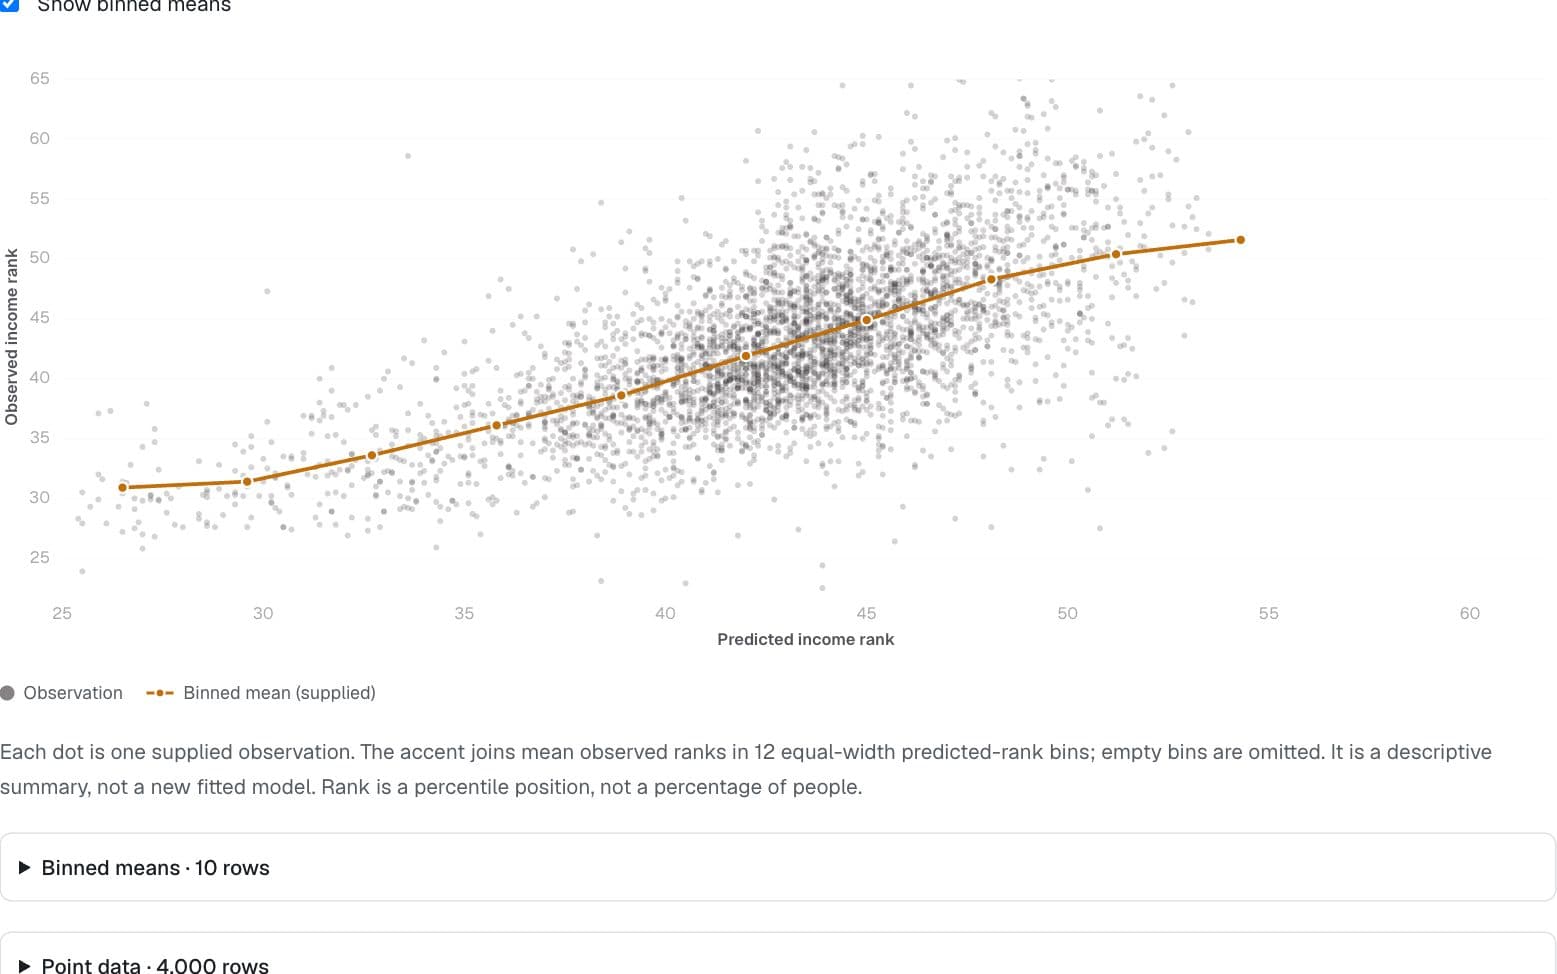
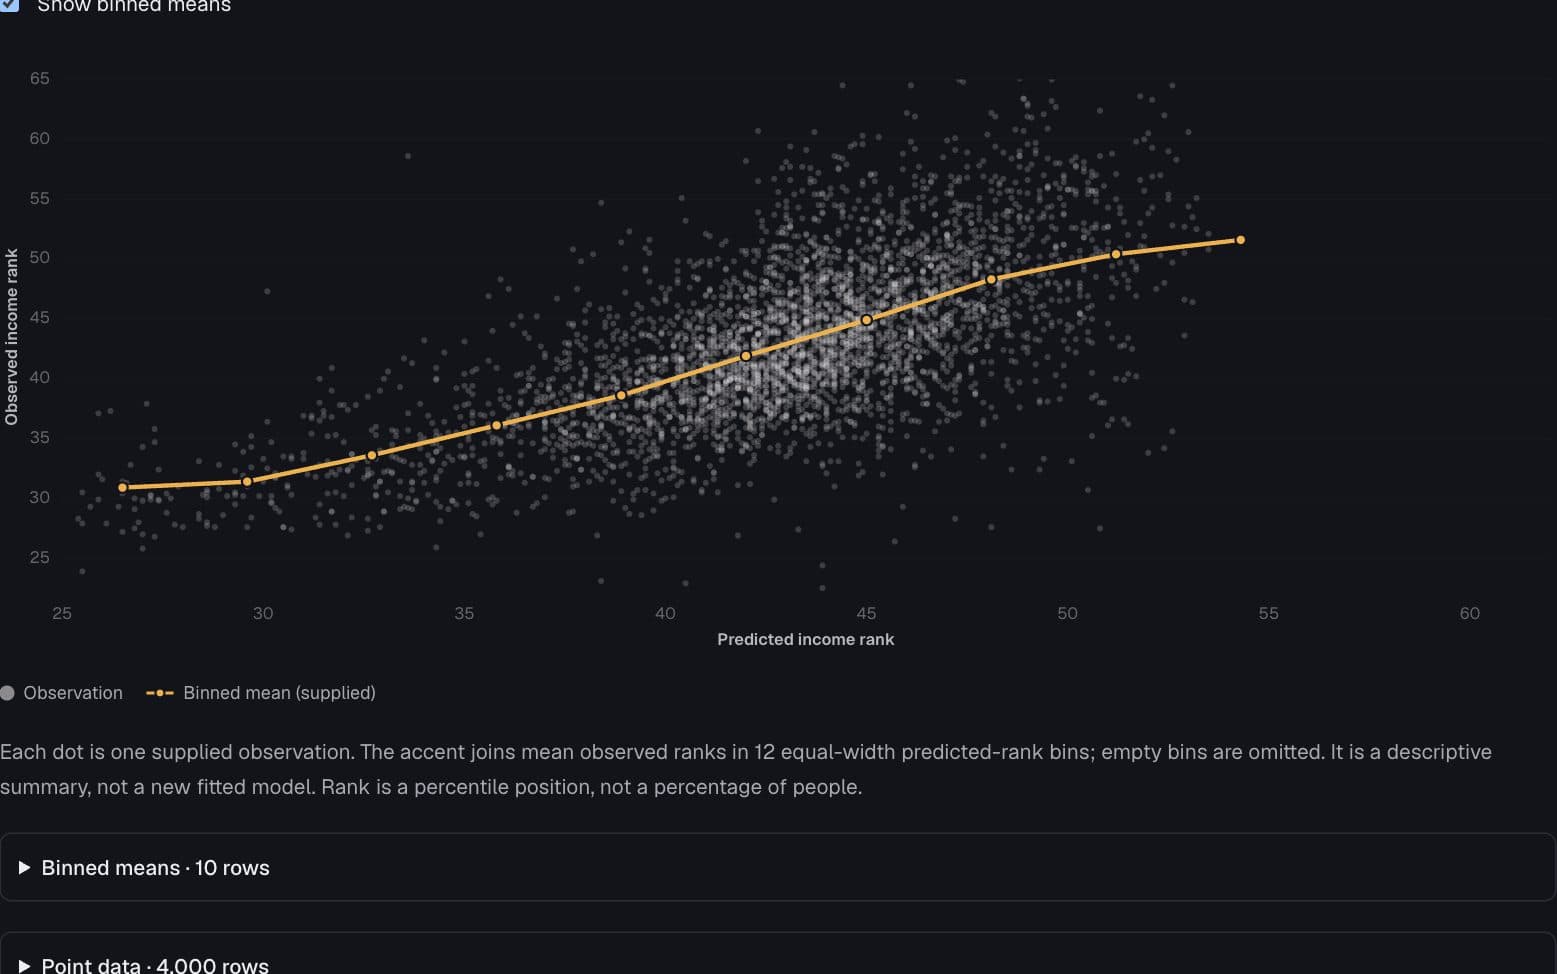
Opportunity Atlas × ACS
What the point cloud leaves hidden
Where do predicted and observed income ranks diverge?
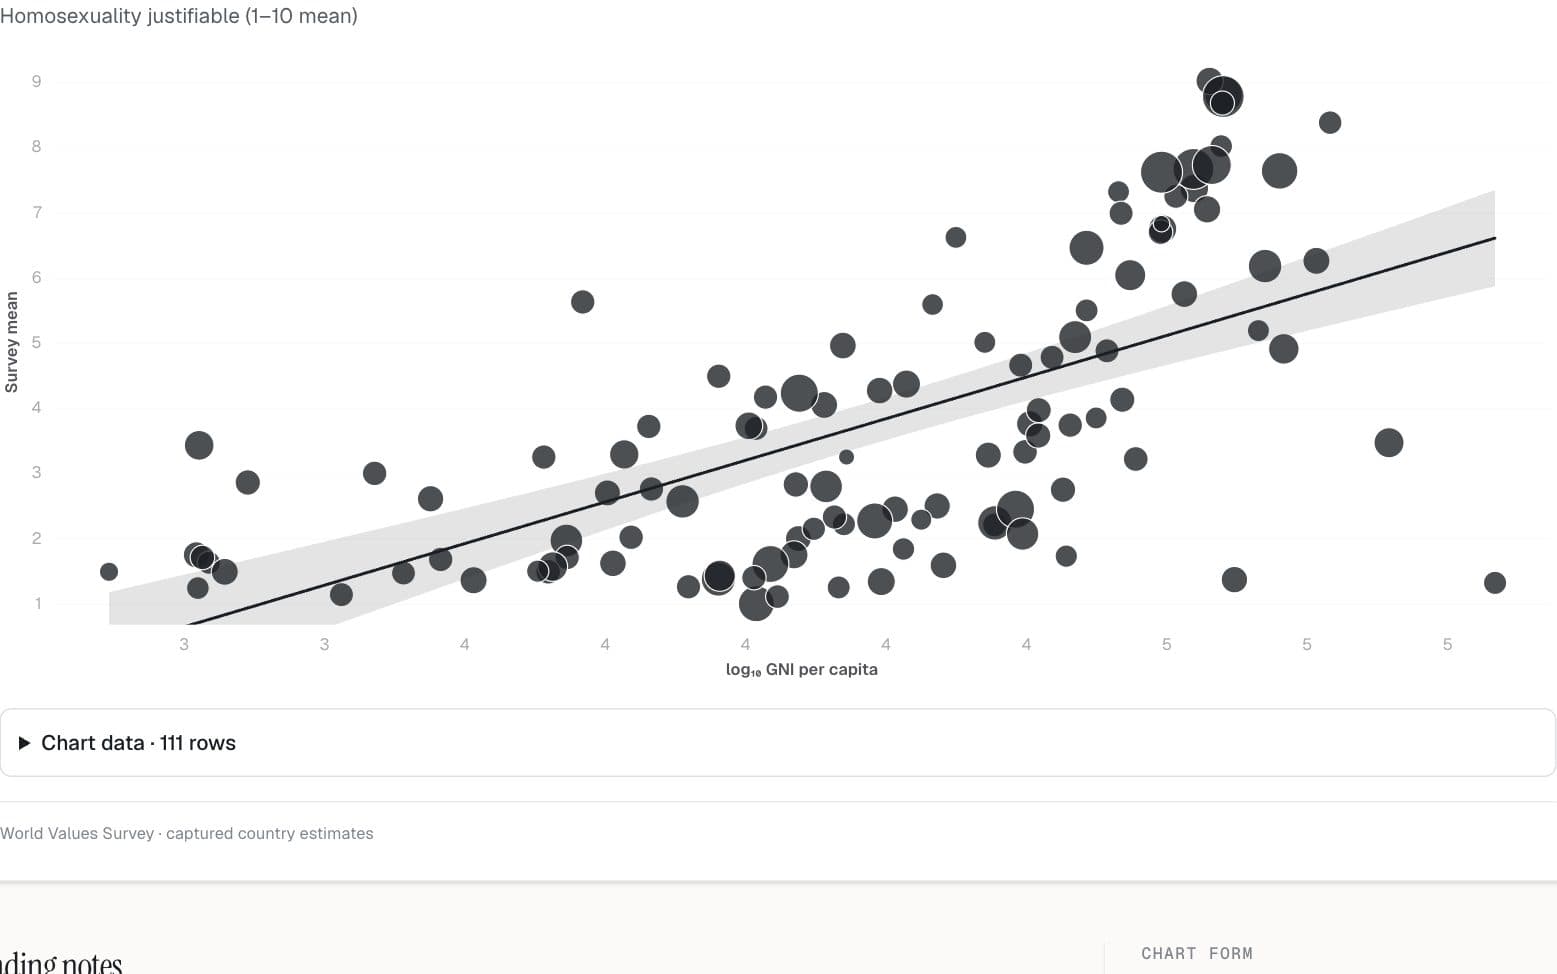
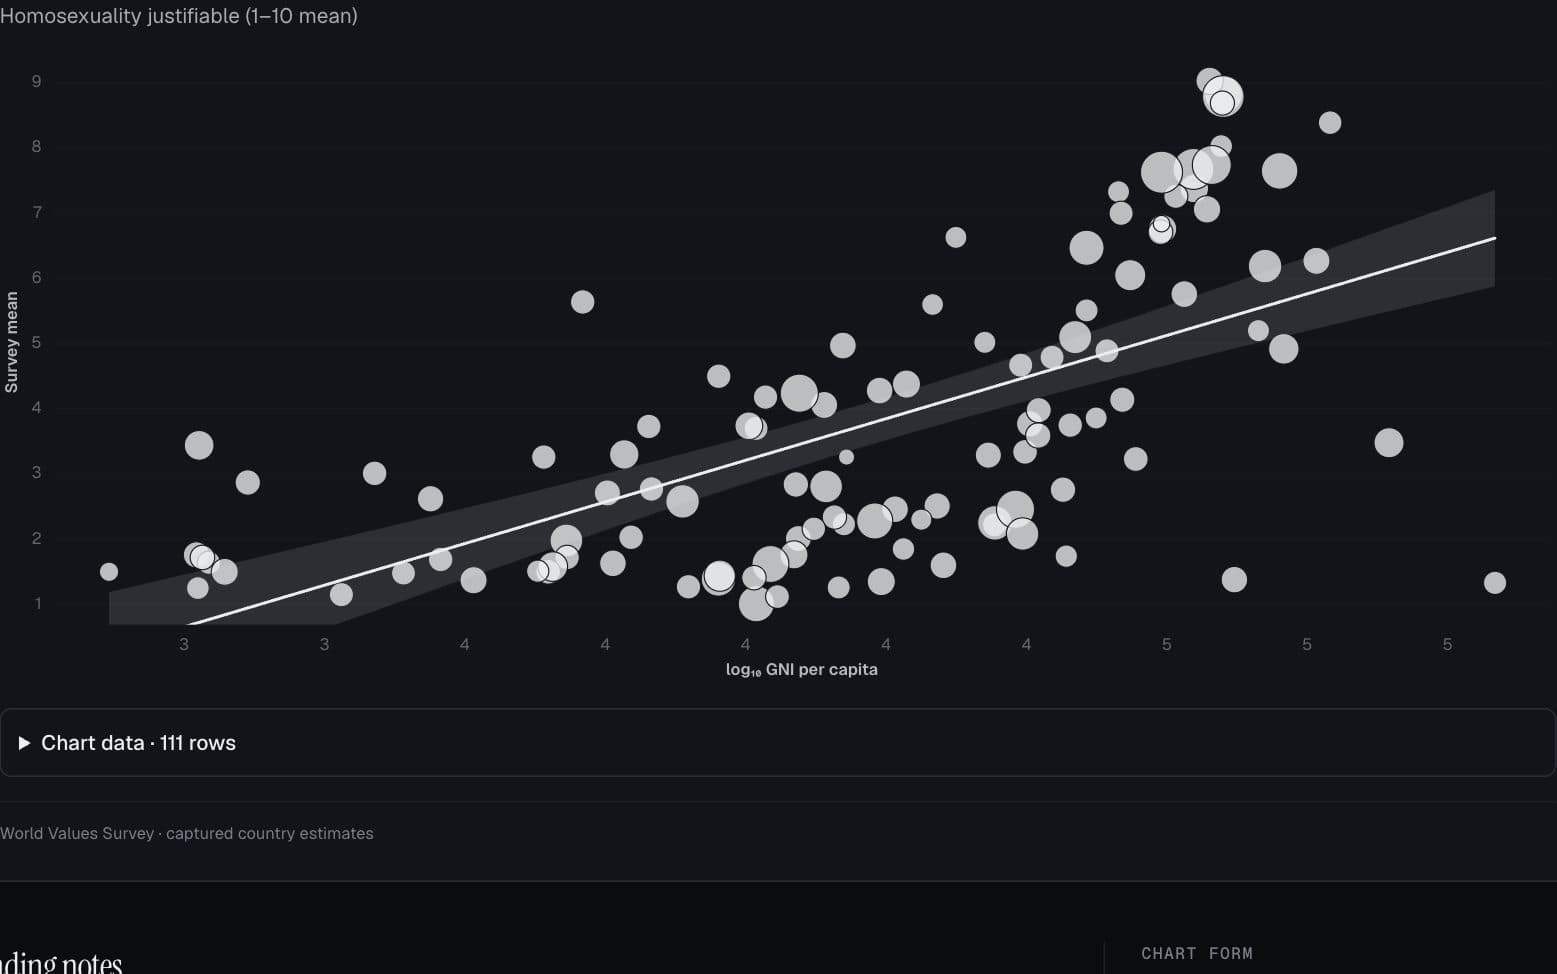
World Values Survey
Values and economic development
How do country-level attitudes vary with national income?
Longer pages on society & world values
Several figures together, with the components that draw them. These open in the component documentation.