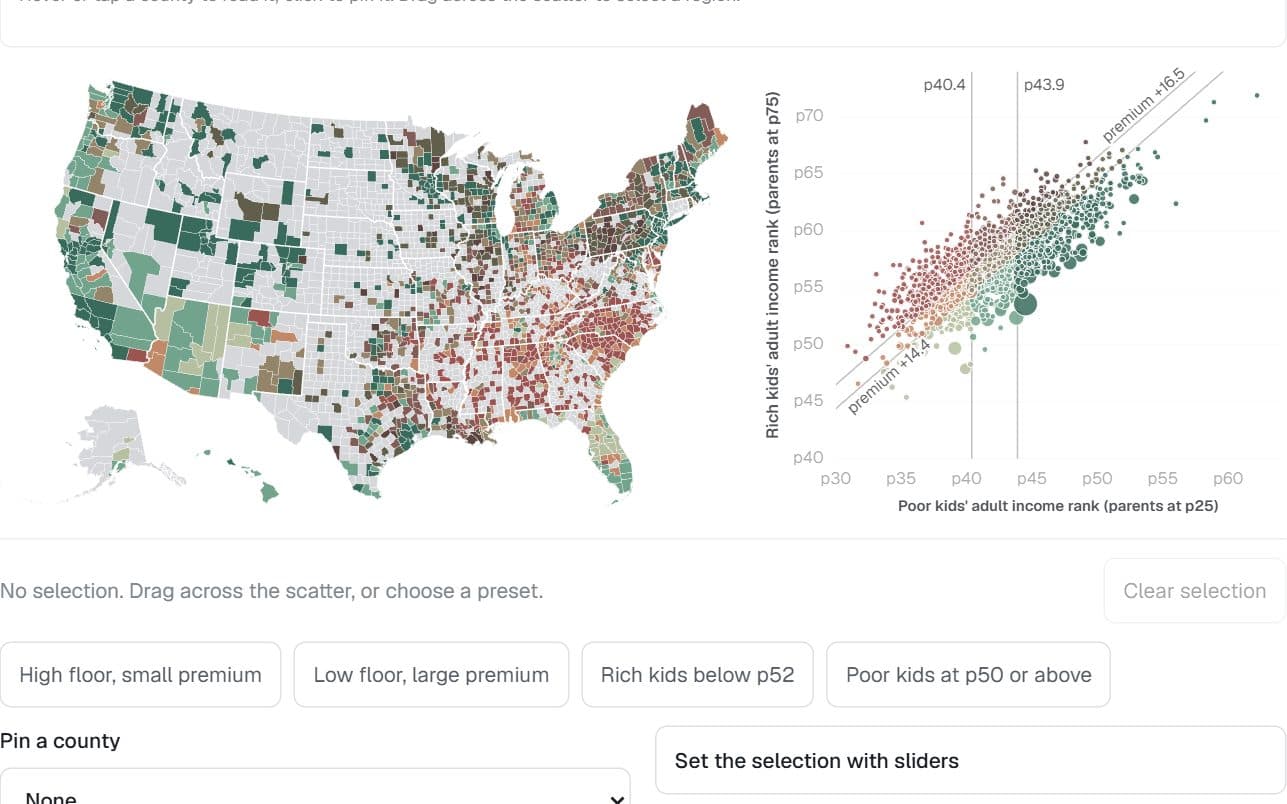
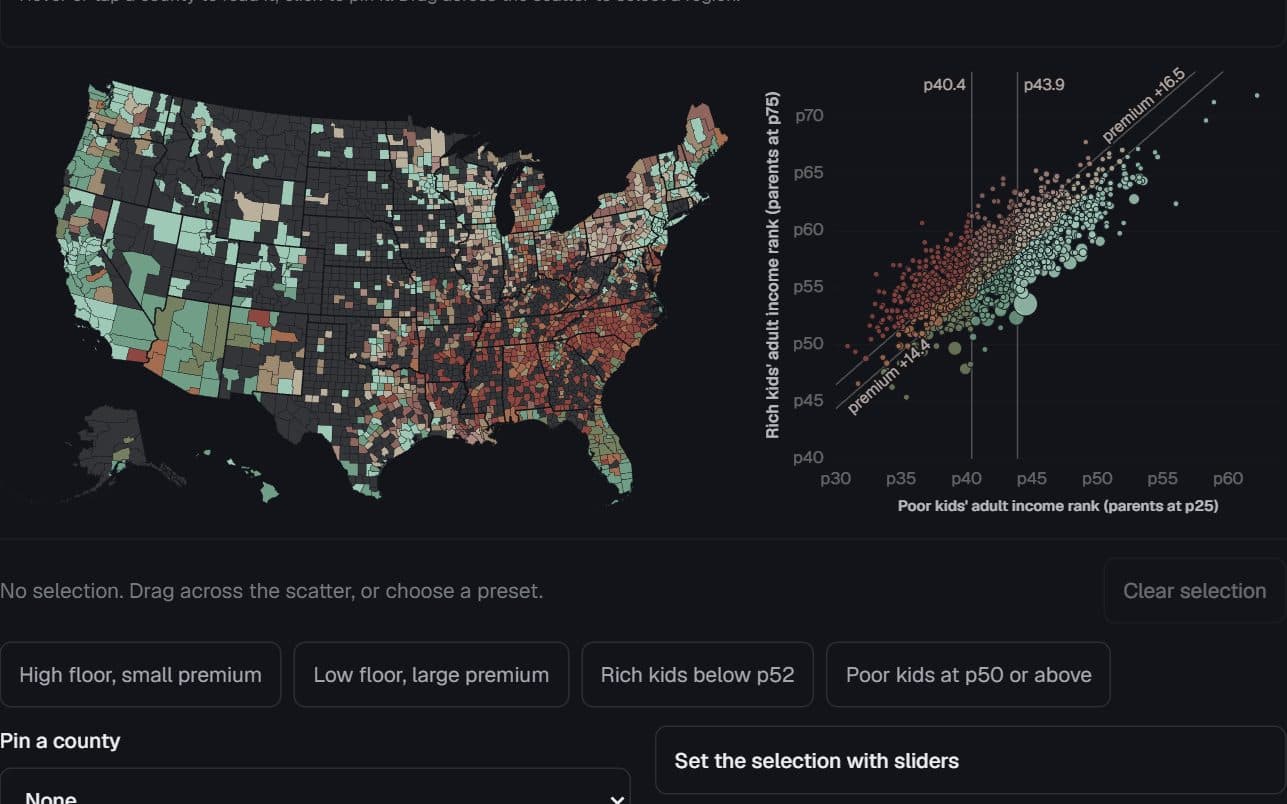
What the point cloud leaves hidden
Where do predicted and observed income ranks diverge?
- Observation
- Binned mean (supplied)
Each dot is one supplied observation. The accent joins mean observed ranks in 12 equal-width predicted-rank bins; empty bins are omitted. It is a descriptive summary, not a new fitted model. Rank is a percentile position, not a percentage of people.
Binned means · 10 rows
| Predicted rank (bin center) | Mean observed rank |
|---|---|
| 26.5 | 30.9 |
| 29.6 | 31.4 |
| 32.7 | 33.6 |
| 35.8 | 36.1 |
| 38.9 | 38.6 |
| 42 | 41.9 |
| 45 | 44.9 |
| 48.1 | 48.3 |
| 51.2 | 50.4 |
| 54.3 | 51.6 |
Point data · 4,000 rows
| Predicted rank | Observed rank |
|---|---|
| 40.4 | 40.5 |
| 42.8 | 38.9 |
| 45.4 | 48.1 |
| 33.9 | 37.9 |
| 37.5 | 43 |
| 43.5 | 39.3 |
| 49.9 | 51.2 |
| 44.8 | 43.8 |
| 43 | 39 |
| 37 | 41.8 |
| 49 | 47.9 |
| 46.6 | 33.5 |
| 45.1 | 46 |
| 42.6 | 50.1 |
| 42.5 | 44.9 |
| 44.3 | 44 |
| 44.2 | 40.2 |
| 48.1 | 27.6 |
| 48.9 | 60.7 |
| 47.7 | 46 |
Opportunity Atlas × ACS · captured beat-the-model chart aggregates
Reading notes
The source provides rounded points and binned means without observation identifiers or model diagnostics. The display cannot establish out-of-sample predictive accuracy.
Source & method
Opportunity Atlas × ACS · captured beat-the-model chart aggregates
Unchanged Opportunity Atlas × ACS point cloud and supplied means. Source builder uses 12 equal-width predicted-rank bins over [25,62], clamps outliers into end bins, omits empty bins and rounds means to one decimal.
Capture provenance
- Source repository / file
- ctzn-pub / public/data/scatter-binned-example.json
- Revision
- 65774e3e2412742dab0b6209a4cb5c3b648ea8ff
- Captured
- 2026-09-11
- Source SHA-256
- 5053afc23eaedb7cd7f408f572c5ad6917b1bfaa46130ad652aba602185b3481
- Reuse note
- Aggregated public-facing example from the user-owned source repository. Upstream attribution retained; no new license asserted.