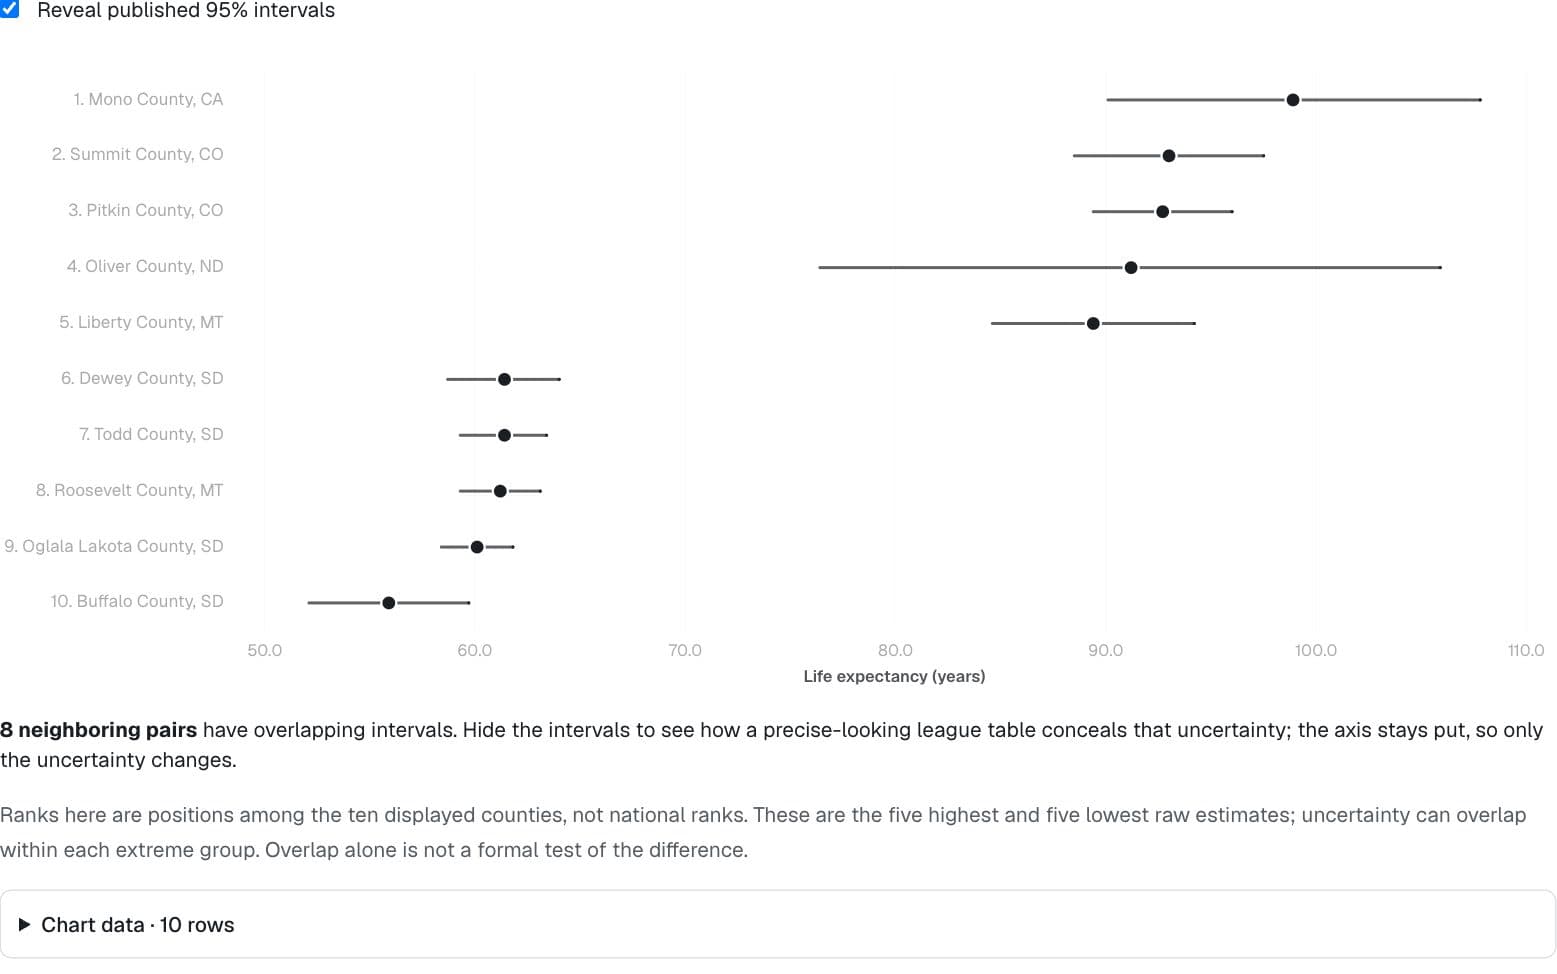
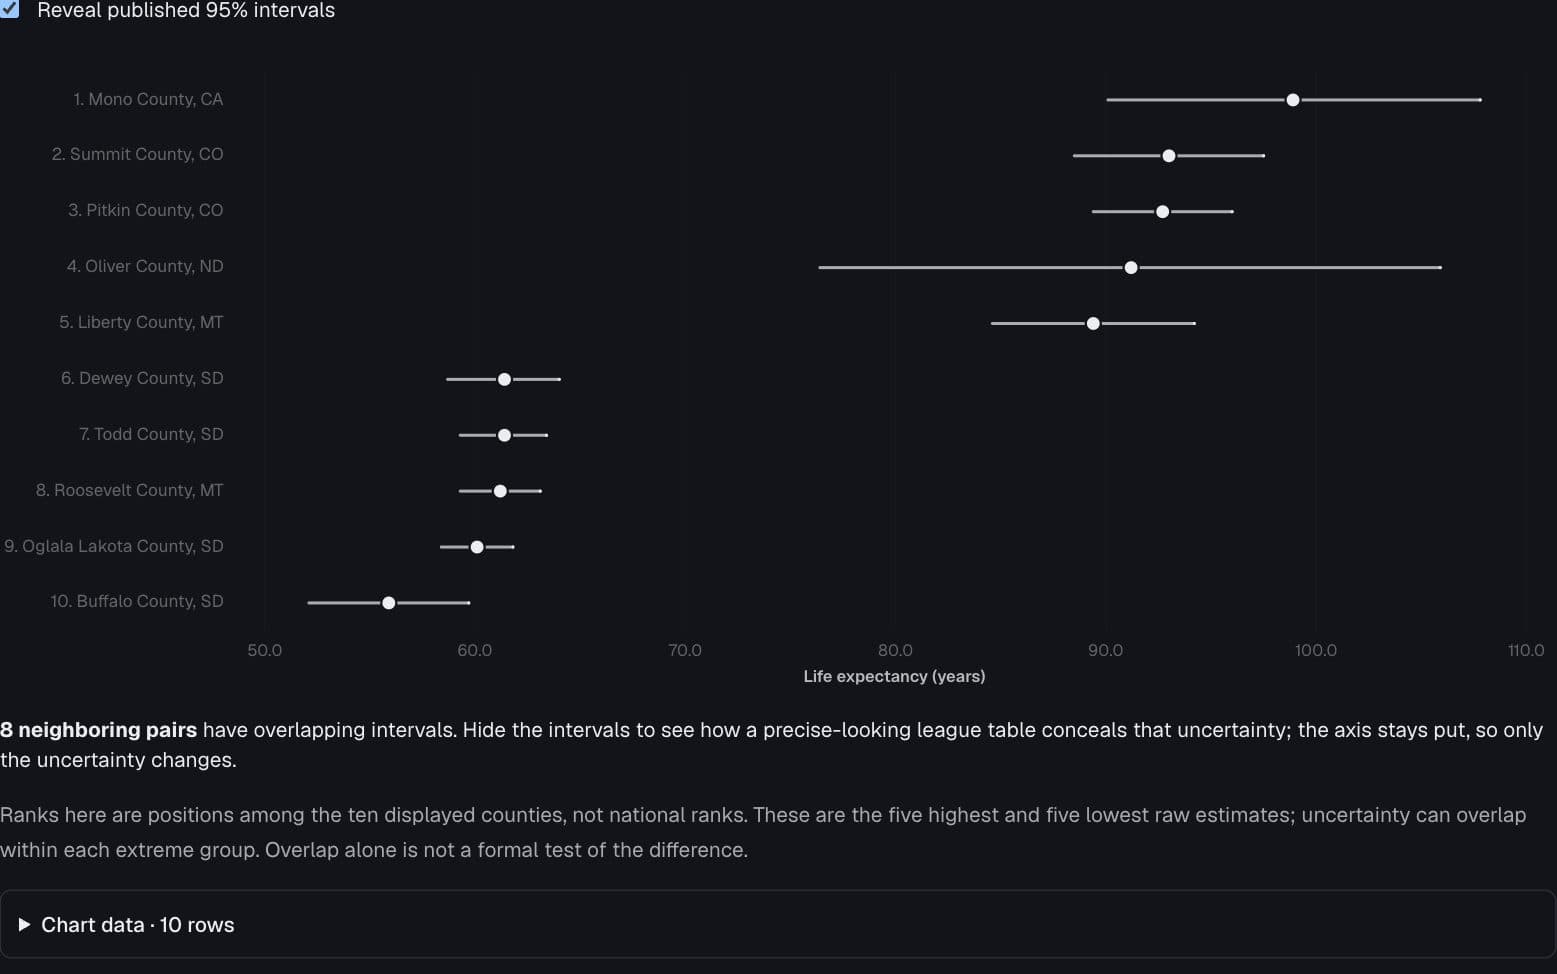
Obesity and diabetes, county by county
Does the association look similar in counties with different 2020 vote directions?
Chart data · 3,111 rows
| Obesity (%) | Diabetes (%) | Population | Vote direction |
|---|---|---|---|
| 38.1 | 11.5 | 25,864 | Republican-leaning |
| 37.4 | 10.4 | 16,582 | Republican-leaning |
| 37.2 | 11.2 | 27,214 | Republican-leaning |
| 38.7 | 11.2 | 44,631 | Republican-leaning |
| 39.8 | 14.7 | 25,549 | Republican-leaning |
| 33.6 | 8.7 | 35,482 | Democratic-leaning |
| 35.1 | 8.5 | 8,205 | Republican-leaning |
| 39.6 | 13.1 | 11,123 | Republican-leaning |
| 35.3 | 10.4 | 15,919 | Republican-leaning |
| 45 | 17.9 | 828,334 | Democratic-leaning |
| 33.3 | 9.9 | 31,197 | Republican-leaning |
| 32.1 | 8.8 | 101,324 | Republican-leaning |
| 37.8 | 12.6 | 17,936 | Republican-leaning |
| 32.9 | 8.6 | 16,478 | Republican-leaning |
| 28.9 | 9.1 | 1,498,130 | Republican-leaning |
| 35.6 | 8.6 | 30,751 | Republican-leaning |
| 37.9 | 8.8 | 4,352 | Republican-leaning |
| 29.6 | 8.6 | 175,543 | Republican-leaning |
| 49.3 | 20.3 | 9,209 | Democratic-leaning |
| 35.8 | 10.1 | 4,173 | Republican-leaning |
Page 1 of 156
Dot area represents population; lines are least-squares fits with 95% intervals. Both panels share scales.
CDC PLACES · county health estimates and 2020 presidential direction
Reading notes
County-level correlations do not establish individual risk or a causal effect of political affiliation.
Source & method
CDC PLACES · county health estimates and 2020 presidential direction
Existing CTZN Viz reference fixture: 01-health-scatter-faceted.json. This example reuses the captured values; no fresh source retrieval is implied.