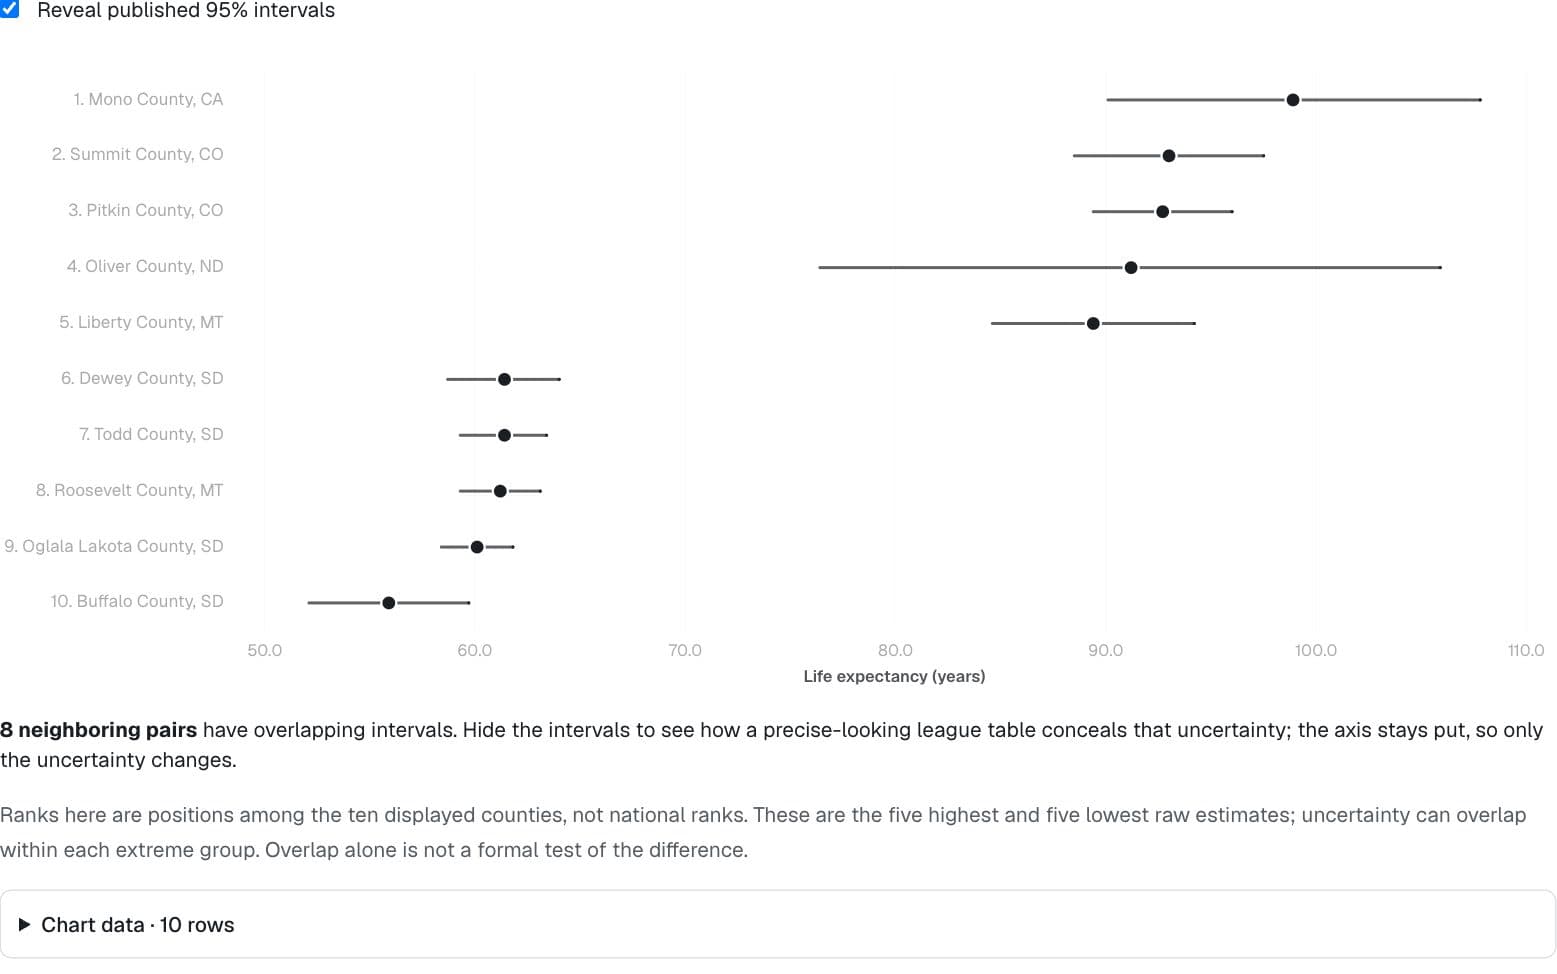
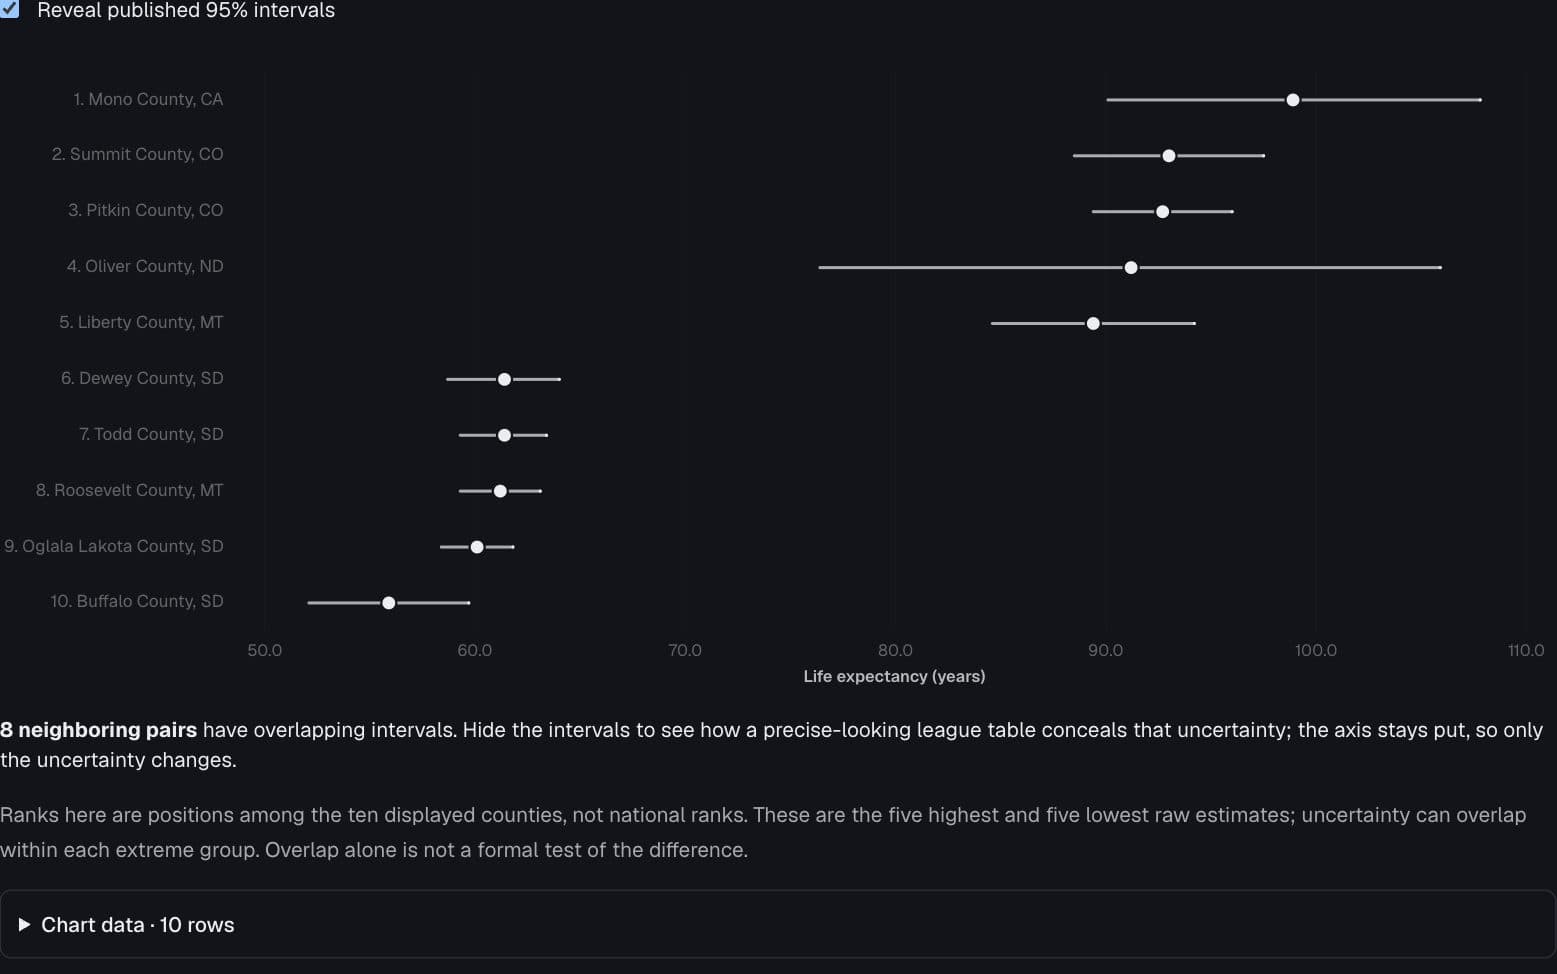
Small counties, wider variation
How does the spread of county life expectancy change with population size?
- County
- 5th–95th percentile, by population decile
CHR 2024 v147 (life expectancy, NVSS 2019–2021) against population (v051) for all ranked counties reporting both. Envelope: 5th and 95th percentiles of life expectancy within each population decile, plotted at the decile median population. The shaded range describes variation between counties; it is not a confidence band or a control limit. The population axis is logarithmic. Counties outside the envelope are not automatically errors.
Envelope data · 10 rows
| Median population | 5th percentile (years) | 95th percentile (years) | Counties |
|---|---|---|---|
| 3,533 | 68.6 | 82 | 307 |
| 7,513 | 69 | 80.5 | 307 |
| 11,663 | 69.3 | 80.6 | 307 |
| 16,601 | 70.6 | 79.9 | 307 |
| 22,593 | 69.8 | 80.5 | 307 |
| 31,957 | 70.4 | 79.8 | 307 |
| 45,306 | 71 | 80 | 307 |
| 71,403 | 71.4 | 80.1 | 307 |
| 146,140 | 72.6 | 81.3 | 307 |
| 466,103 | 74 | 82.1 | 307 |
County data · 3,070 rows
| County | State | Population | Life expectancy (years) |
|---|---|---|---|
| Autauga County | AL | 59,759 | 75.3 |
| Baldwin County | AL | 246,435 | 76.7 |
| Barbour County | AL | 24,706 | 72.4 |
| Bibb County | AL | 22,005 | 72.3 |
| Blount County | AL | 59,512 | 73.4 |
| Bullock County | AL | 10,202 | 72.1 |
| Butler County | AL | 18,650 | 73.2 |
| Calhoun County | AL | 115,788 | 71.7 |
| Chambers County | AL | 34,088 | 72.5 |
| Cherokee County | AL | 25,302 | 72.7 |
| Chilton County | AL | 45,884 | 73.5 |
| Choctaw County | AL | 12,439 | 73.8 |
| Clarke County | AL | 22,515 | 71 |
| Clay County | AL | 14,198 | 71.8 |
| Cleburne County | AL | 15,346 | 72 |
| Coffee County | AL | 54,805 | 74.2 |
| Colbert County | AL | 58,033 | 73.5 |
| Conecuh County | AL | 11,206 | 69.5 |
| Coosa County | AL | 10,166 | 73.1 |
| Covington County | AL | 37,602 | 71.3 |
County Health Rankings & Roadmaps 2024 · NVSS 2019–2021 life expectancy
Reading notes
The 5th–95th percentile envelope is between-county spread, not a confidence interval or a statistical control limit. Counties are equally weighted within deciles.
Source & method
County Health Rankings & Roadmaps 2024 · NVSS 2019–2021 life expectancy
Unchanged CHR 2024 county aggregates (life expectancy from NVSS 2019–2021) and supplied population-decile 5th/95th percentiles. Envelope is empirical spread, not a confidence interval.
Capture provenance
- Source repository / file
- picturing-american-health / public/figdata/f0902-funnel.json
- Revision
- e13698bac543141b21d62cb9d5c7dddc99aef834
- Captured
- 2026-09-11
- Source SHA-256
- b22daf7880298d6cbd8261d564ada96e416d981017c7c626fa1300b7b32a74c4
- Reuse note
- Aggregated public-facing example from the user-owned source repository. Upstream attribution retained; no new license asserted.