Skip to content
The American Political Almanac
RECONSTRUCTION & THE GILDED AGETHE SYSTEM OF 1896THE NEW DEAL ORDERTHE LONG REALIGNMENTPOLARIZED ERA1868RRRRD1888RDRRR1908RDDRR1928RDDD1944DDRRDD1968RRDRR1988RDDRR2008DDRD2024R

The Nation Decides

Electoral votes, the popular vote, and how every state moved
✓ Won
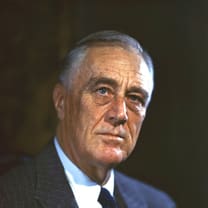
Franklin D. Roosevelt
Democrat
Franklin D. Roosevelt
432
Electoral votes
53.4% · 25,094,426
President · The New Deal Order

1944

Roosevelt def. Dewey, 432–99
vote totals summed from county returns
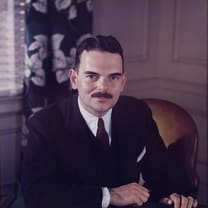
Thomas E. Dewey
Republican
Thomas E. Dewey
99
Electoral votes
45.9% · 22,122,778
Electoral college — 266 to win (531 electors)432 D · 99 R
Popular vote53.4% · 45.9% · margin D+7.5

48,409,510 votes counted (summed from counties) · Excludes third-party votes in 1 county whose source totals are double-counted.

Electoral map — one tile per state · coloured by county-summed popular vote
R+40D+40third party won

Per-state electoral vote detail is staged from 1976; earlier years show the national college in the bar above, and states are coloured by their county-summed popular vote.

Missouri: the source double-counts some county totals this year, so third-party vote there is understated (shown with a +).

The swing from last time
Change in each state’s margin since 1940 · ← toward Republicans · toward Democrats →

The Map Beneath the Map

Three thousand counties, and the demography of the divide

Every county that cast a ballot, shaded by its margin. Hover any county to read it; click to open its 156-year profile. Scrub the timeline above and the map redraws in place. Vote counts exist for all forty elections; the demographic lenses begin in 2000.

County margin

Drawing three thousand counties…

R+40D+40no returns

Who voted for whom? The survey record begins with the 1948 ANES — there is no comparable individual-level account of the 1944 electorate.

Notes on this election

  • The wartime election; FDR's fourth win.