Five choices behind a data map
Live maps of New York, Los Angeles and Chicago down to the block group, every US county, Europe’s statistical regions and the world’s countries, built so the same numbers can be drawn under a different geography, class rule, colour, form or projection.
The maps include choropleths, proportional symbols, a Dorling cartogram, small multiples, a two-variable map, side-by-side comparisons and a map linked to a scatterplot. They draw census estimates, presidential returns since 1868, and health, climate, income and population data. Controls on each map change the place, the level, the measure, the class rule or the palette, depending on the page, and most views can be shared as a link.
The site has two aims: to show data on subjects we want to understand, and to build reusable TypeScript map components for other projects. Every map here is drawn with them; the component catalog lists them, and About lists what they are built with.
- Authors
- Uma Huggins and Vishal Singh
- Published
- 6 September 2026
- Updated
- 29 September 2026
Every picture below is a capture of a live page on this site. Its link opens that page at the view shown, with the controls to change it. The maps are grouped by the choice they test, in the order the sidebar follows: geography, classification, colour, form and projection, followed by the places where the data stop.
The numbers in each caption come from the same data files the map draws, and an automated test fails if a caption and its data disagree. The line above each title names the place and the dataset.
Start here
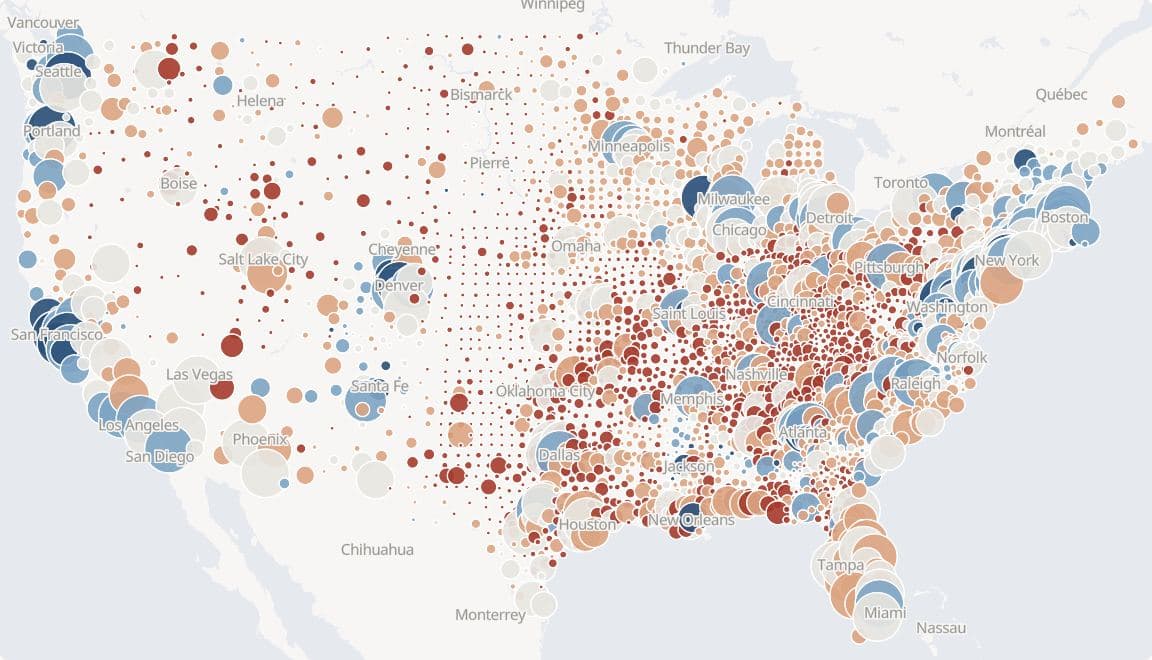
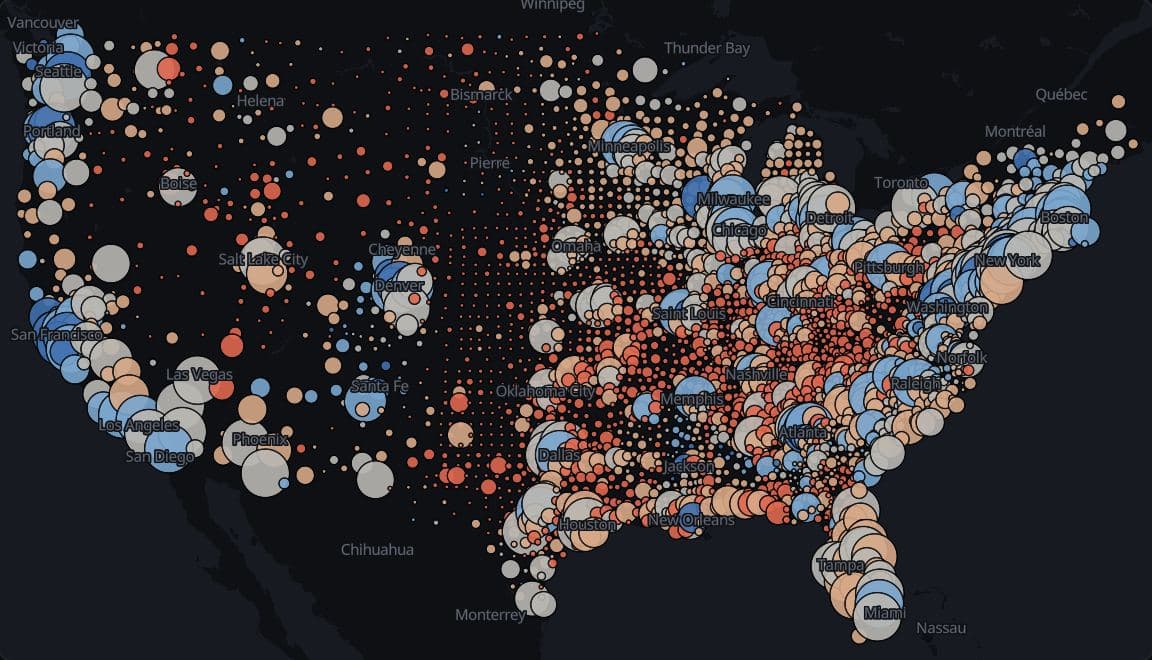
US counties · MIT Election Data and Science Lab 2024
2024 presidential vote, sized by votes cast
Trump led the two-party vote in 2,661 of 3,108 counties in the lower 48 states and DC in 2024 (85.6%), and those counties cast 51.0% of the 154.2 million votes for president there.
Hides: Area: each circle sits on its county's centre, so a large rural county shrinks to a small dot, and Alaska, which reports by election district, is not drawn.
Geography
The level decides which numbers exist, and finer areas show more places while withholding more estimates.
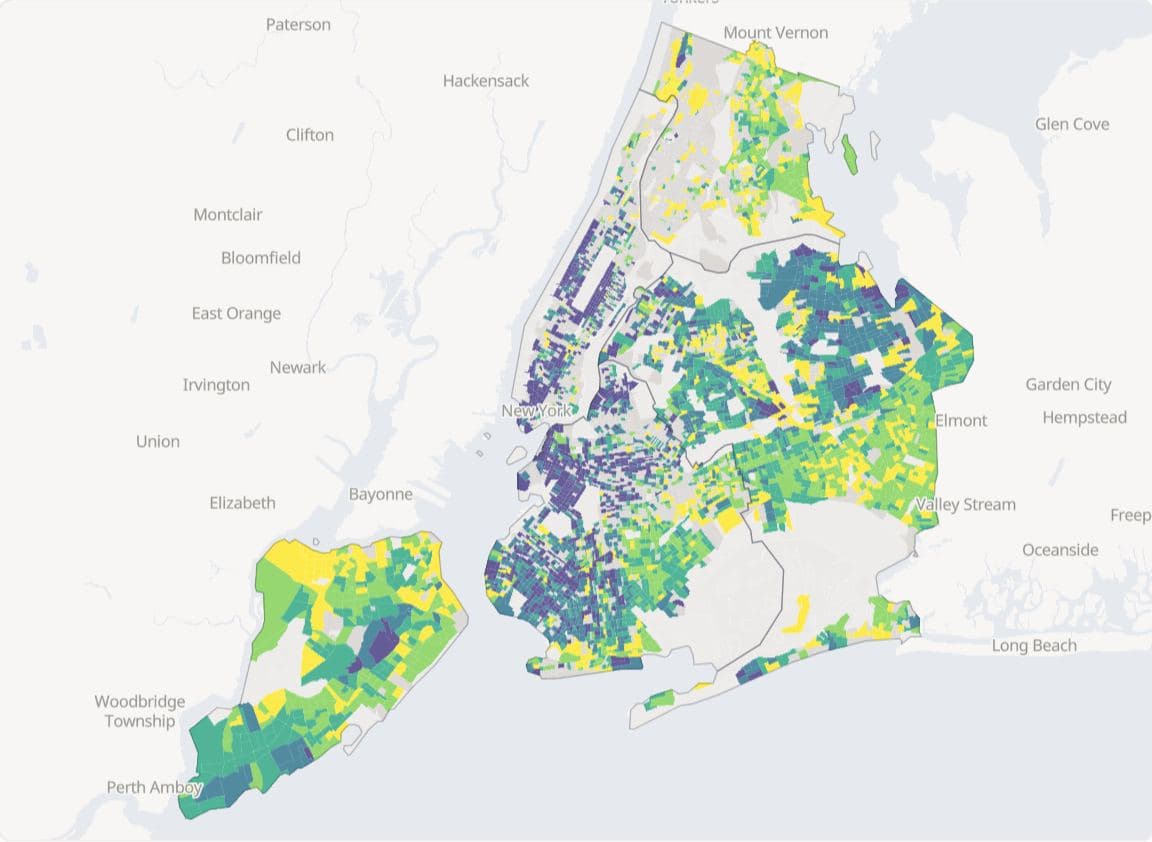
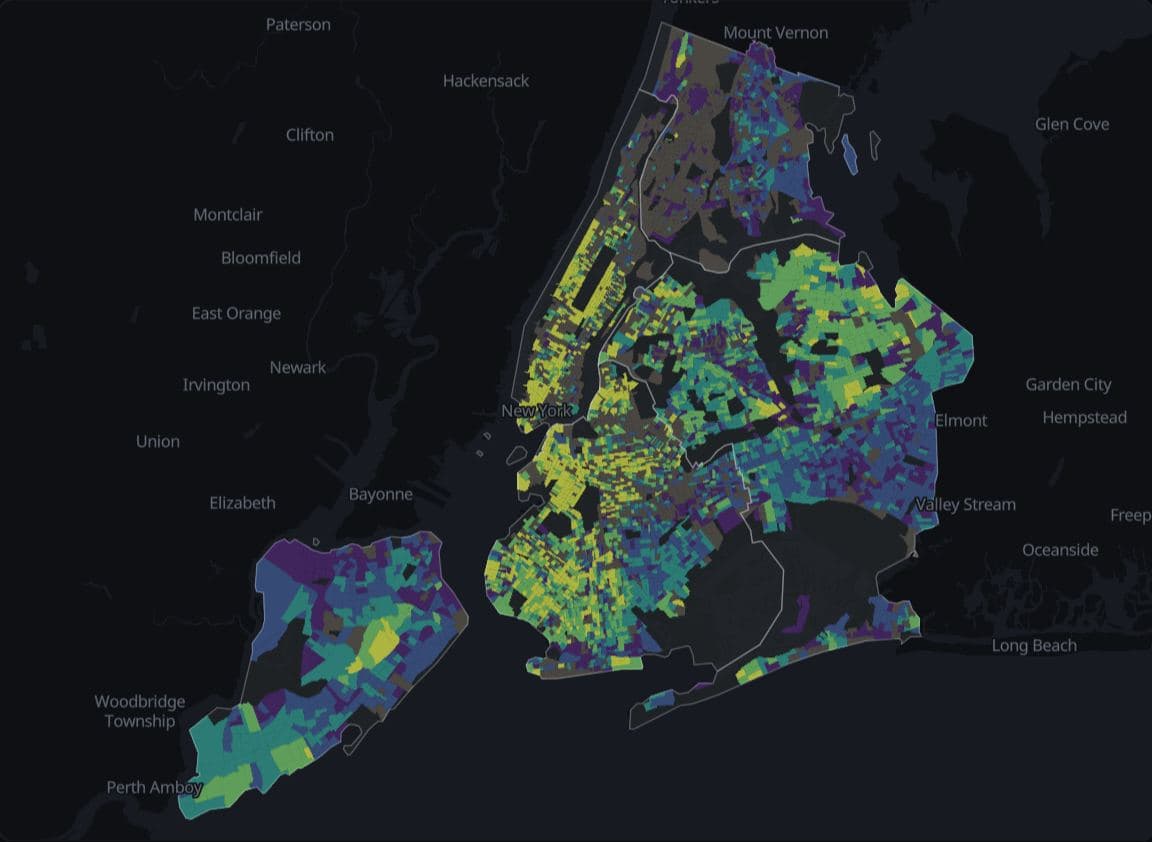
New York · ACS 2019-2023
New York home values by block group
ACS 2019-2023 estimates withhold median home value for none of New York City's 55 PUMAs, 295 of its 2,324 tracts (12.7%) and 2,188 of its 6,804 block groups (32.2%), counting areas with no residents in the totals.
Hides: The margins of error of the estimates that were published, and the reason each blank one was withheld.
New York · ACS 2019-2023
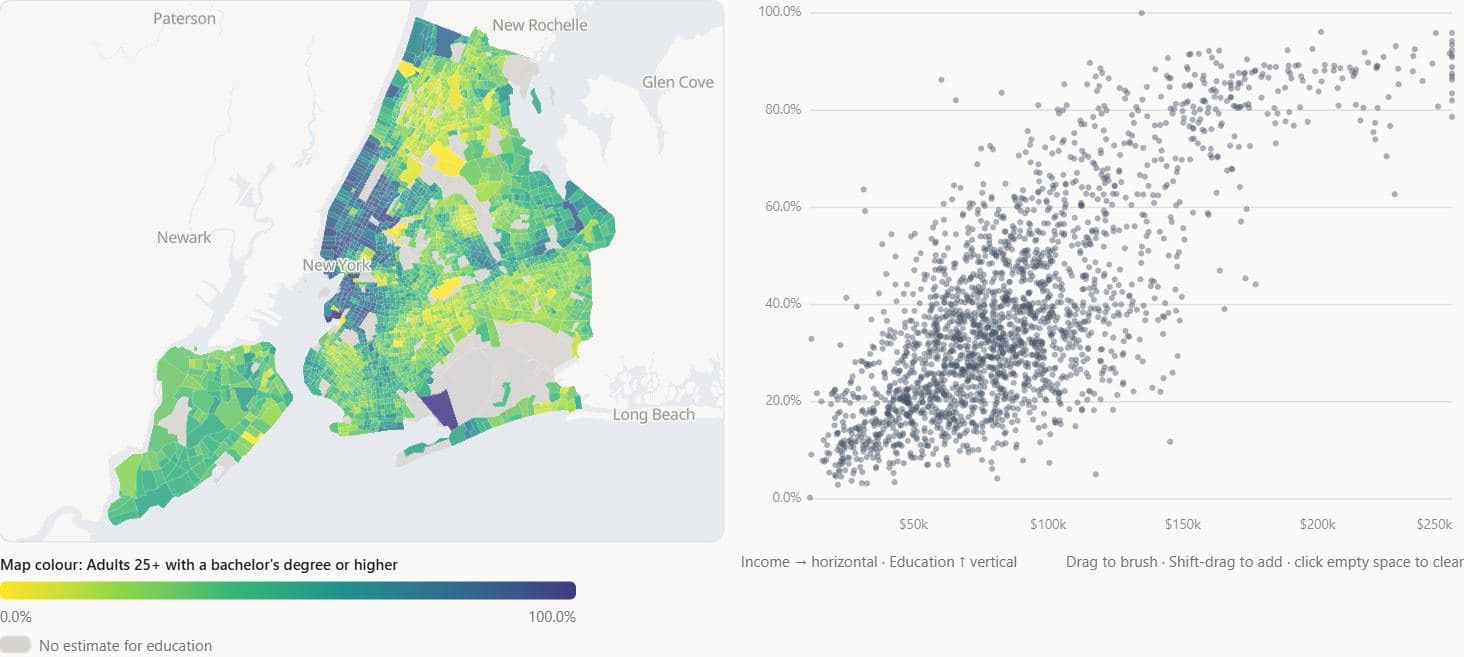
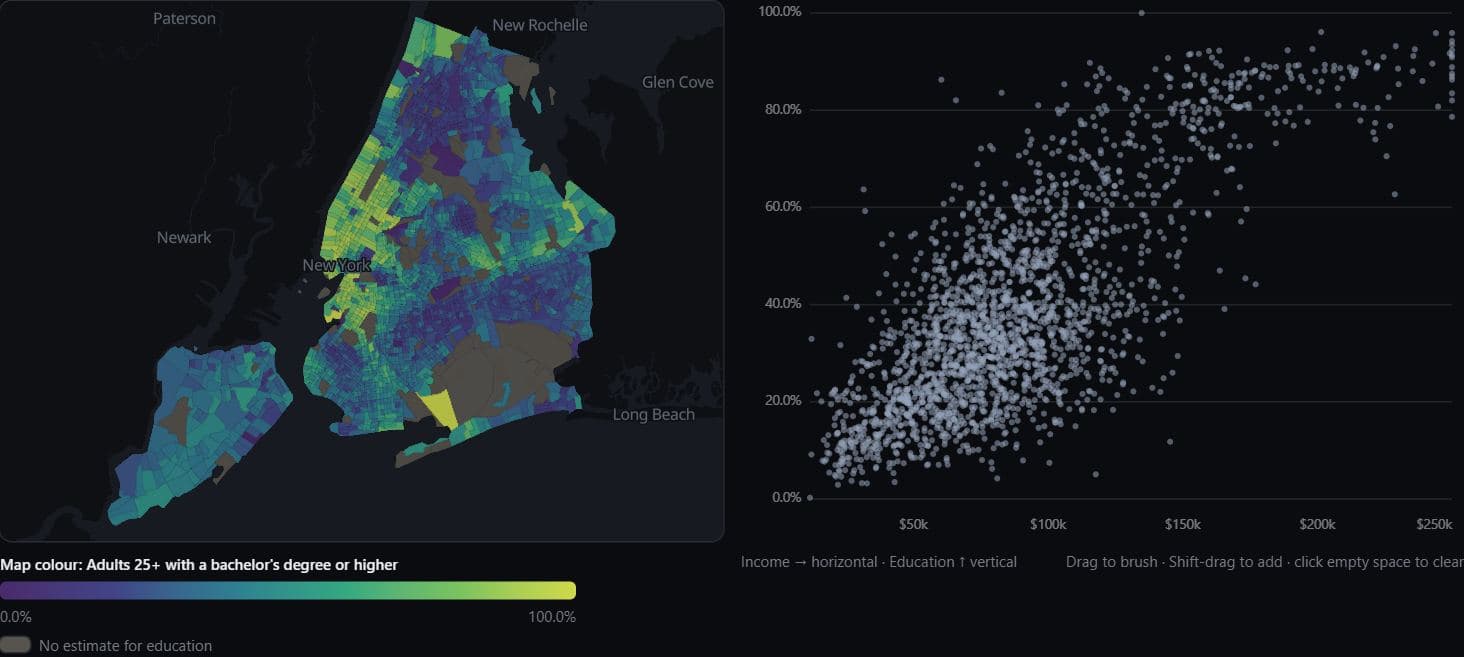
Income and degree share at three levels
Median household income and the share of adults with a bachelor's degree correlate at r = 0.86 across New York City's 55 PUMAs, 0.77 across 2,192 tracts and 0.71 across 5,455 block groups (ACS 2019-2023).
Hides: Any mechanism: at every level this is a correlation between areas, not between people.
Europe · Eurostat nama_10r_3gdp 2022
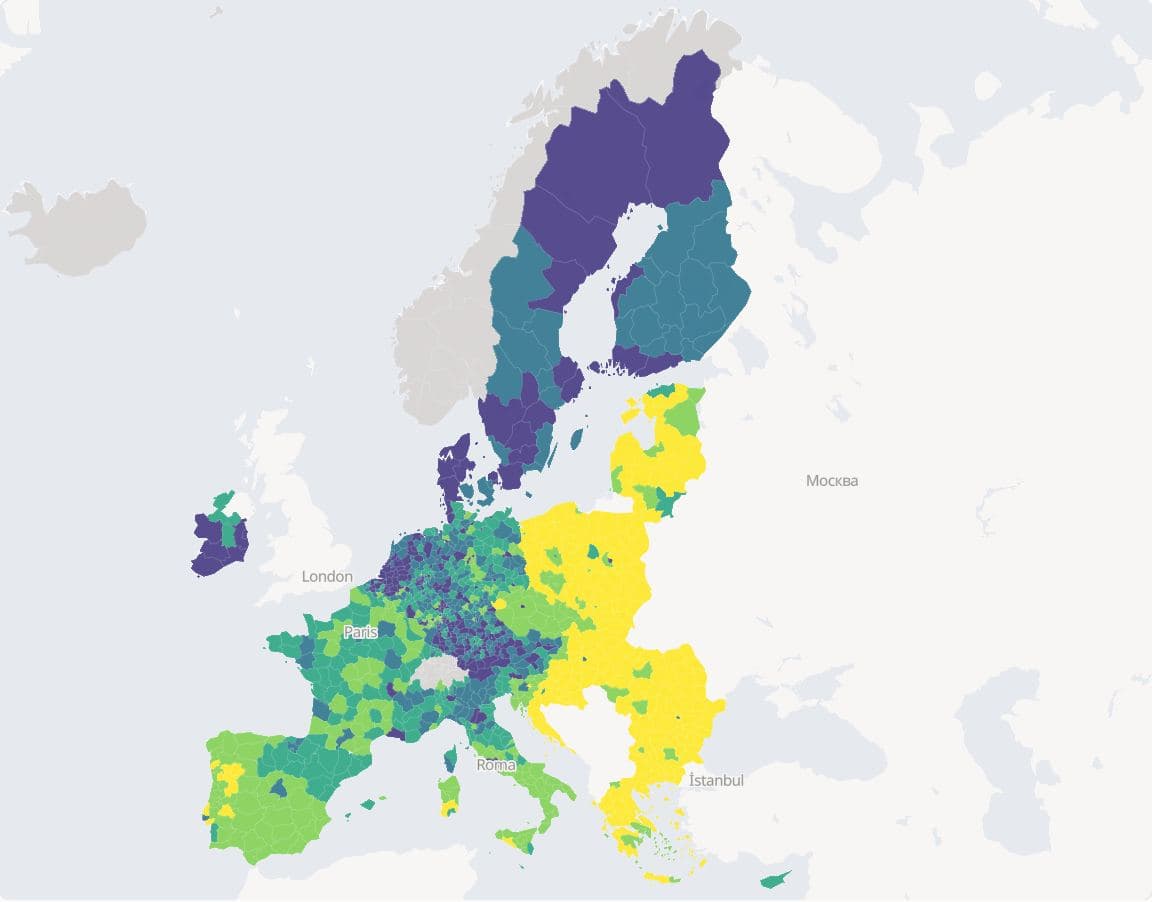
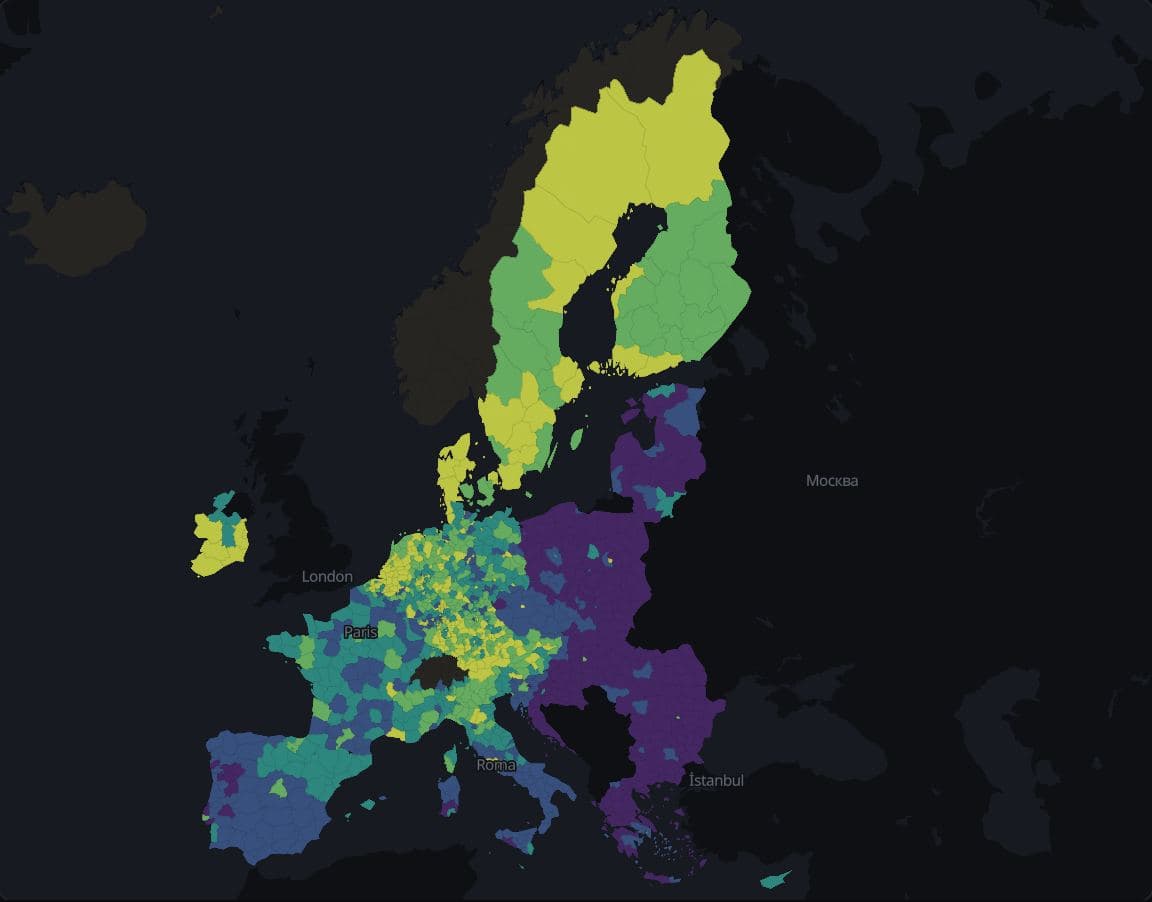
EU GDP per inhabitant at three levels
In 2022 the highest GDP per inhabitant was 8.8 times the lowest across 27 EU countries, 13.3 times across 244 basic regions (NUTS 2) and 31.7 times across 1,165 small regions (NUTS 3), where it ran from €6,100 to €193,600.
Hides: Price levels, since these are euros at market prices, and the EFTA regions, which have no GDP per inhabitant for 2022.
Classification
The class rule decides which places share a colour while the numbers stay the same.
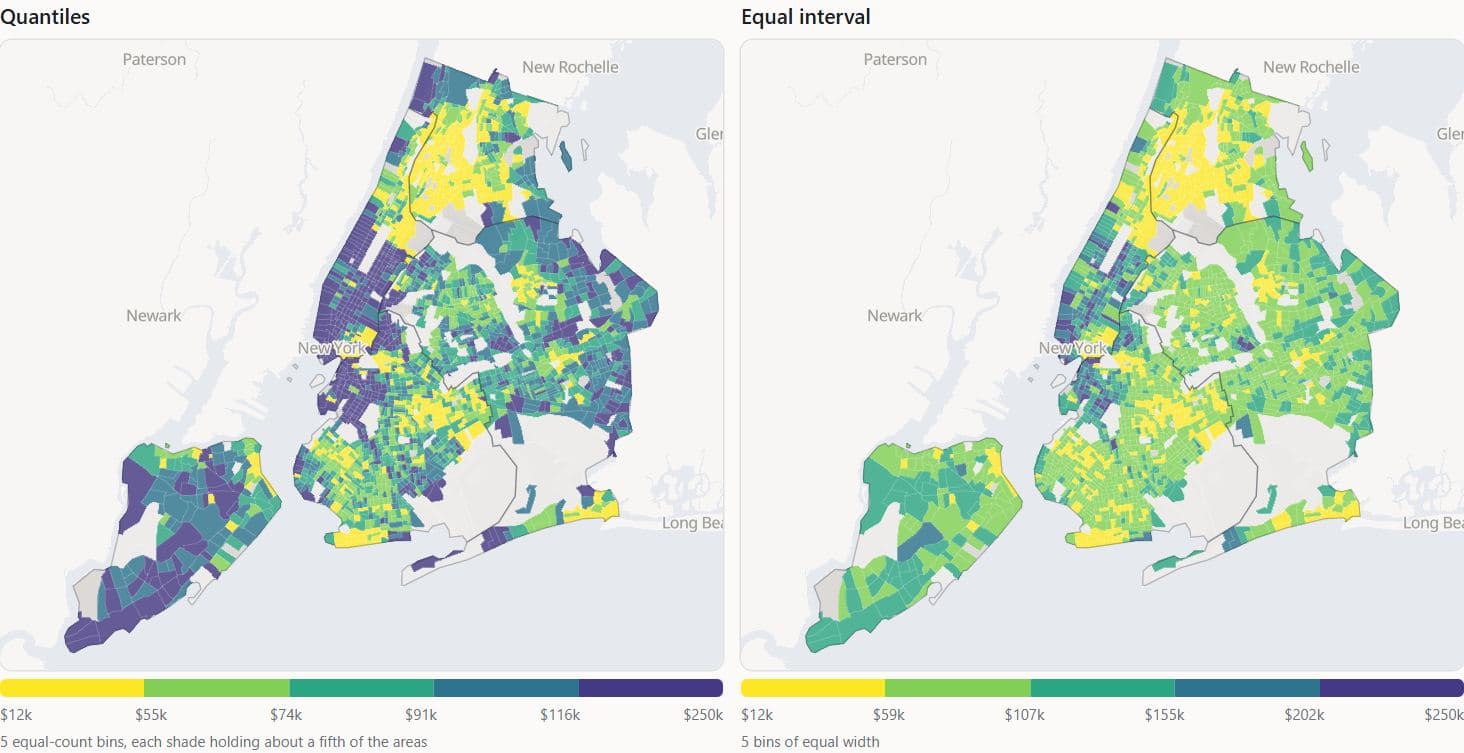
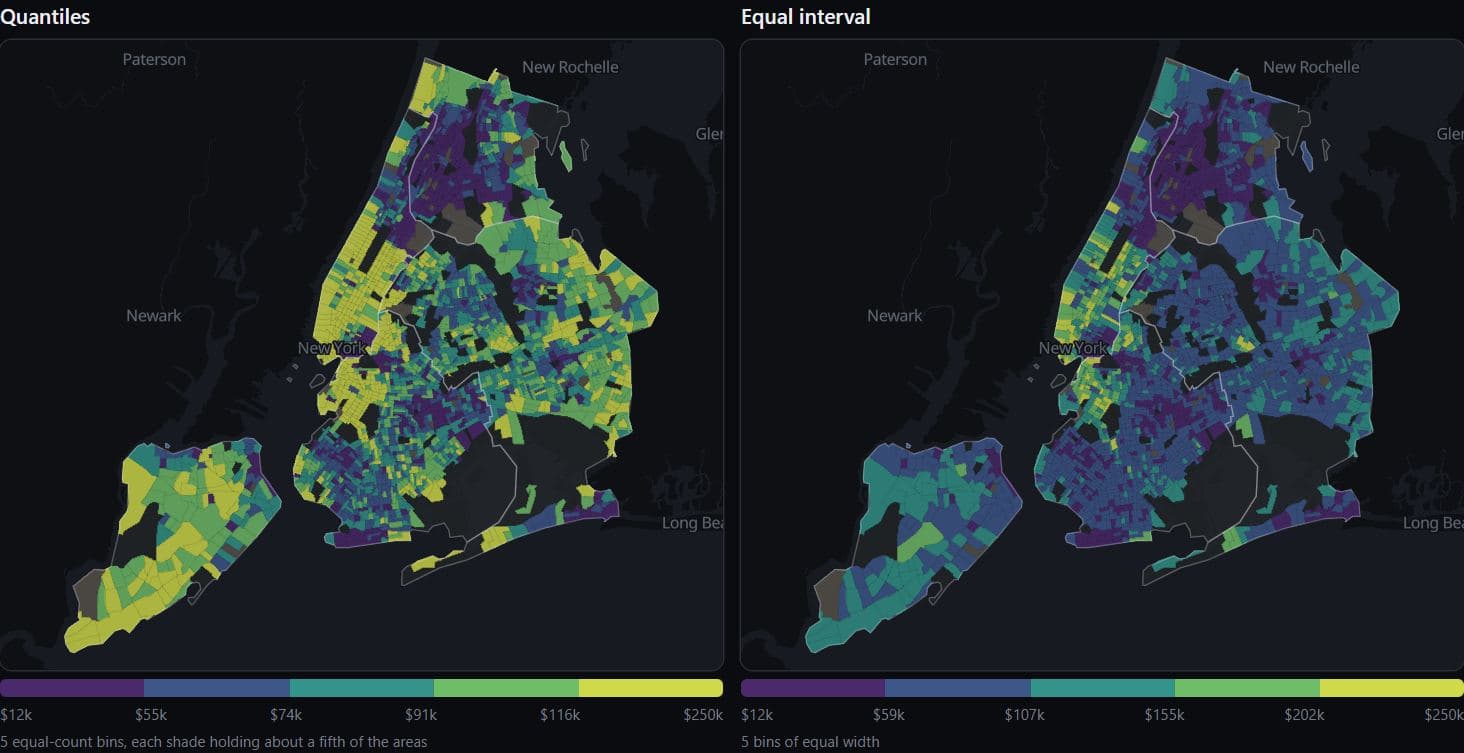
New York · ACS 2019-2023
New York income under two class rules
Quintiles put 438 or 439 of New York City's 2,192 tracts in each median household income class, while five equal-width classes put 1,110 in the second class and 54 in the top one (ACS 2019-2023).
Hides: Where inside its class each tract falls: both panels draw the same incomes.
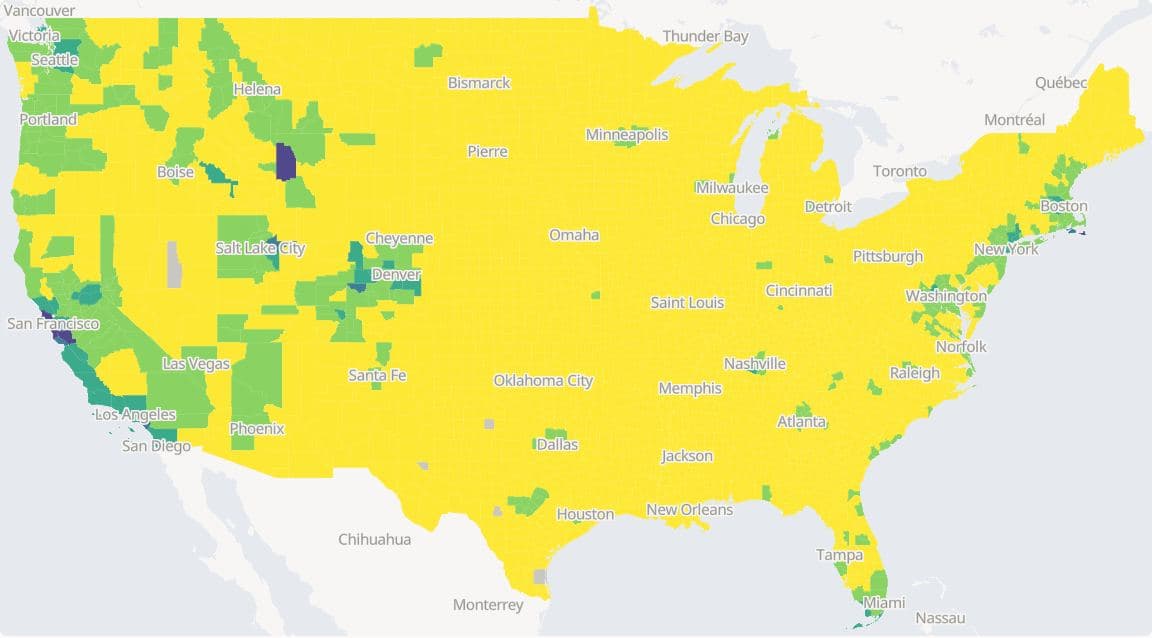
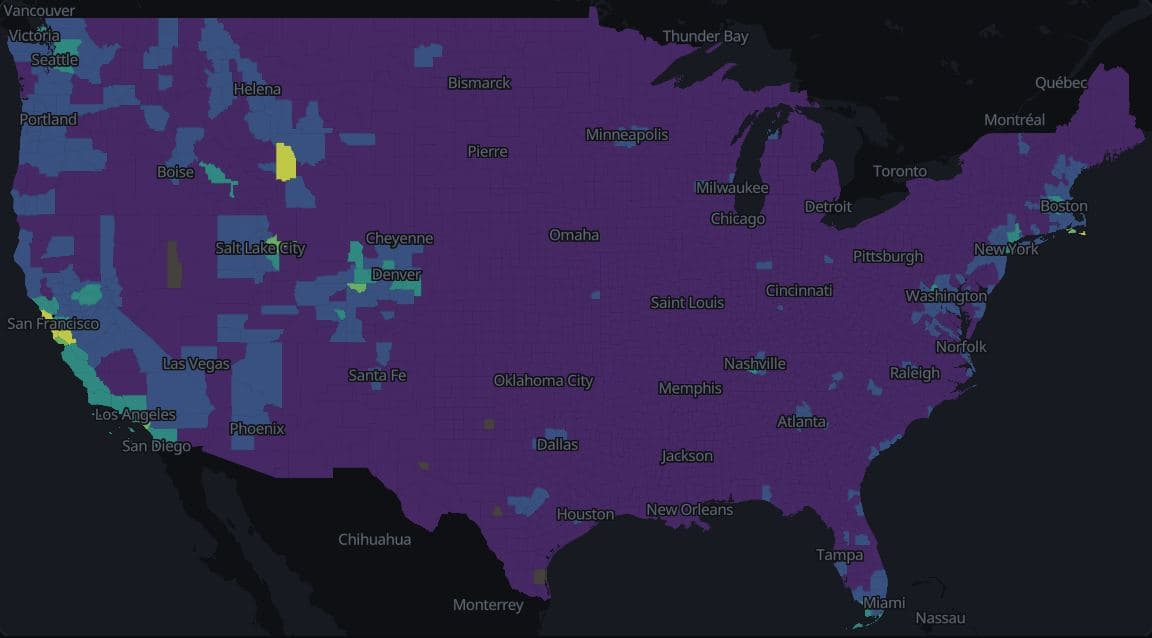
Deliberately wrongUS counties · ACS 2019-2023
US county home values in equal-width classes
In this deliberately poor view, five equal-width classes put 2,771 of 3,138 US counties (88.3%) in the lowest class of median home value, because San Mateo County, CA, at $1,494,500, stretches the range (ACS 2019-2023).
Hides: Almost all variation between counties, because one class holds most of them.
Los Angeles · ACS 2019-2023
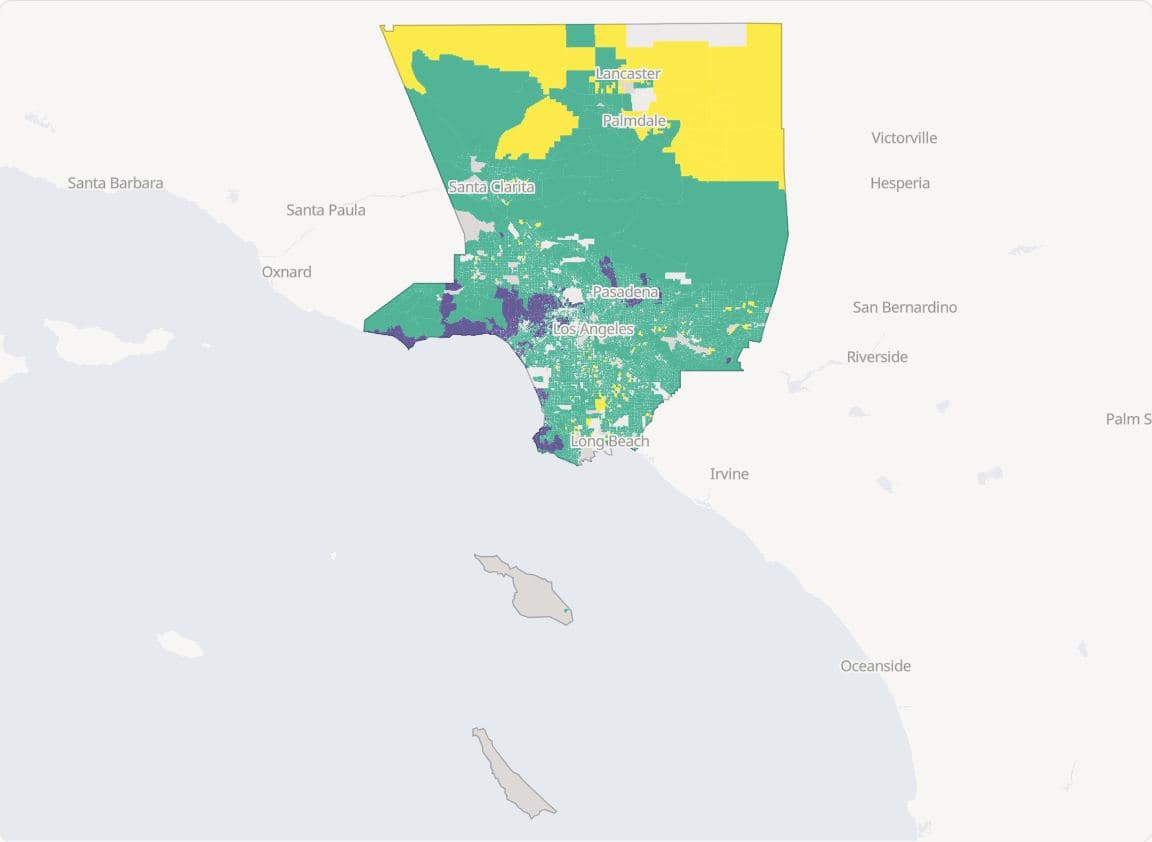
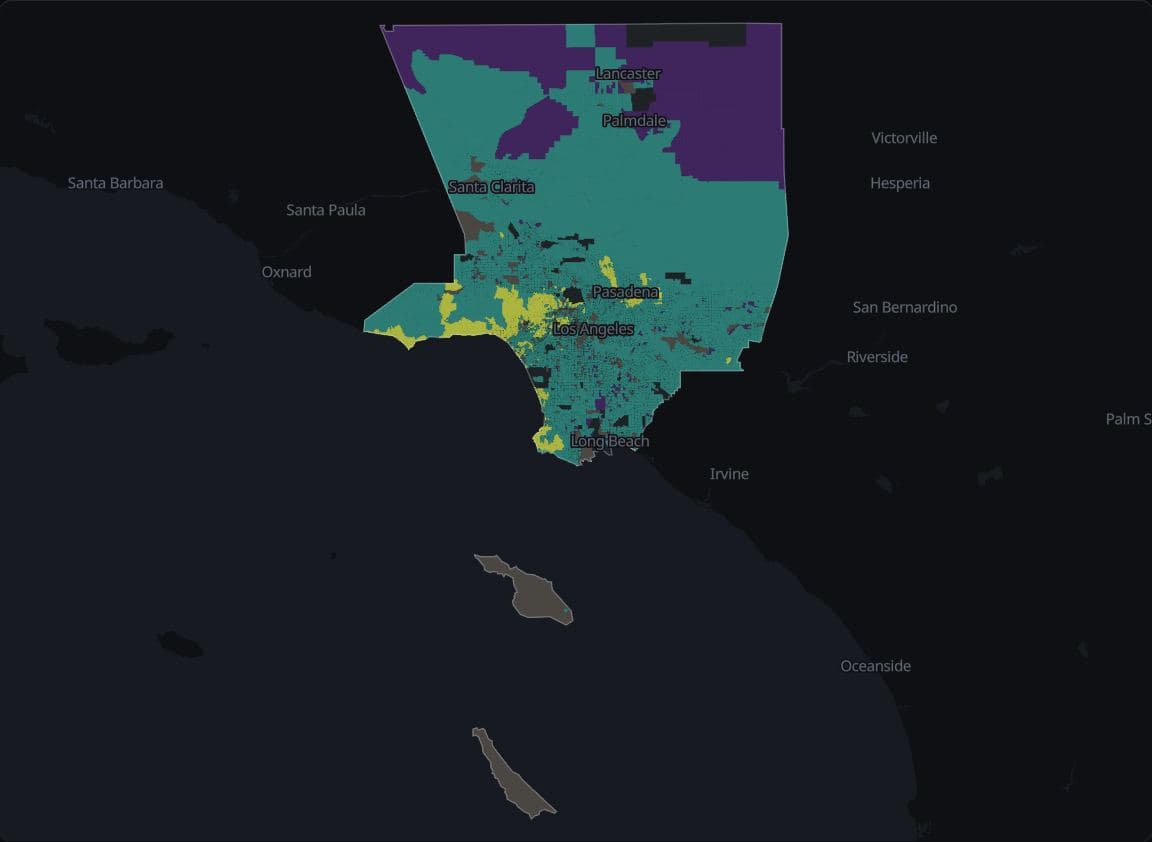
LA home values at the ACS top code
342 of 5,793 Los Angeles County block groups with an estimate report median home value at the ACS top code of $2,000,001, so the top 5% class holds only top-coded values (ACS 2019-2023).
Hides: Everything above the survey's top code, so the top class cannot rank the most expensive areas.
US counties · Algara and Amlani 1868–2020, MEDSL 2024
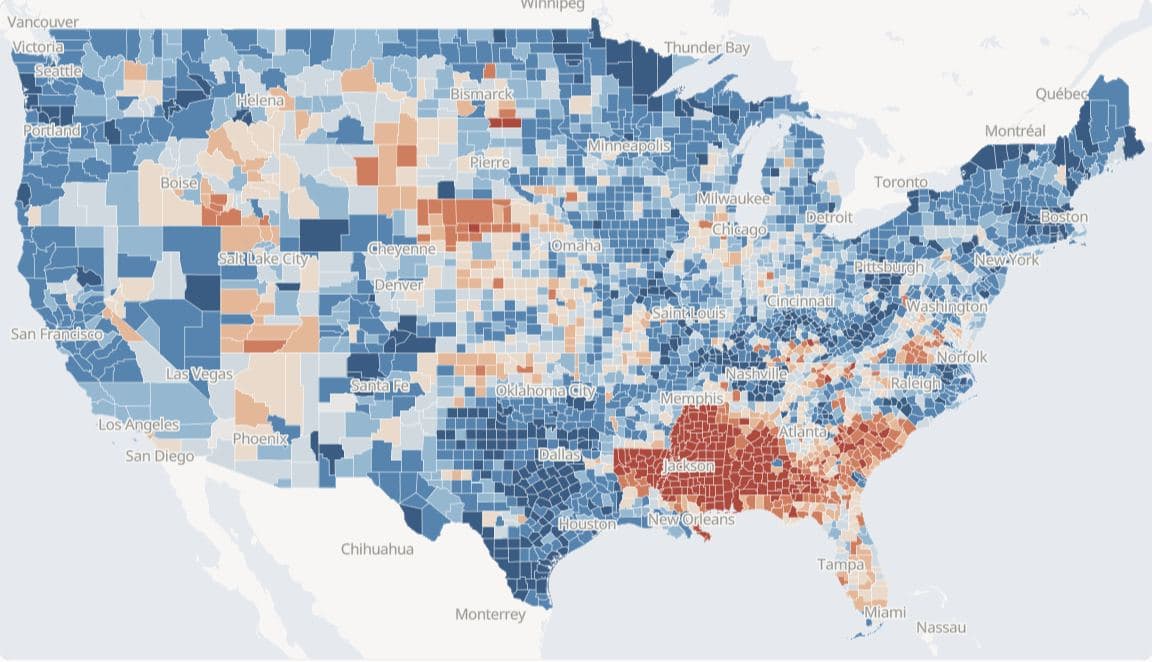
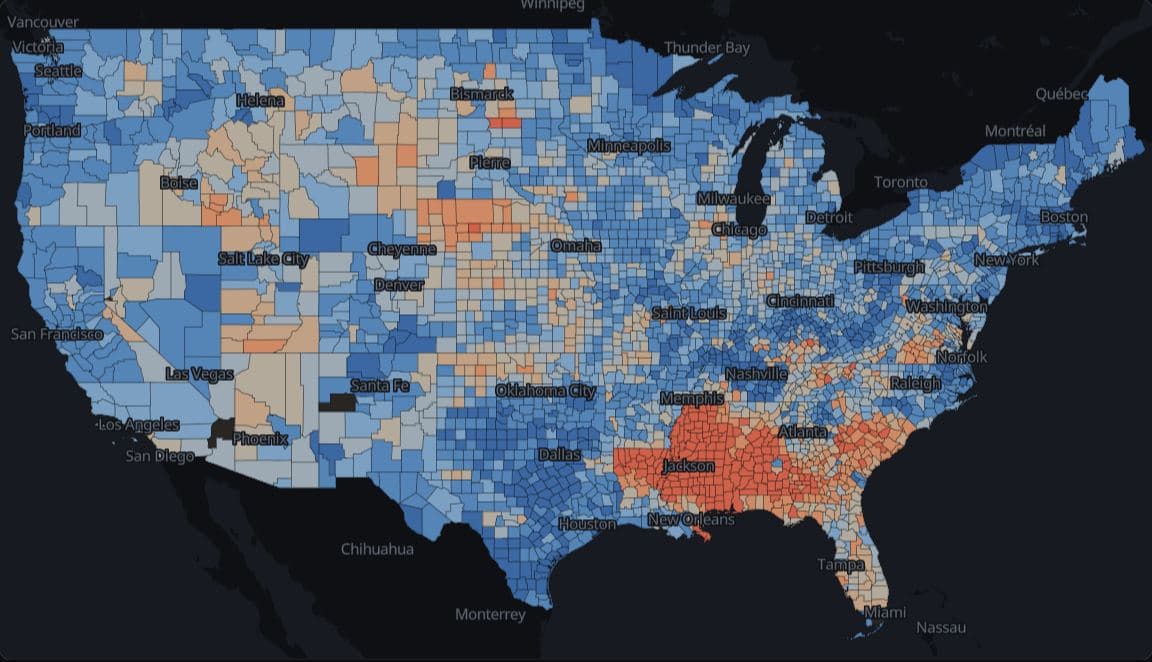
Presidential vote by county since 1868
On one colour scale held fixed across 40 elections, 342 of 418 counties in five Deep South states gave the Democrat a two-party majority in 1960, 86 did in 1964 and 294 did in 1968, a share that leaves out Wallace's third-party vote.
Hides: Third-party votes, and county population: a small county colours as much ground as a large one.
Europe · Eurostat nama_10r_2gdp 2023
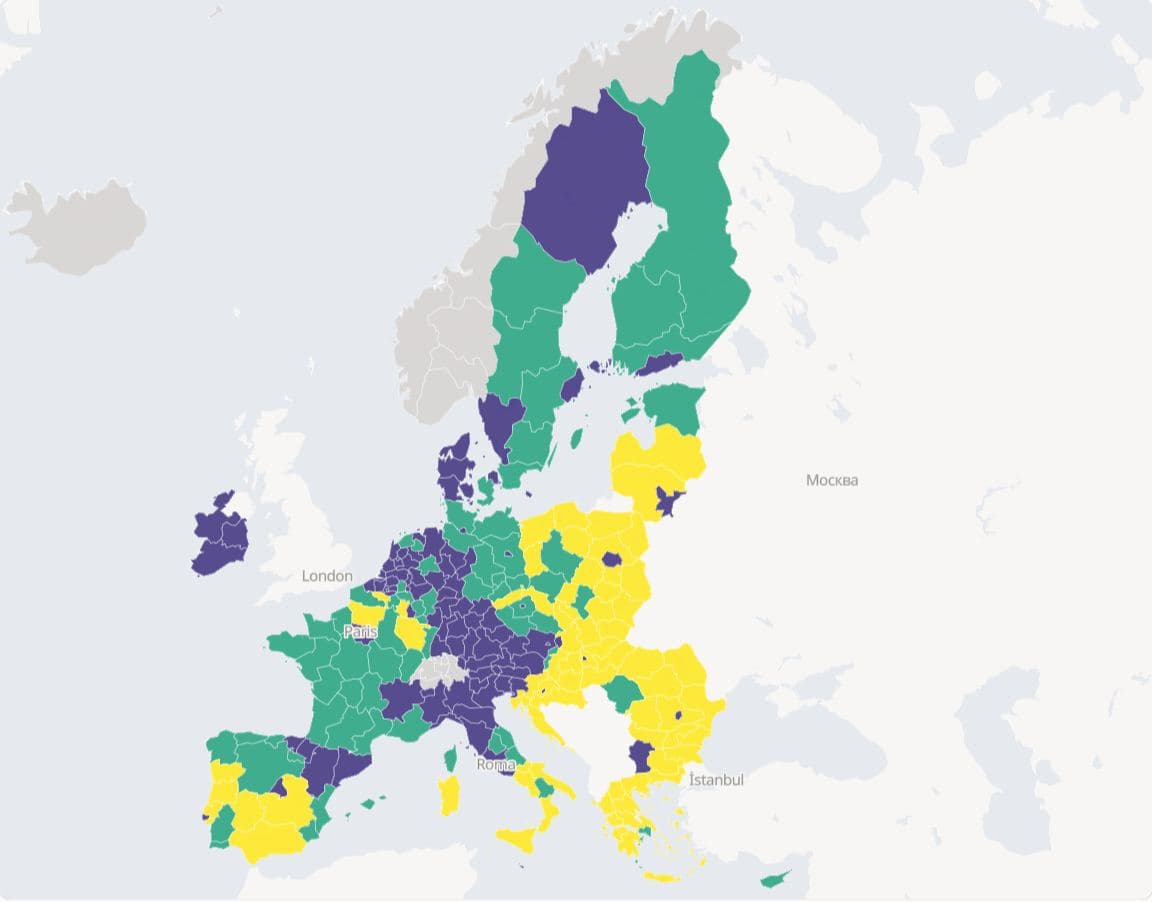
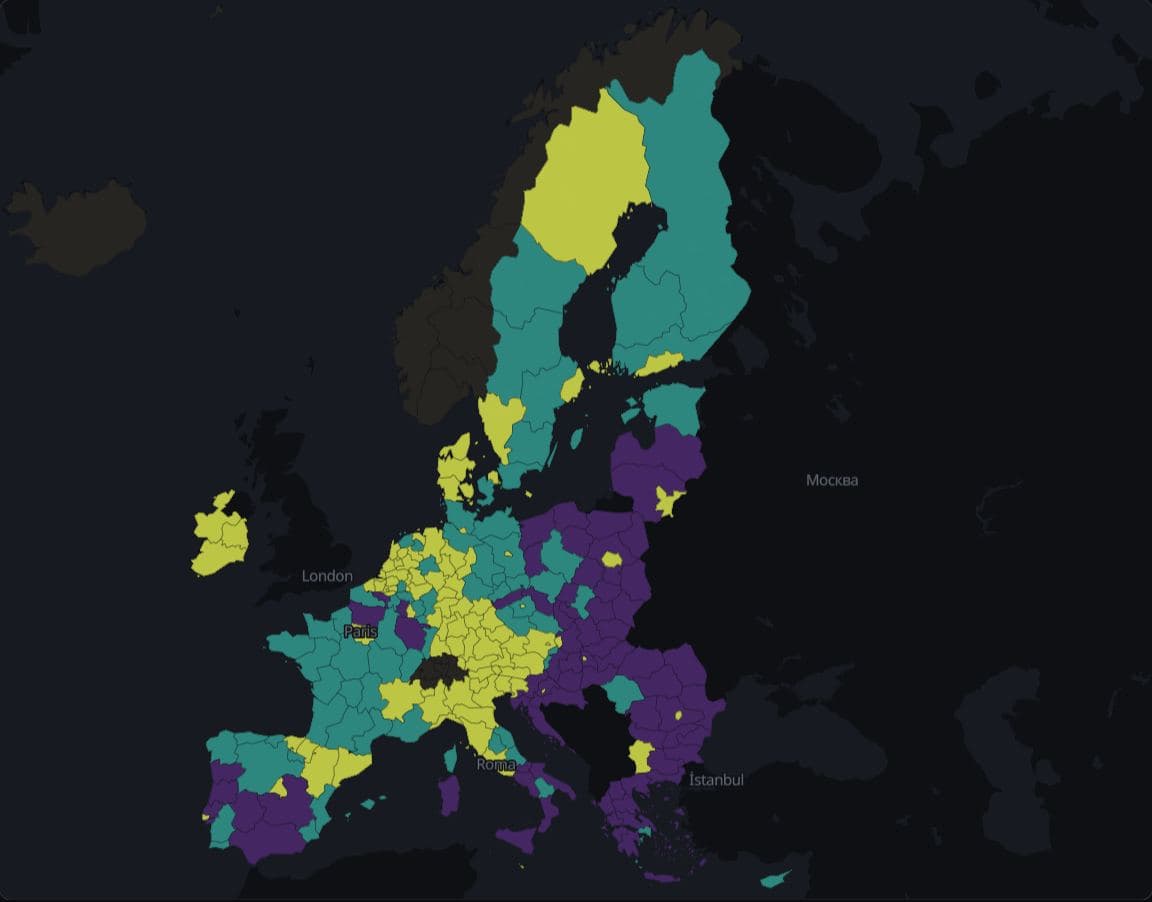
EU regions at the cohesion-policy thresholds
In 2023, 82 of 244 EU basic regions (NUTS 2) had GDP per inhabitant below 75% of the EU average in purchasing power standards, 71 were at 75% to under 100%, and 91 were at 100% or more, among them 3 at exactly 100%, which the cohesion-policy regulation counts as transition regions.
Hides: Differences within each class, and the 2015 to 2017 averages that set eligibility for 2021 to 2027.
Colour
A two-sided colour scale claims the measure has a meaningful middle, so these maps use one only where there is one and values fall on both sides of it.
Los Angeles · ACS 2019-2023
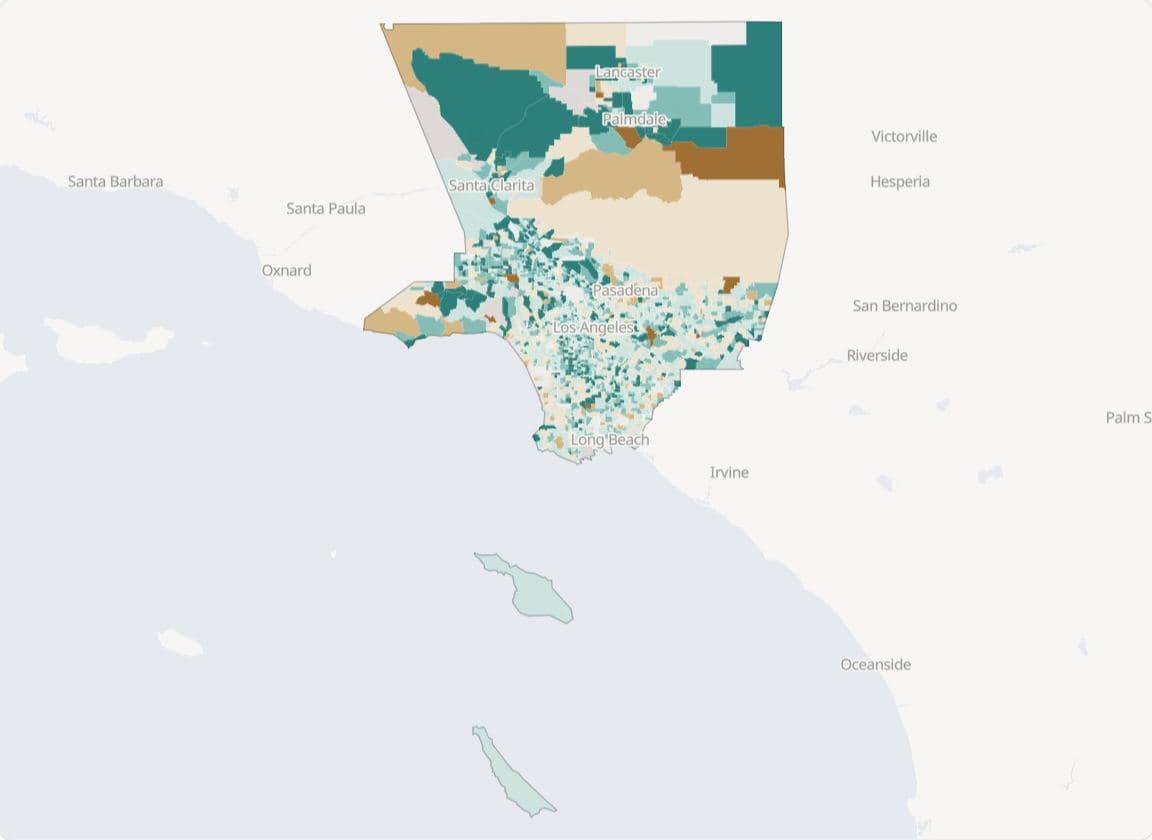
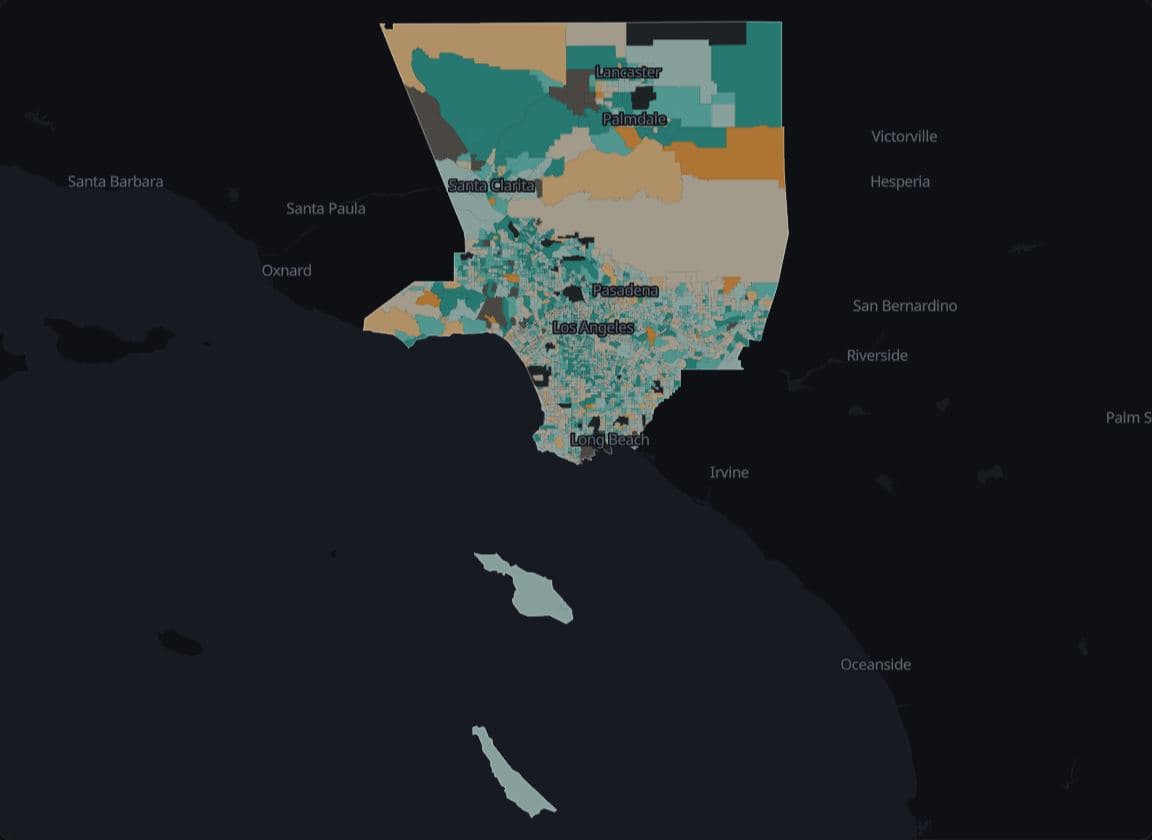
Los Angeles rent burden around 30% of income
Median gross rent is 30% or more of household income in 1,791 of 2,444 Los Angeles County tracts with an estimate (73.3%), against 617 of 1,304 Cook County tracts with an estimate (47.3%), in ACS 2019-2023 estimates.
Hides: Homeowners, who are outside the measure, and how many renters each tract has.
World · World Bank WDI 2023
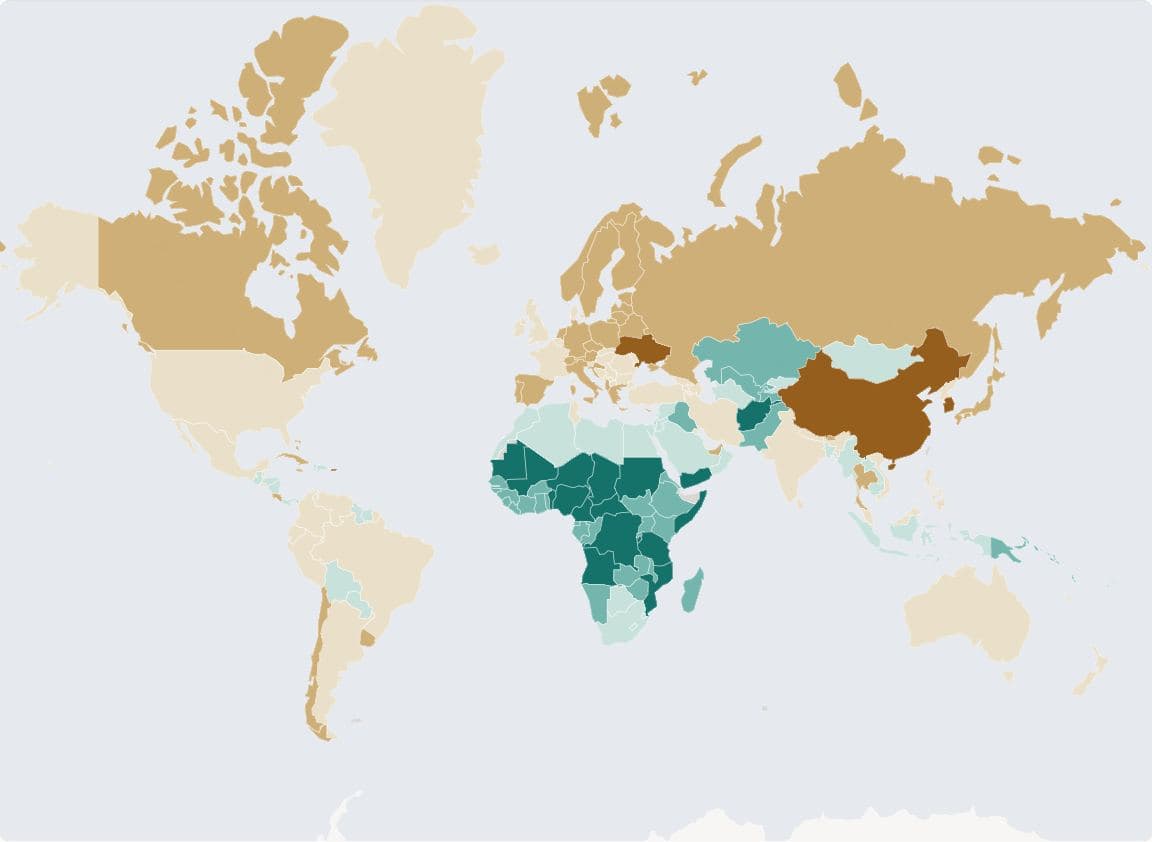
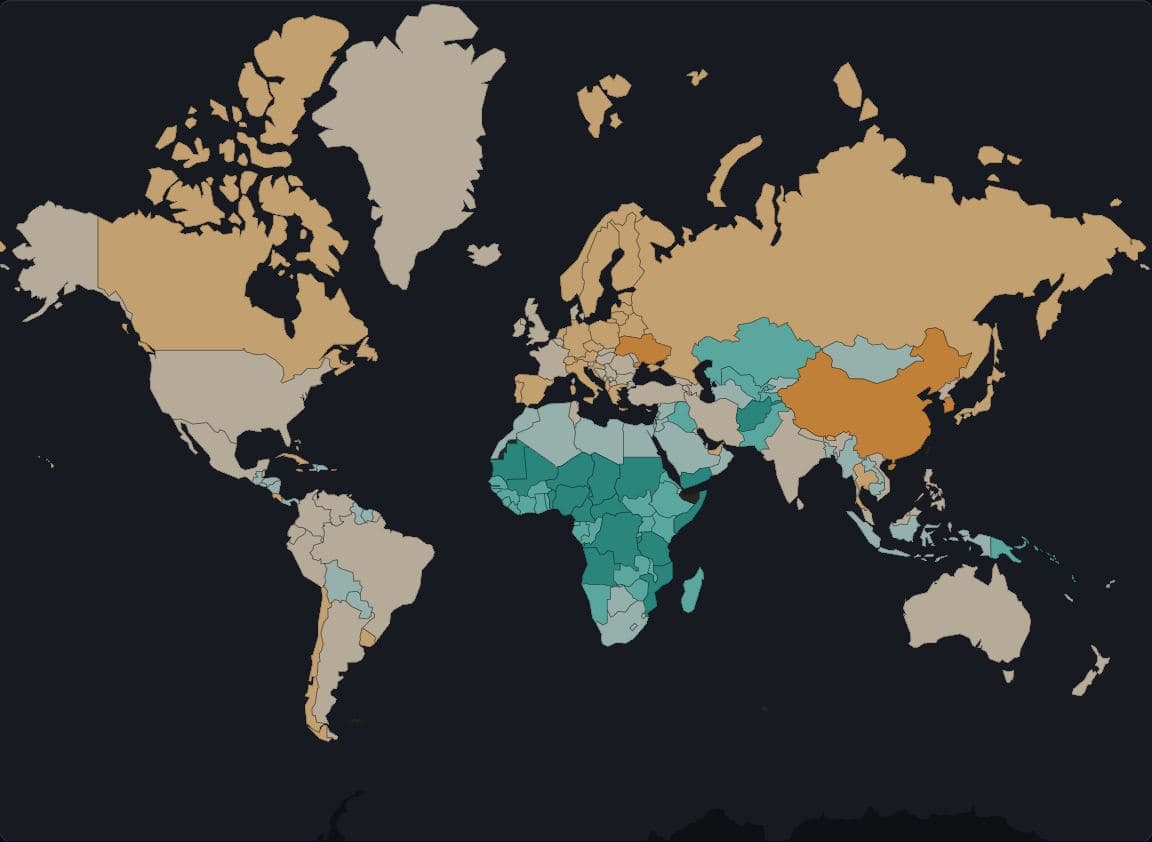
Fertility by country, centred on 2.1
In 2023, 85 of 170 countries had fertility below 2.1 births per woman, and they held 67.0% of those countries' population (World Bank).
Hides: Population: a large country with few people and a small one with many take colour by area alone.
US counties · Census Bureau PEP Vintage 2025, 2020-2025
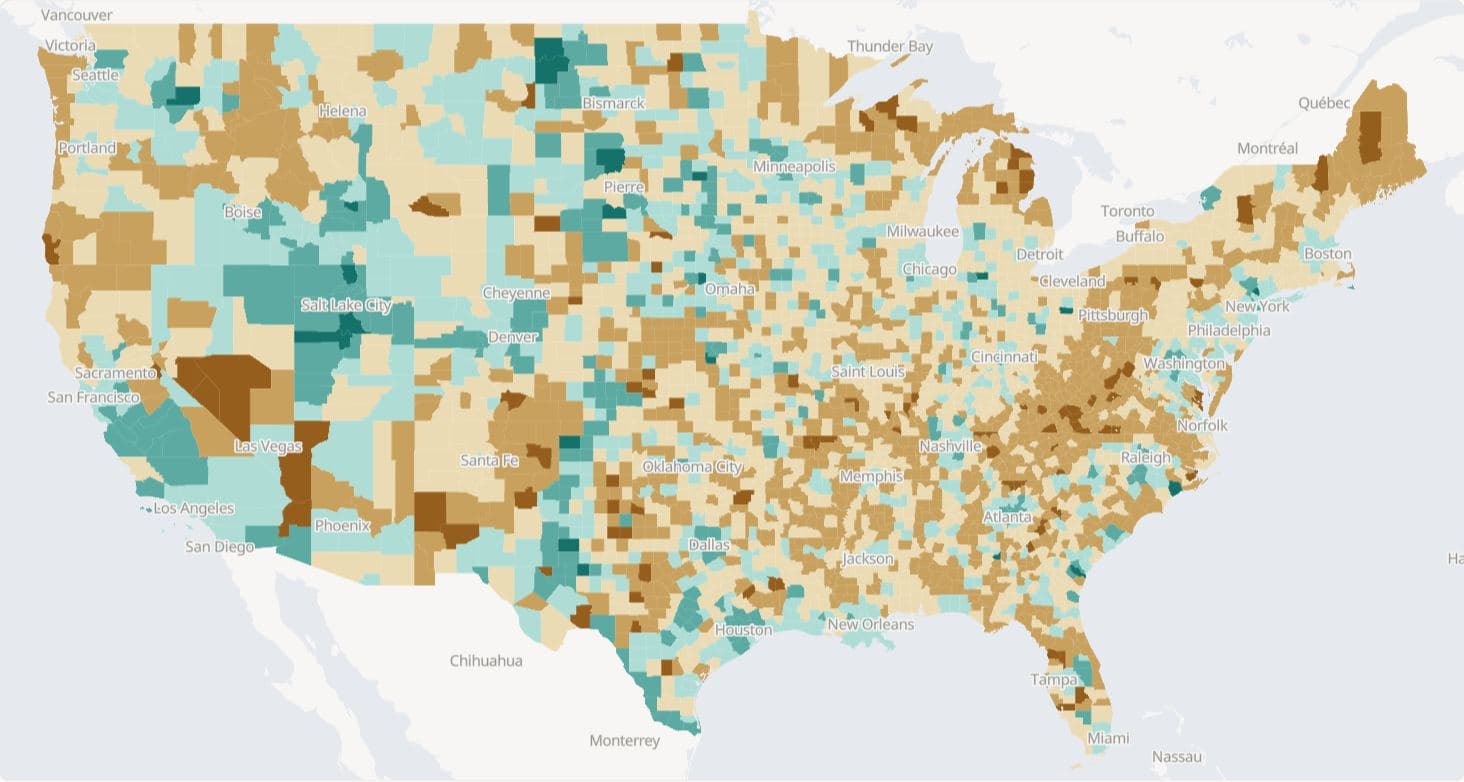
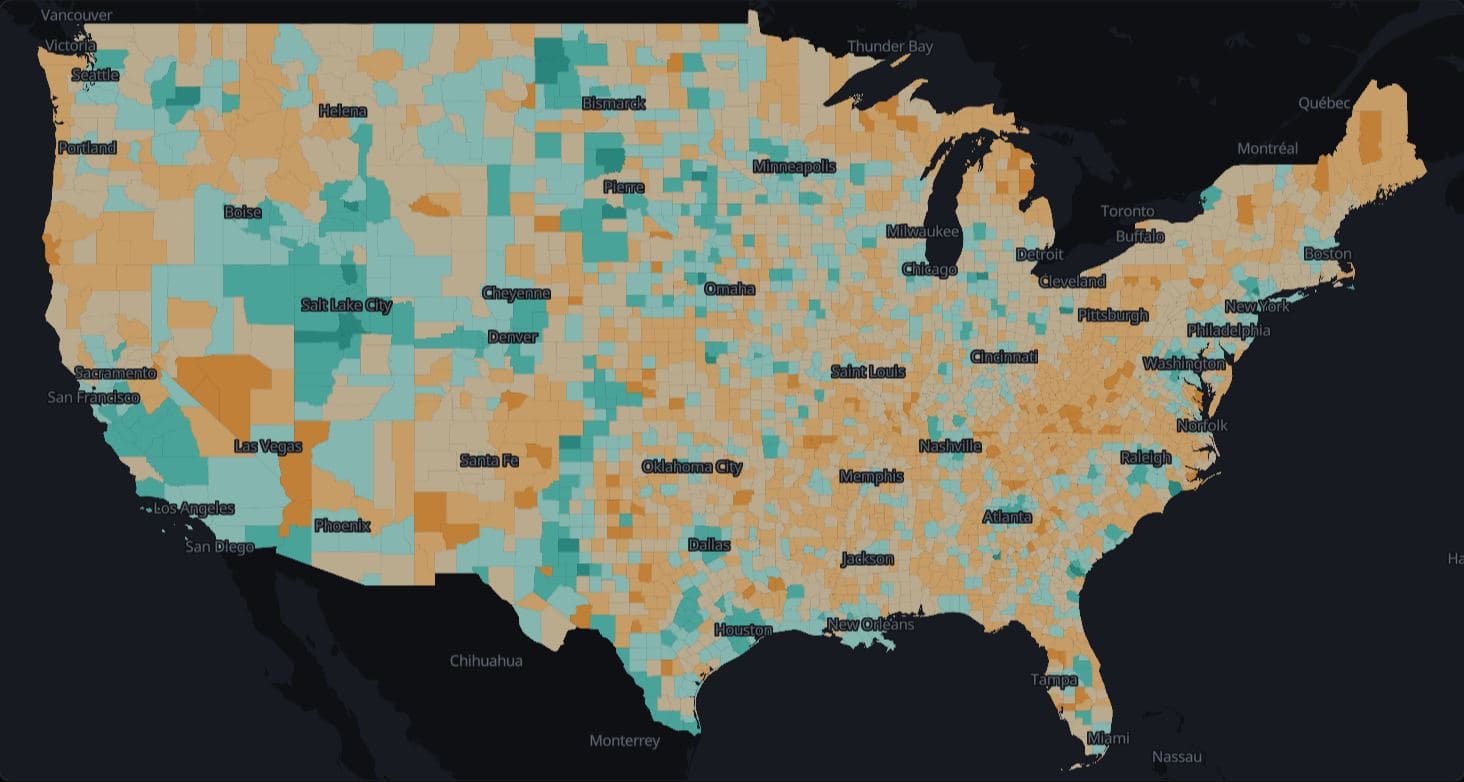
Births minus deaths by US county since 2020
Deaths outnumbered births from April 2020 to July 2025 in 2,222 of 3,144 US counties (70.7%), and those counties held 32.9% of the April 2020 population (Census Bureau Vintage 2025 estimates).
Hides: Migration, which offsets natural decrease in many of these counties, and how many people each county holds.
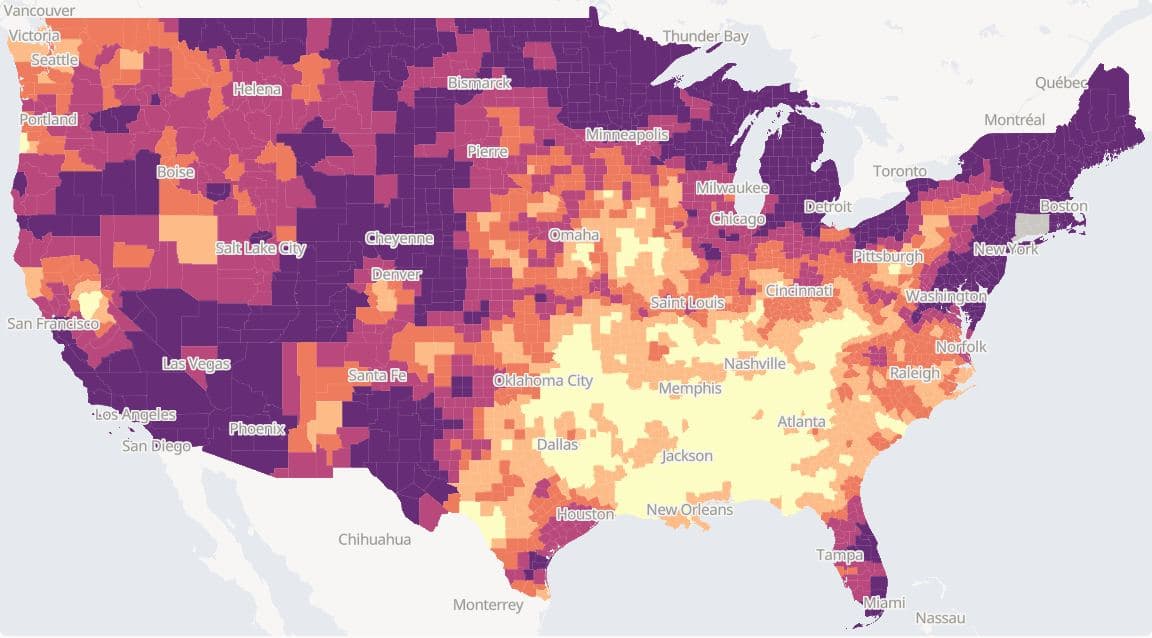
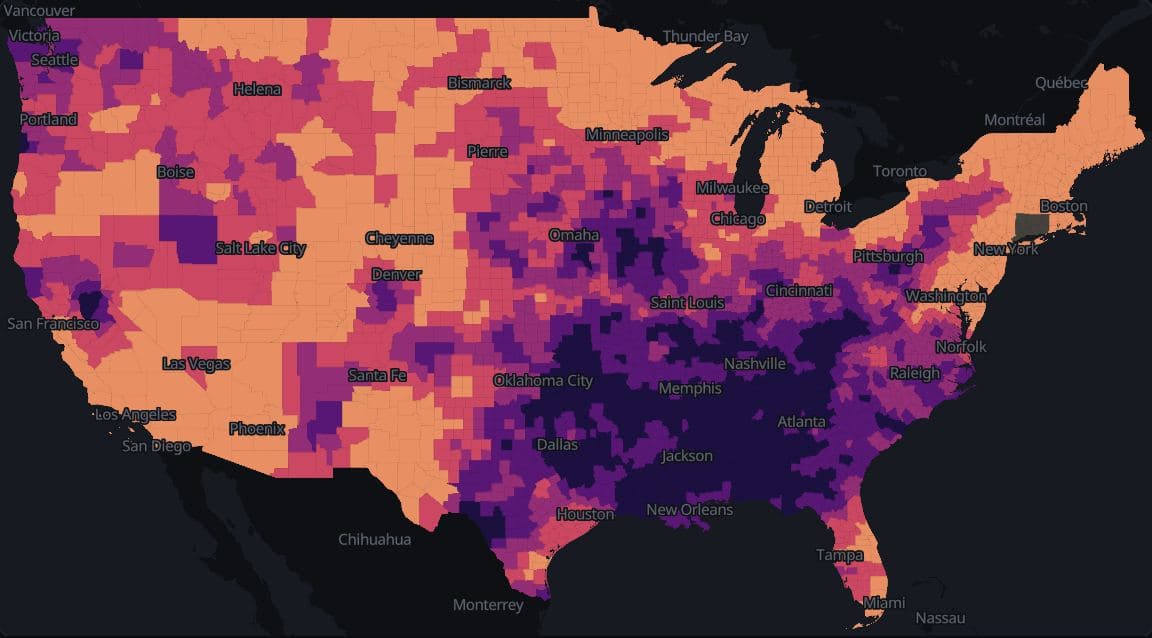
US counties · NOAA nClimDiv 1901-2025
Warming since 1901-1930 by US county
Mean annual temperature in 1996-2025 was above its 1901-1930 level in 3,098 of the 3,099 counties with a complete record, by 1.7°F at the median county, with state medians from +0.5°F in Alabama to +3.5°F in New Jersey (NOAA nClimDiv).
Hides: Year-to-year swings inside each 30-year window, and Connecticut, whose planning regions do not match NOAA's former counties.
Form
Panels, keys and circles change what the eye adds up.
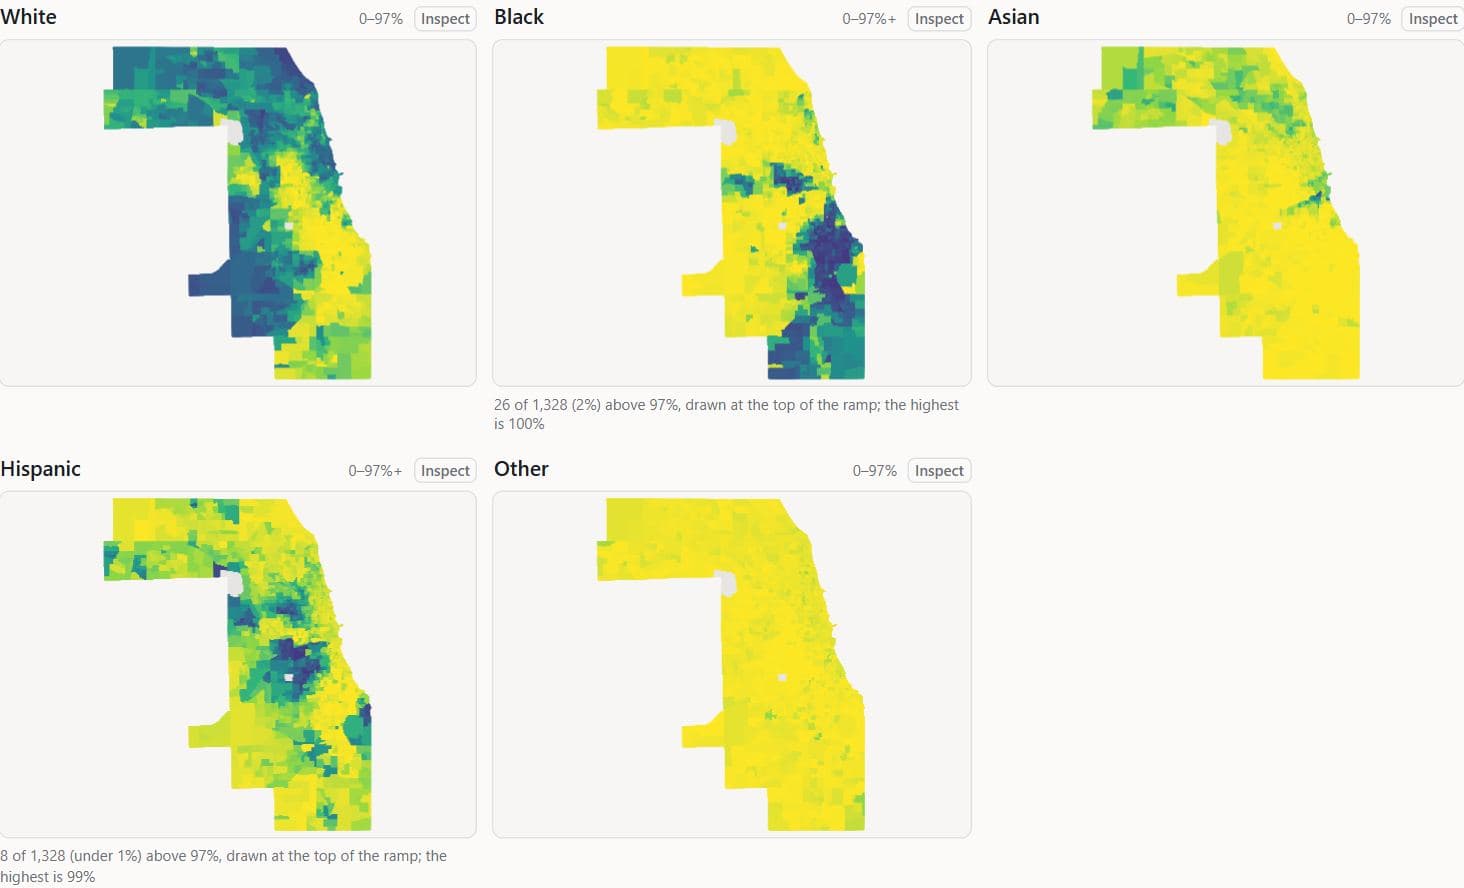
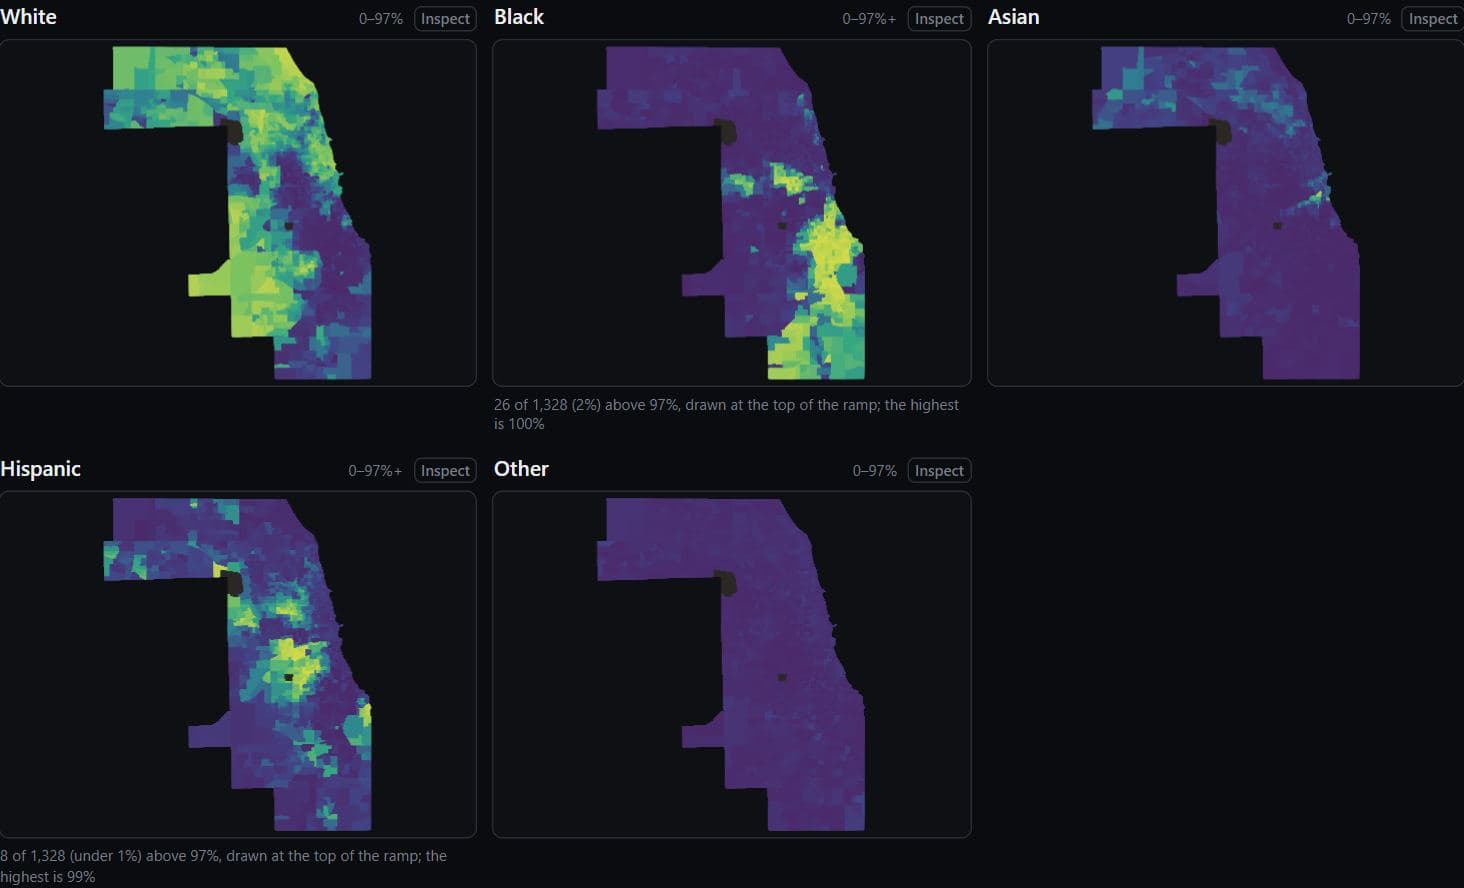
Chicago · ACS 2019-2023
Race and ethnicity in Cook County tracts
In Cook County, 73.2% of non-Hispanic Black residents and 73.0% of non-Hispanic white residents live in tracts where their own group is more than half of residents (ACS 2019-2023).
Hides: Each group's size: every panel shares one colour scale, so a small group's panel is pale almost everywhere.
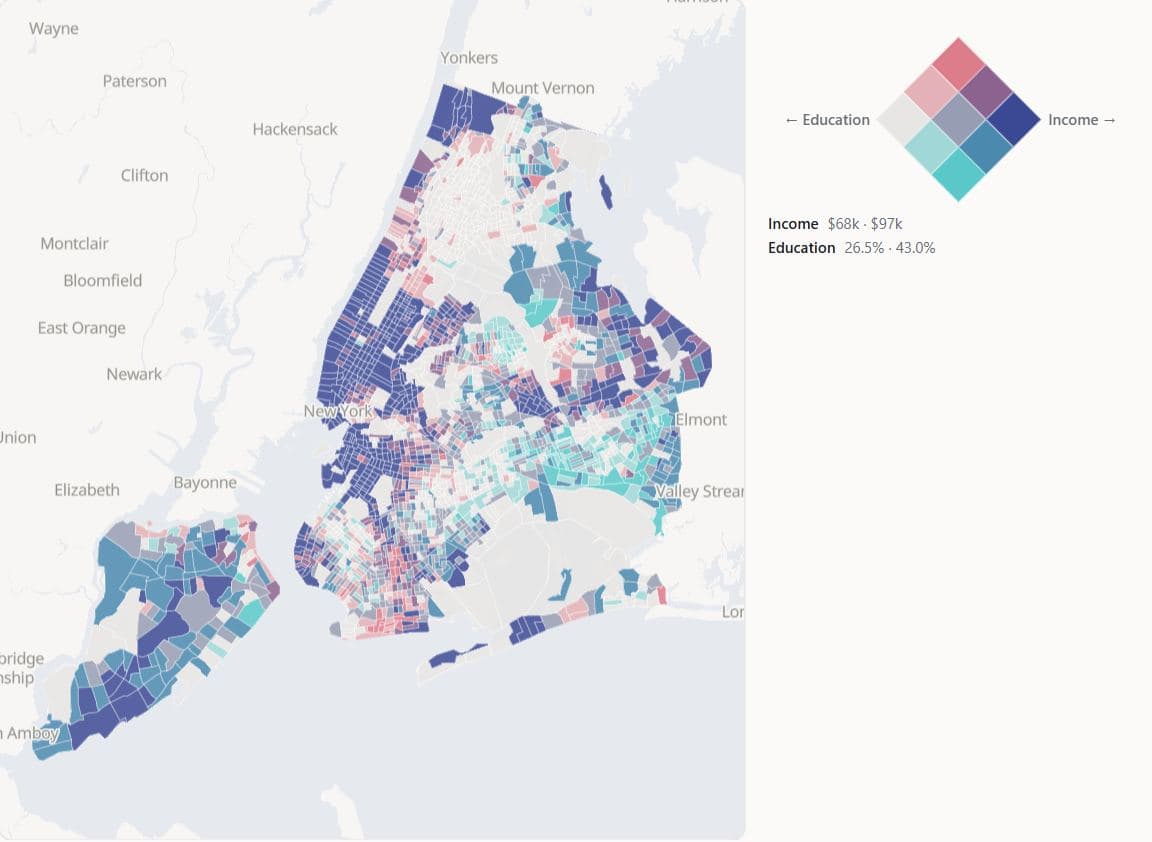
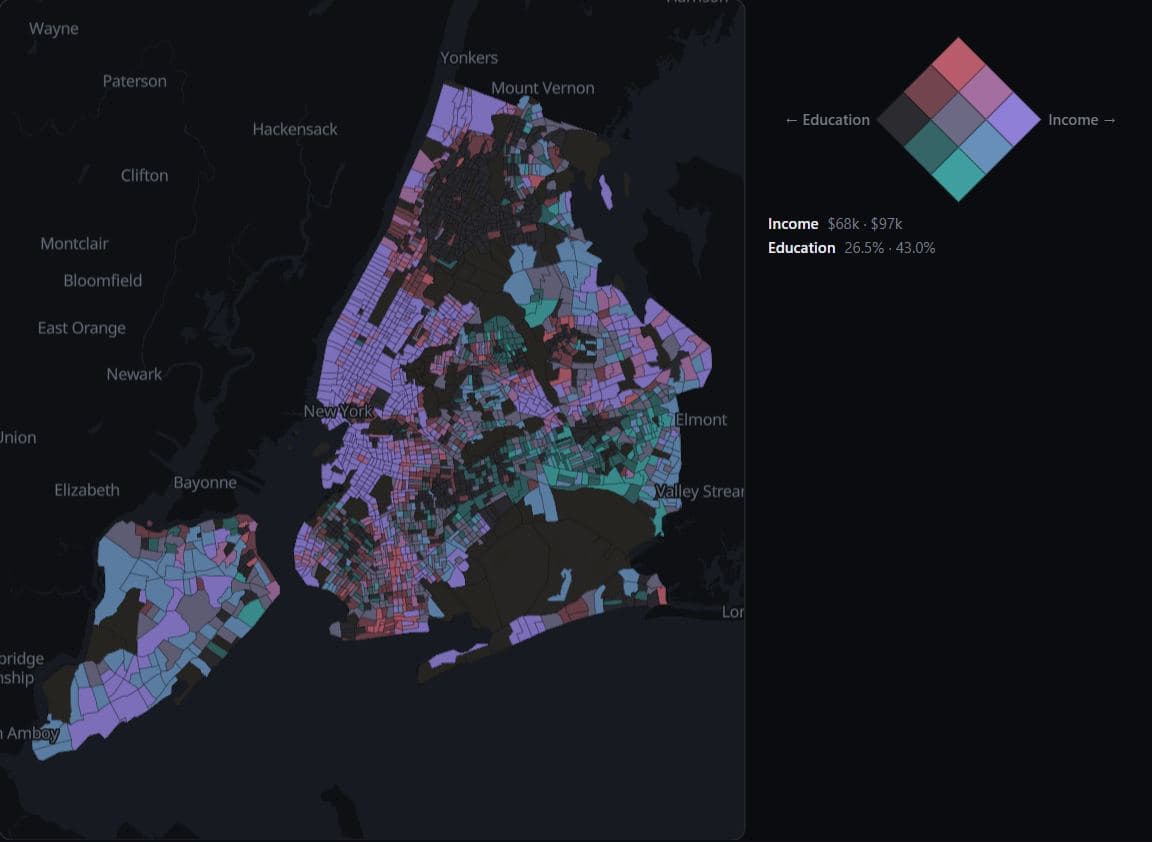
New York · ACS 2019-2023
Income and degree share on one key
Of 2,192 New York City tracts, 466 are in the lowest third on both median household income and bachelor's degree share and 482 in the highest third on both, while the two mixed corners hold 69 and 55 (ACS 2019-2023).
Hides: Where inside each third a tract falls: two tracts in one cell can be far apart on both measures.
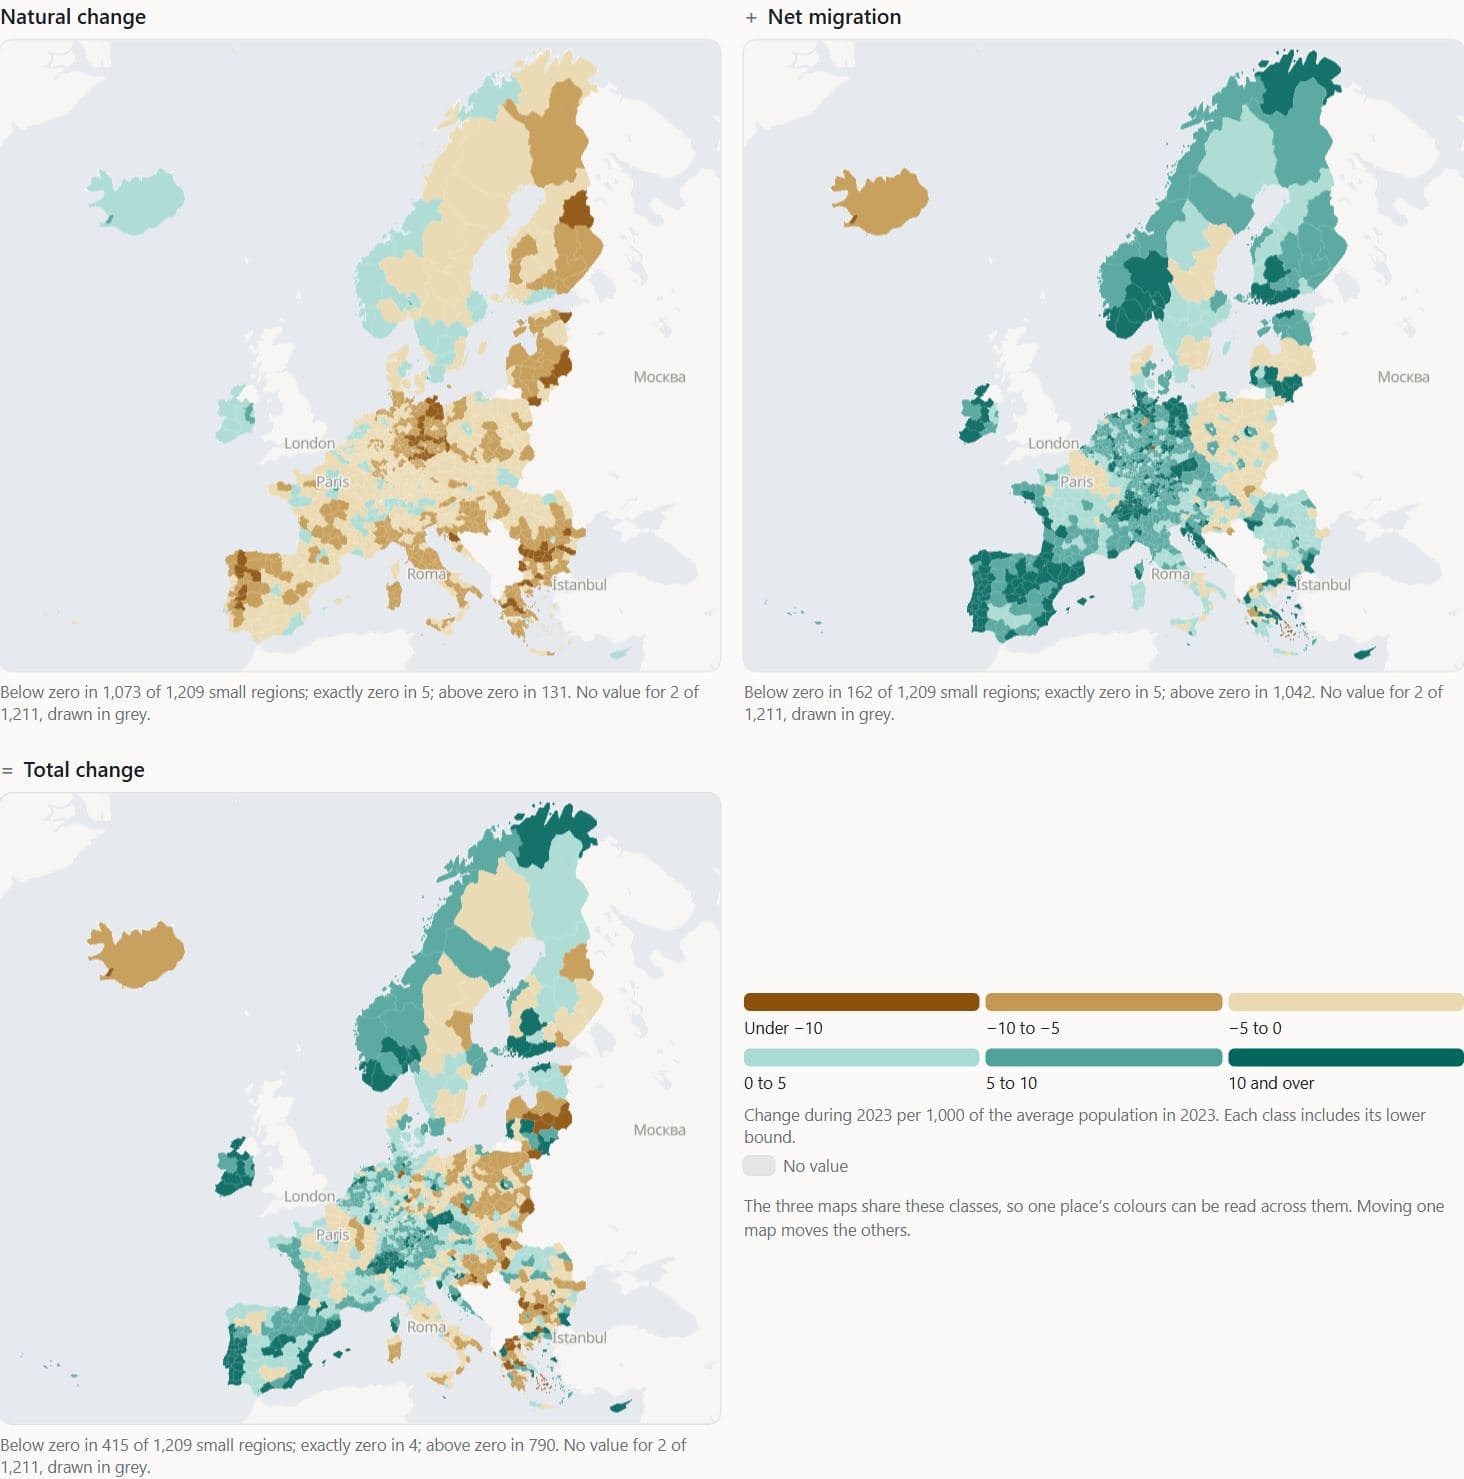
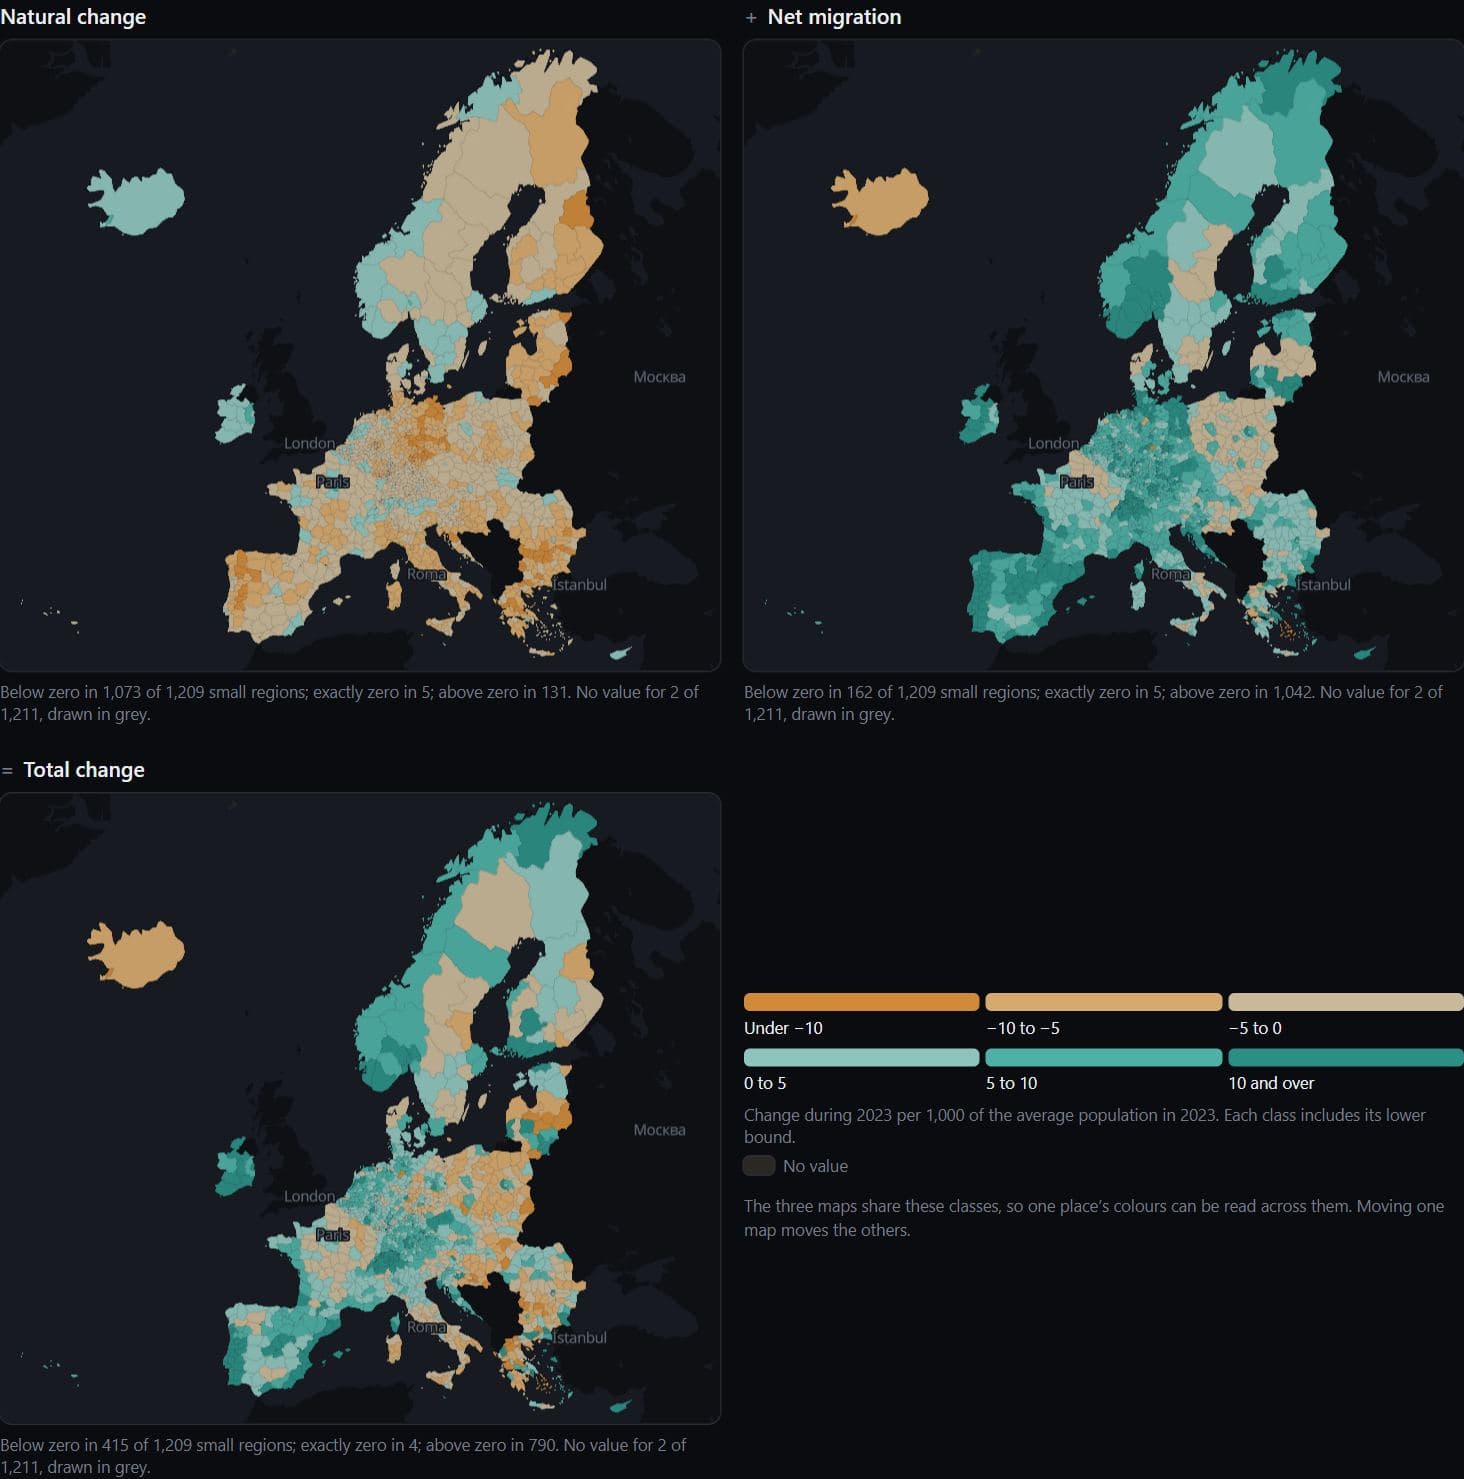
Europe · Eurostat demo_r_gind3 2023
Births, deaths and migration in European regions
Deaths exceeded births in 2023 in 1,073 of 1,209 European small regions (NUTS 3), and 667 of those grew anyway (Eurostat crude rates per 1,000).
Hides: Population size, and the statistical adjustment that Eurostat folds into net migration.
Read these pages in order, starting with Race and ethnicity in five maps
Projection and area
Area on a map is an encoding too, set by the projection or, in a cartogram, by the data.
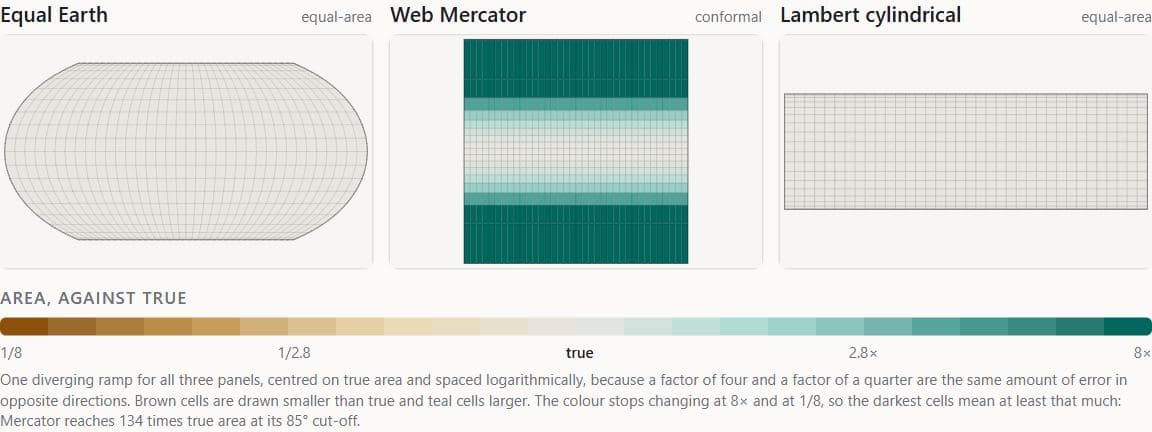
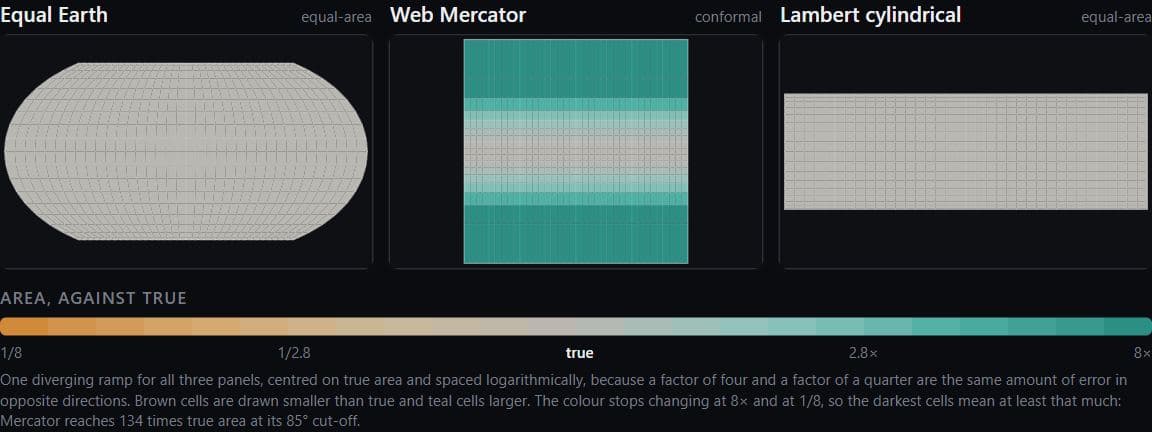
World · Web Mercator, Equal Earth and Lambert projection formulas
Area inflation under Web Mercator
Web Mercator draws ground at 60° latitude at 4.0 times the area of the same ground at the equator, and at 10.5 times at 72°, the latitude of central Greenland.
Hides: Shape: the equal-area projections keep area true by stretching shapes instead.
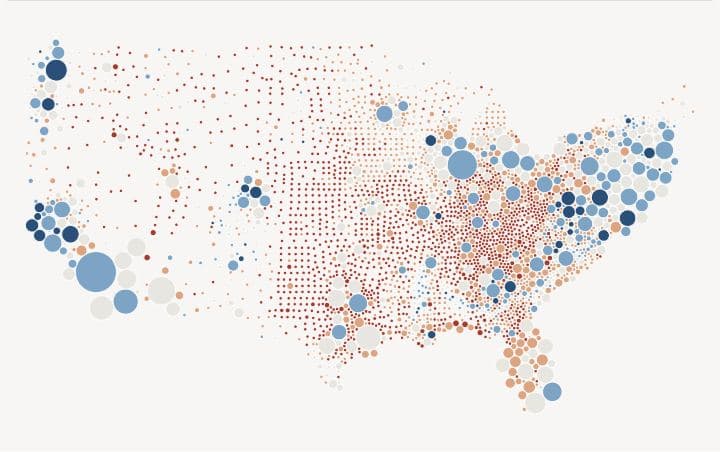
US counties · MIT Election Data and Science Lab 2020–2024
County votes as circles moved apart
Moving 1,450 of 3,108 lower-48 county circles, the furthest about 351 km, leaves no two overlapping, with each circle sized by 2020 votes cast.
Hides: Position and shape: a moved circle sits at no real location.
Read these pages in order, starting with Map projections and area
Where the data stops
Blank areas, boundary years, survey years and accounting rules are part of each finding.
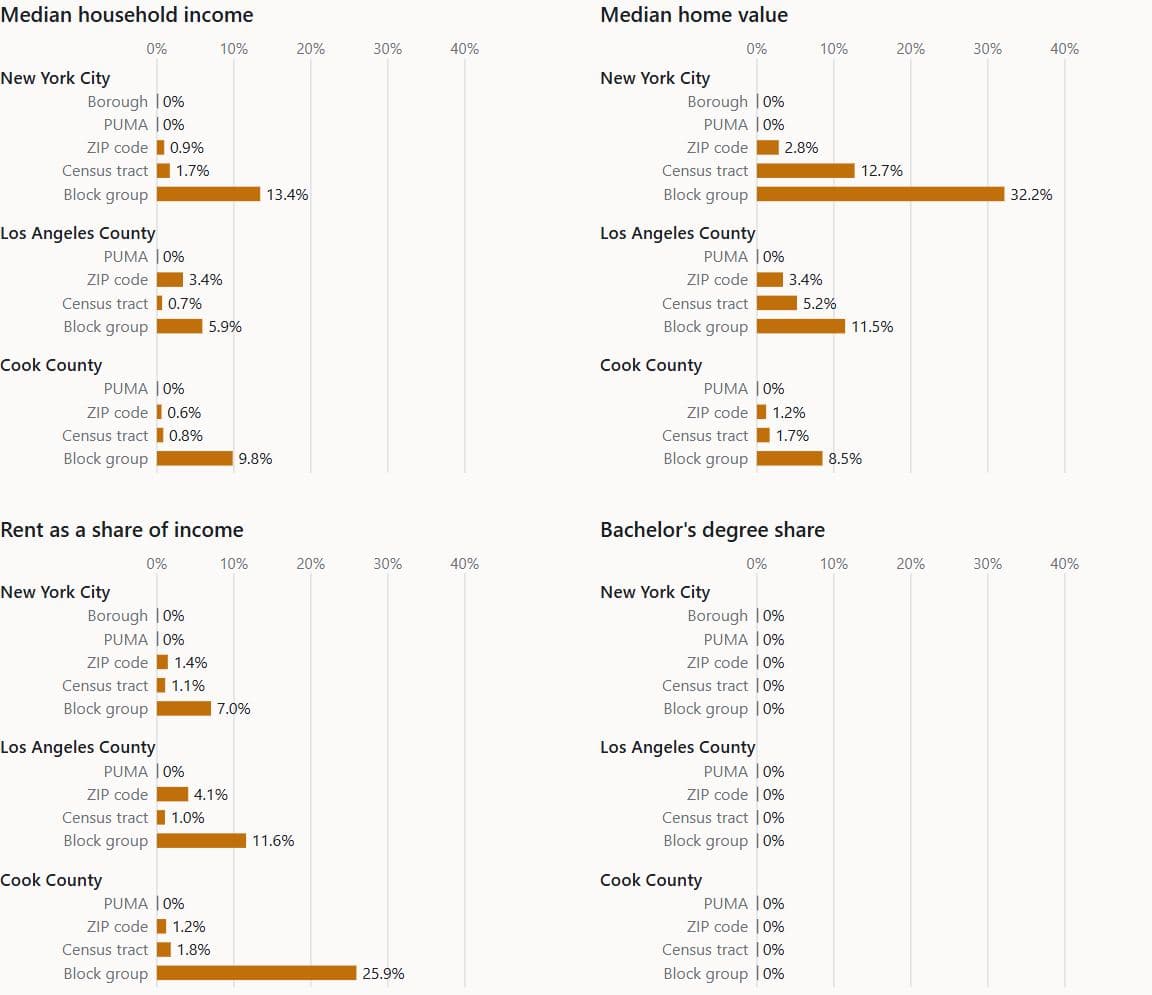
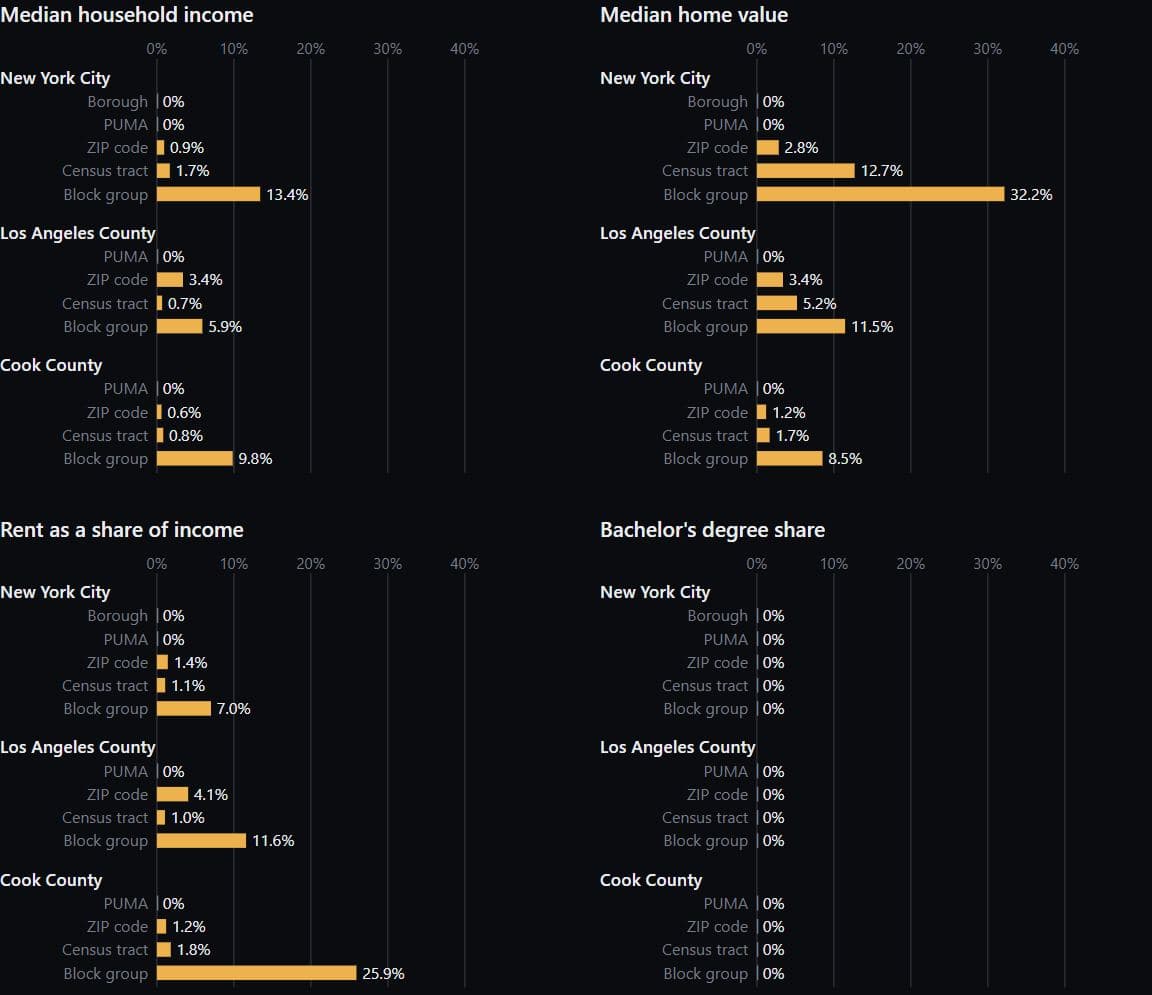
New York, Los Angeles, Chicago · ACS 2019-2023
Withheld estimates by level in three places
No PUMA estimate of median household income, home value, rent burden or bachelor's degree share is withheld in New York City, Los Angeles County or Cook County, while at block group the Census Bureau withholds home value for 32.2% of New York City block groups (2,188 of 6,804, counting block groups with no residents) and rent burden for 25.9% of Cook County's (1,037 of 4,001), ACS 2019-2023.
Hides: The margins of error on the estimates that were published.
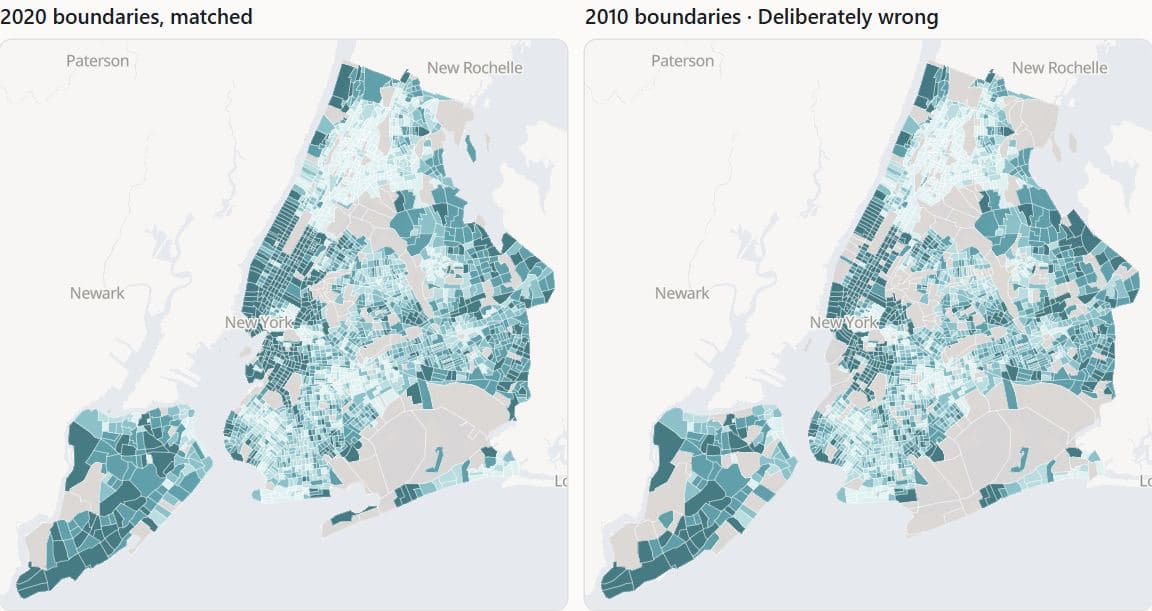
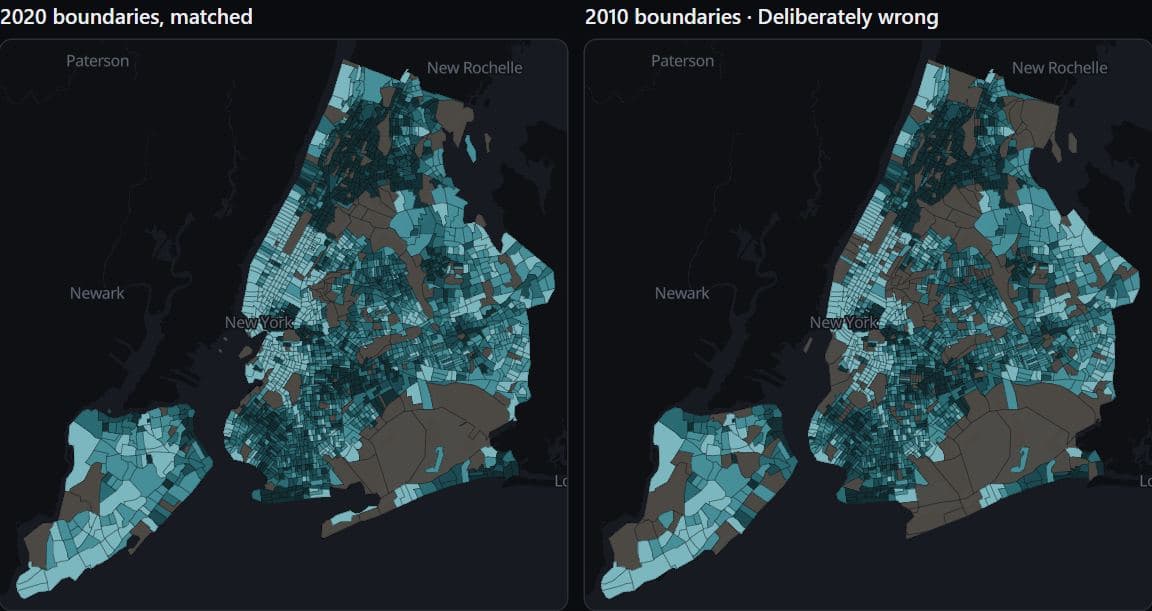
Deliberately wrongNew York · ACS 2019-2023, 2010 and 2020 tracts
New York incomes on 2010 tract boundaries
Joined to 2010 tract boundaries, the ACS 2019-2023 income estimates leave 134 of 2,167 New York City tracts unmatched, and they are drawn in the same grey as the 132 of 2,324 tracts with no estimate on the correct 2020 map.
Hides: Any warning: the mismatched map fills every tract it can join and raises no error.
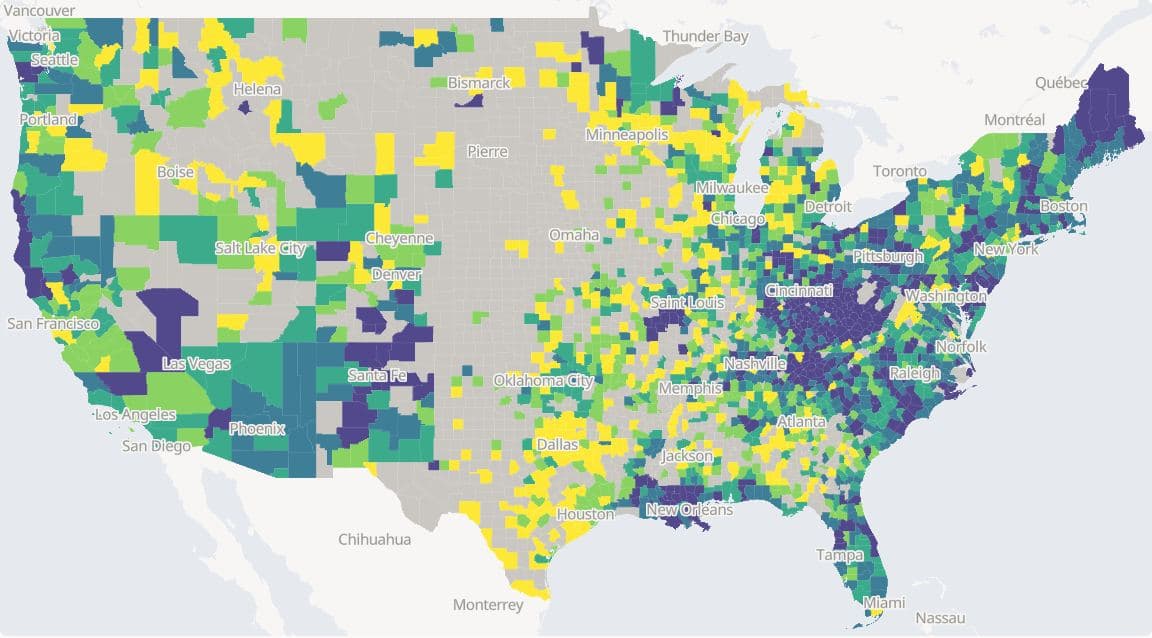
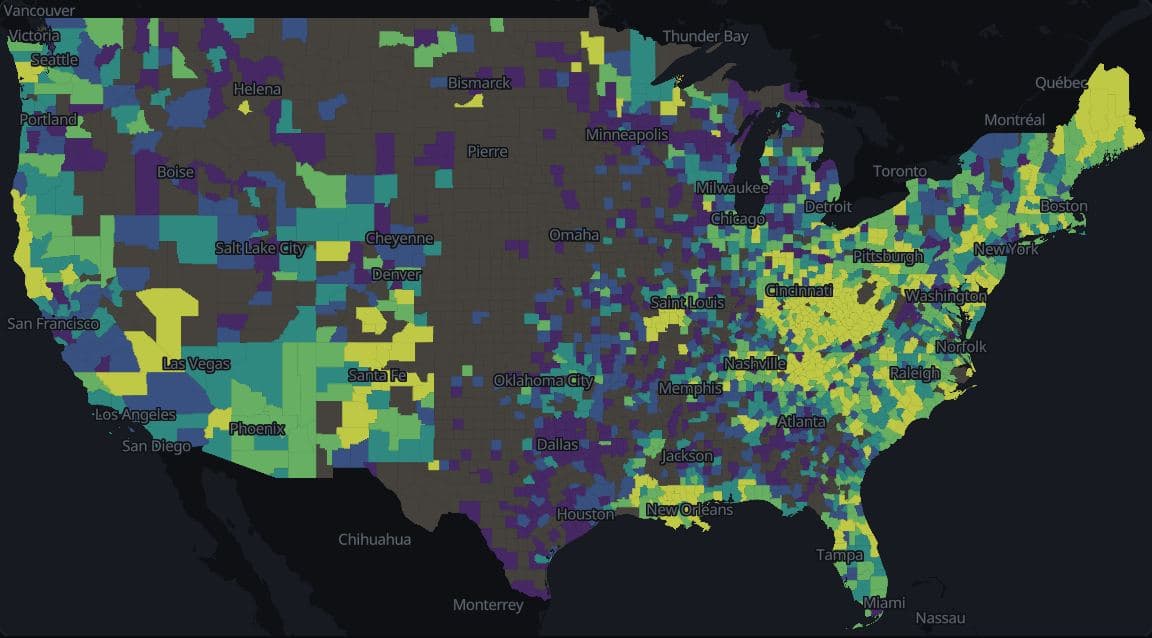
US counties · County Health Rankings 2025
Drug overdose deaths by US county
County Health Rankings 2025 publishes a 2020-2022 drug overdose death rate for 2,010 of 3,144 US counties and leaves 1,134 counties blank, 1,132 of them for having fewer than 10 deaths; the blank counties hold 3.4% of residents (ACS 2019-2023 population).
Hides: Deaths in the blank counties, which are unpublished and not zero.
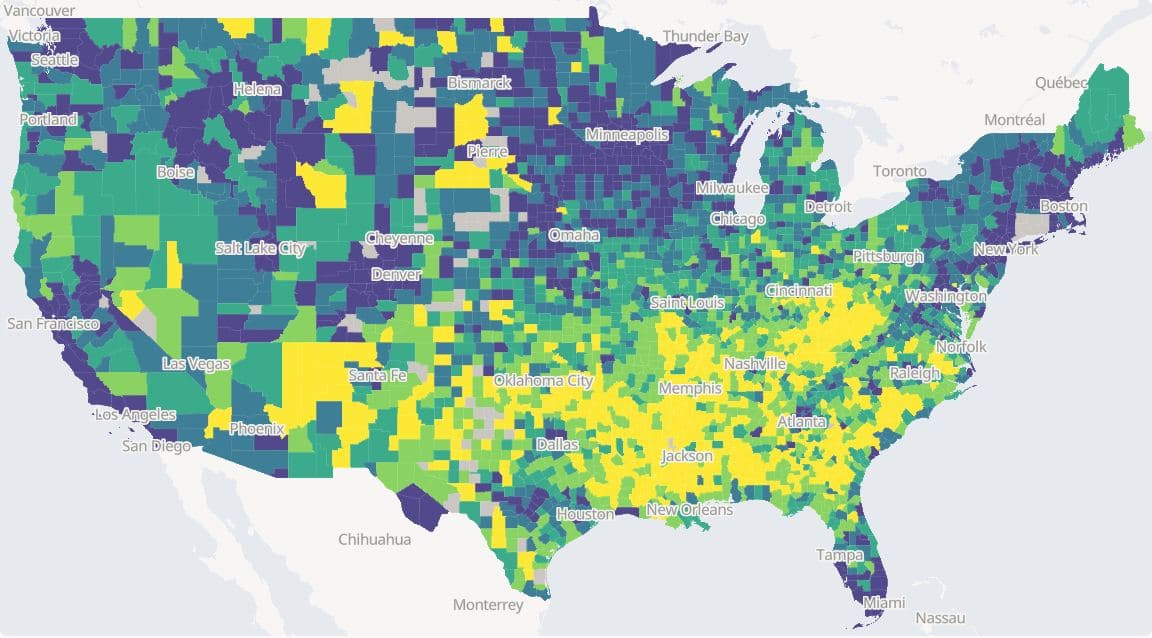
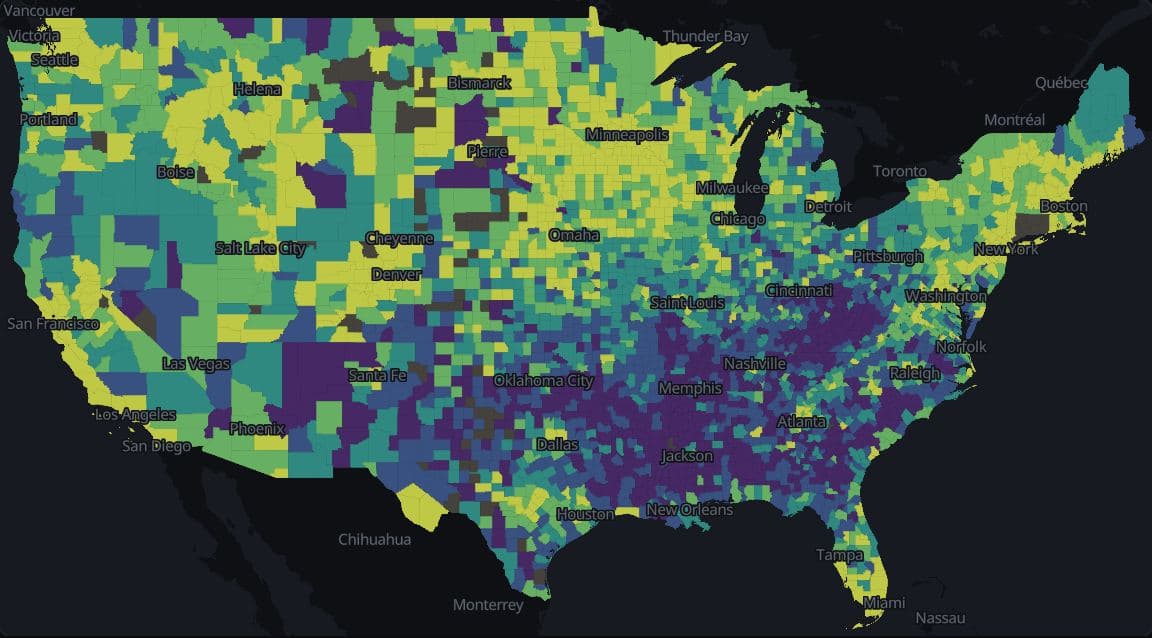
US counties · County Health Rankings 2025
Life expectancy by US county, with intervals
Life expectancy for 2020-2022 runs from 54.0 years in Buffalo County, SD, to 94.2 years in Pitkin County, CO, across 3,060 US counties, and its 95% interval is 2.2 years wide at the median county and 38.5 years in Denali Borough, AK (County Health Rankings 2025).
Hides: The interval behind each colour, which the map does not draw; hovering a county shows it.
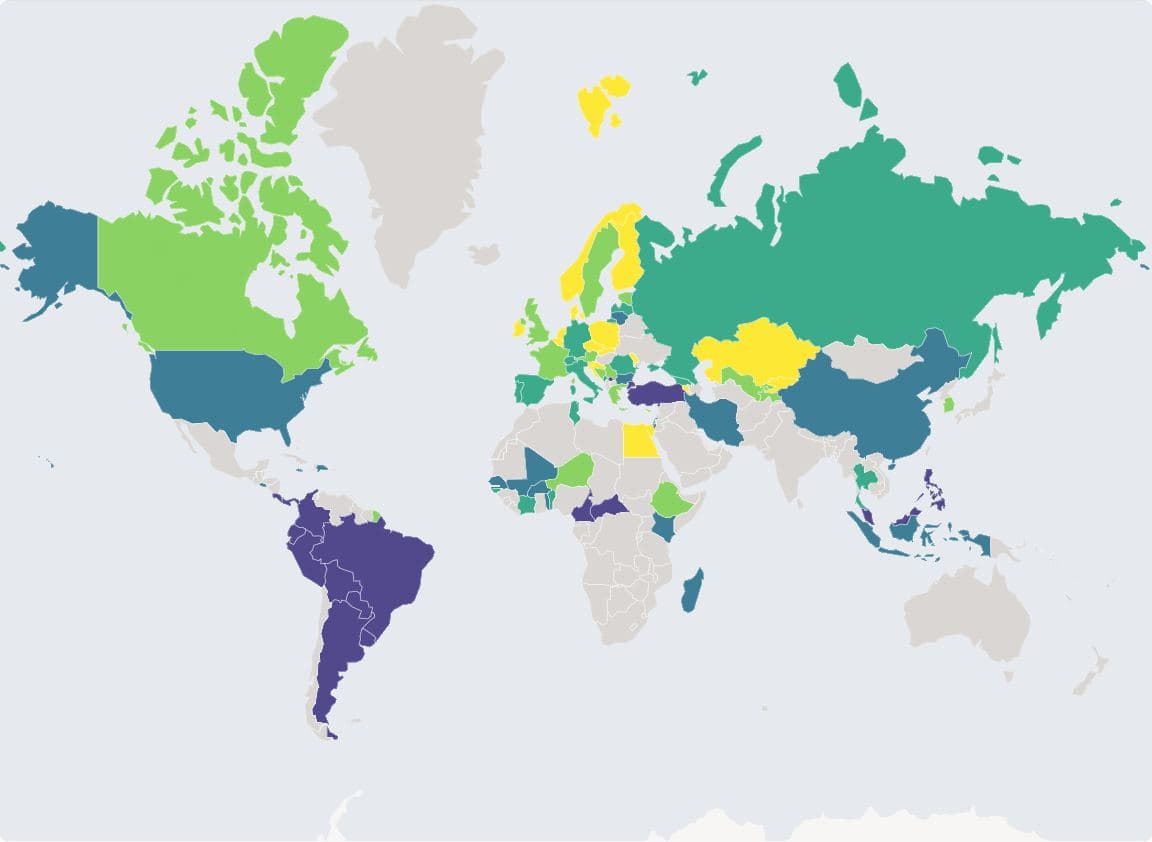
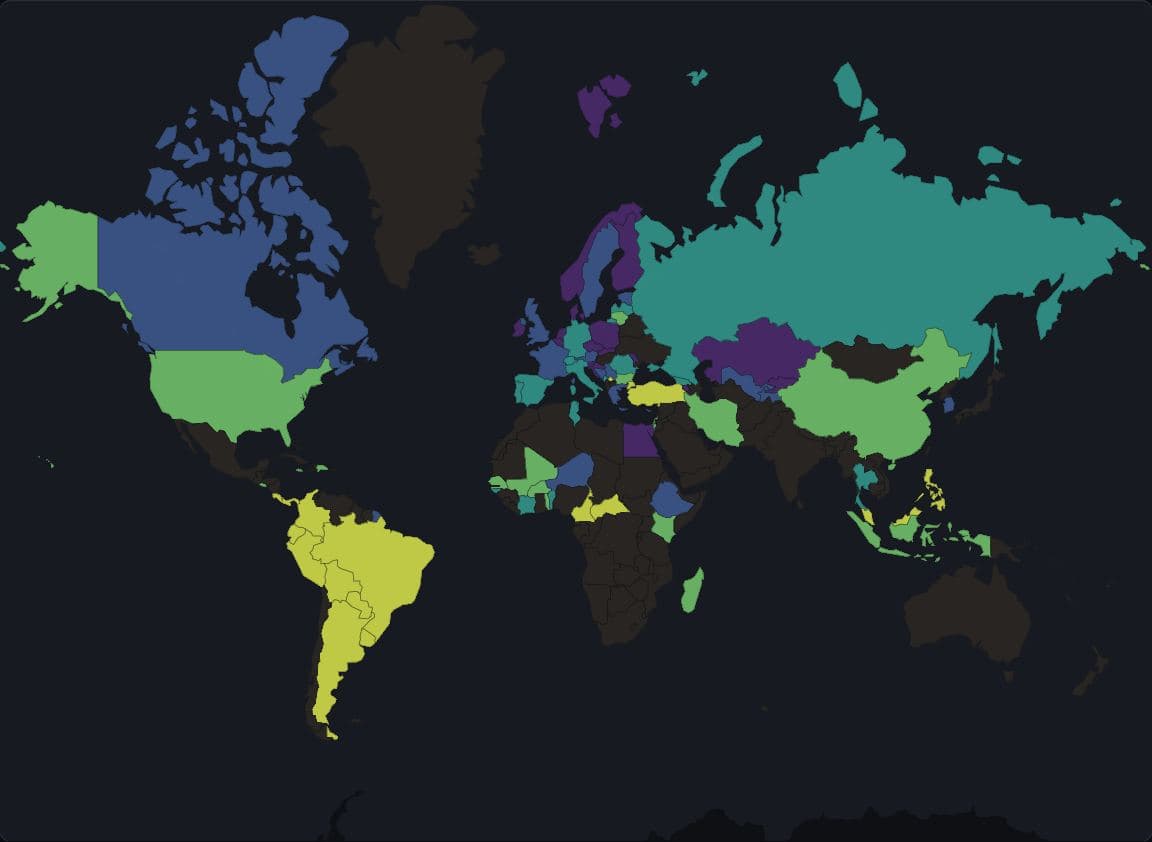
World · World Bank WDI 2021
Income inequality by country, 2021
The World Bank publishes a 2021 Gini index for 79 of the 176 countries drawn, and the other 97 are blank on this map.
Hides: Inequality where no survey fell in 2021, although many of those countries surveyed in another year.
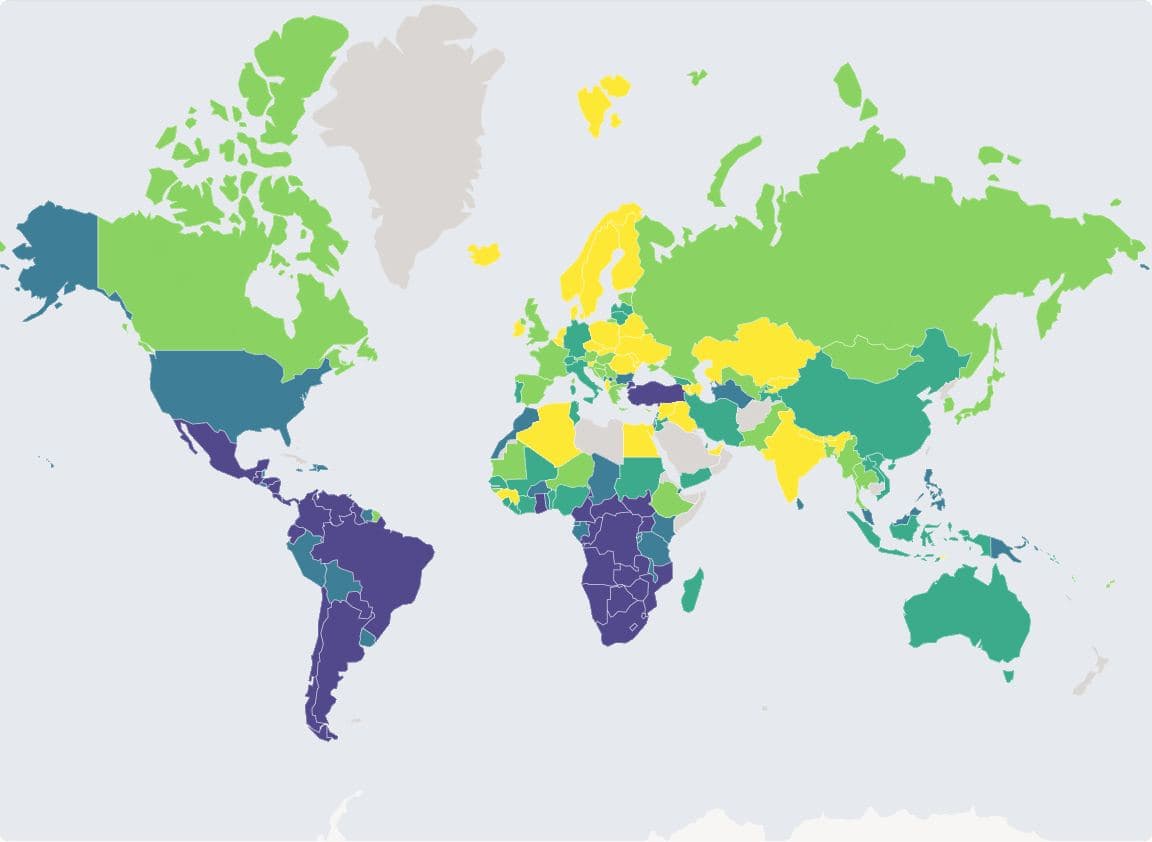
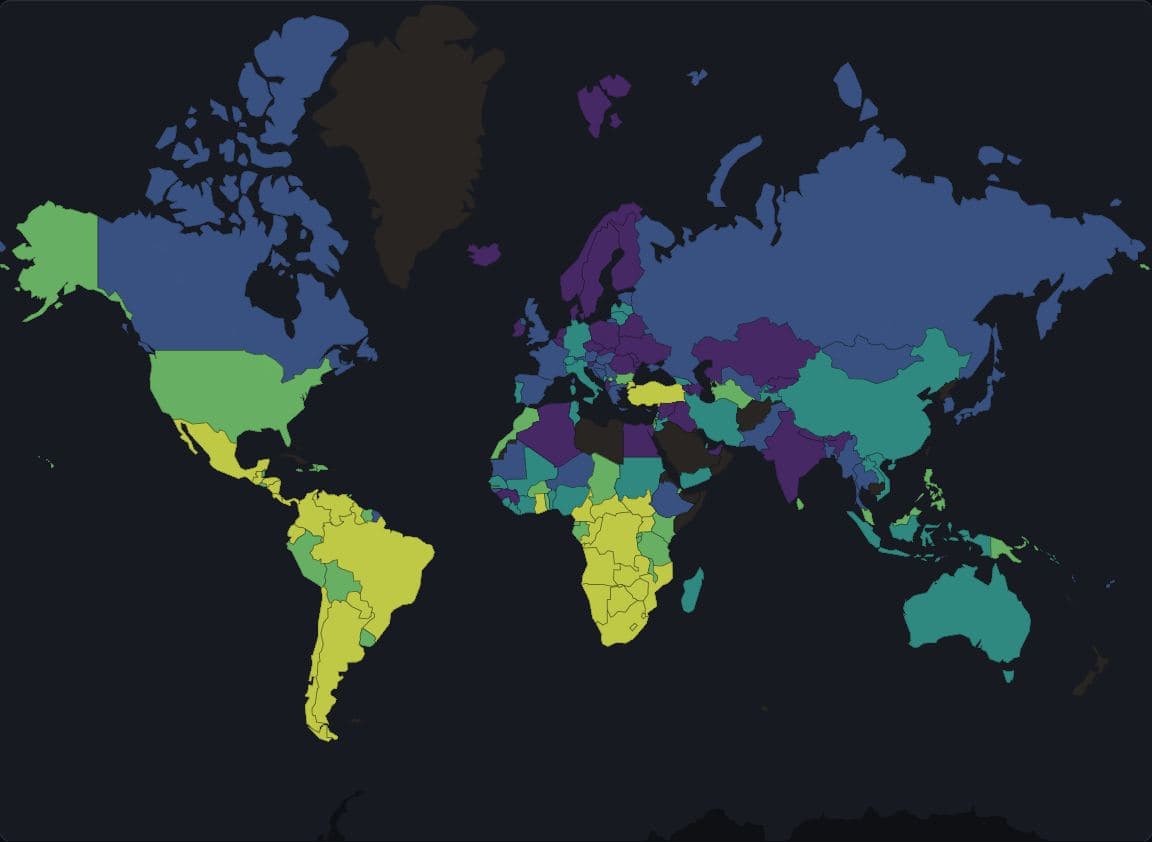
World · World Bank WDI, latest survey 1992-2025
Income inequality from each country's latest survey
Using each country's latest survey fills the Gini map for 154 of 176 countries, but those surveys run from 1992 to 2025 and 43 of them predate 2020.
Hides: The survey year: two countries of the same colour can be decades apart.
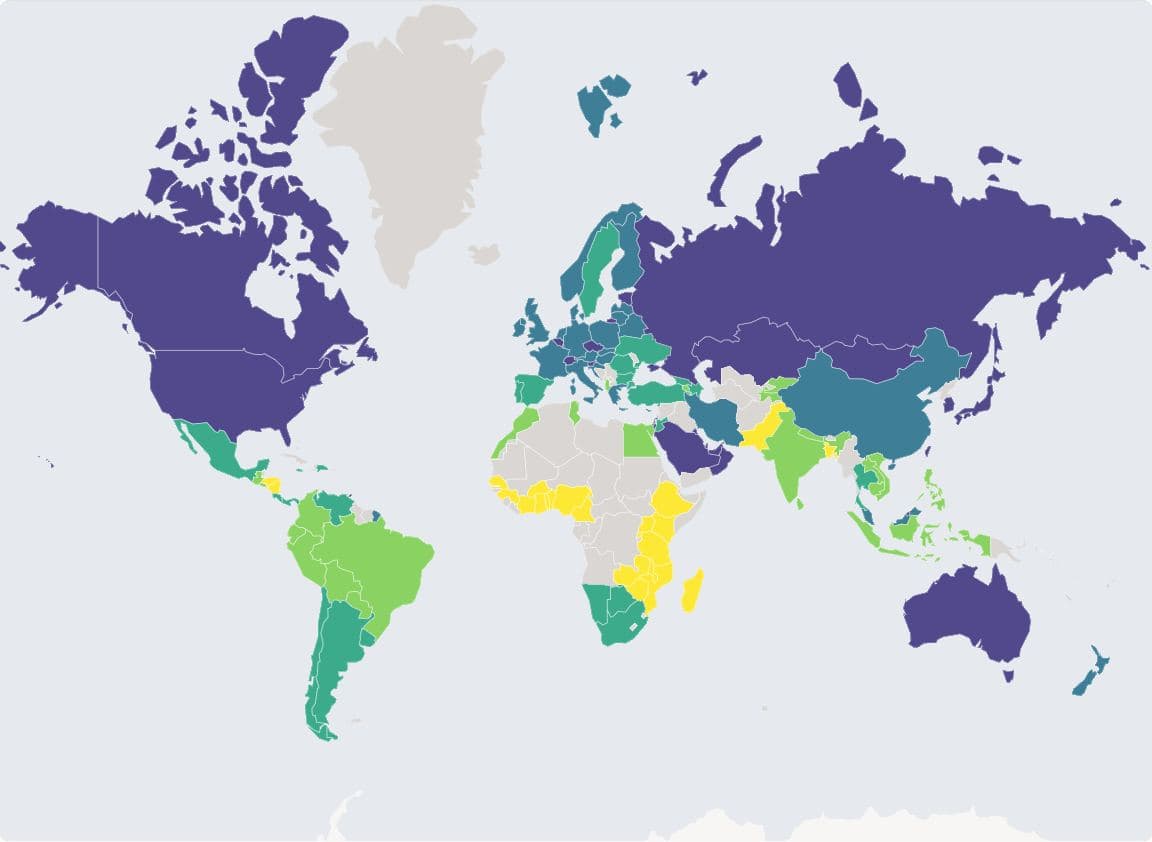
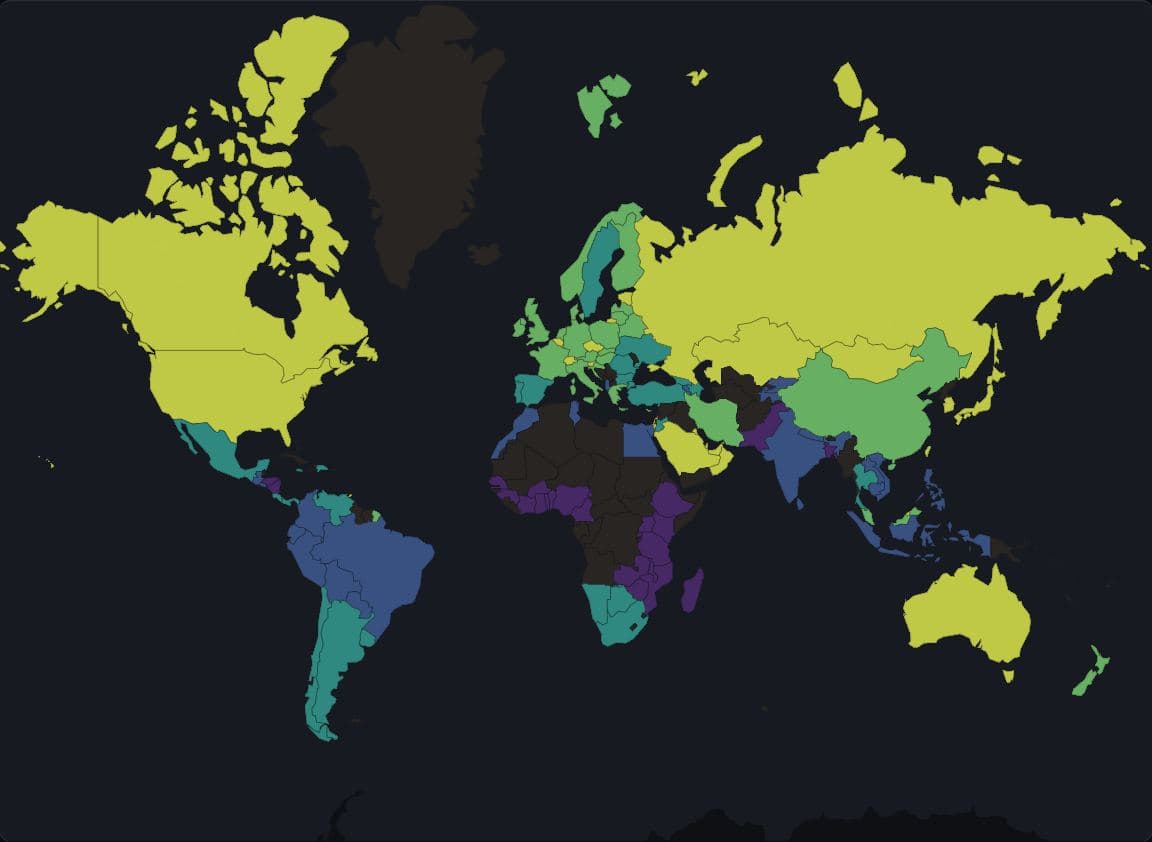
World · Global Carbon Budget 2025, 2023 data
CO2 per person, counted where goods are consumed
Switzerland emitted 3.6 tonnes of CO2 per person on its territory in 2023 and 13.3 tonnes counted by consumption, and 90 of 115 countries with both figures have higher consumption-based than territorial emissions (Global Carbon Budget).
Hides: Territorial emissions from the same release, and countries without a consumption-based account.
Every map by place
- New York
- ResolutionCorrelation by levelClassificationTwo class rules side by sideColourRace and ethnicity in five mapsTwo measures on one mapWithheld estimatesBoundaries from the wrong decade
- Los Angeles
- ResolutionCorrelation by levelClassificationTwo class rules side by sideColourRace and ethnicity in five mapsTwo measures on one mapWithheld estimates
- Chicago
- ResolutionCorrelation by levelClassificationTwo class rules side by sideColourRace and ethnicity in five mapsTwo measures on one mapWithheld estimates
Appendix
Data sources
US Census Bureau American Community Survey 2019 to 2023 (5-year) and Population Estimates Vintage 2025; county presidential returns from the MIT Election Data and Science Lab and from Algara and Amlani; County Health Rankings and Roadmaps 2025; NOAA nClimDiv county temperatures; Eurostat regional statistics on GISCO NUTS 2024 boundaries; World Bank indicators, Global Carbon Budget emissions via Our World in Data, and Natural Earth country boundaries. Basemaps are OpenFreeMap tiles of OpenStreetMap data, © OpenStreetMap contributors. The sources page lists each dataset with its years, boundary vintage and licence.
Methods
Each thumbnail was captured from the live page with a headless browser on 29 September 2026, in the light and the dark theme. A count in a caption is a count of areas (counties, tracts or regions), not of people, unless the caption says otherwise. Survey estimates carry the margins of error their publishers report, which the maps do not yet draw. A blank area is a value that was not published or did not join, never a zero.
How to cite
@misc{huggins2026ctzngeo,
  author = {Huggins, Uma and Singh, Vishal},
  title  = {Five choices behind a data map},
  year   = {2026},
  url    = {https://www.ctzn.pub/apps/geo},
  note   = {ctzn-geo, accessed 2026-09-29}
}