GSS Wording Experiments
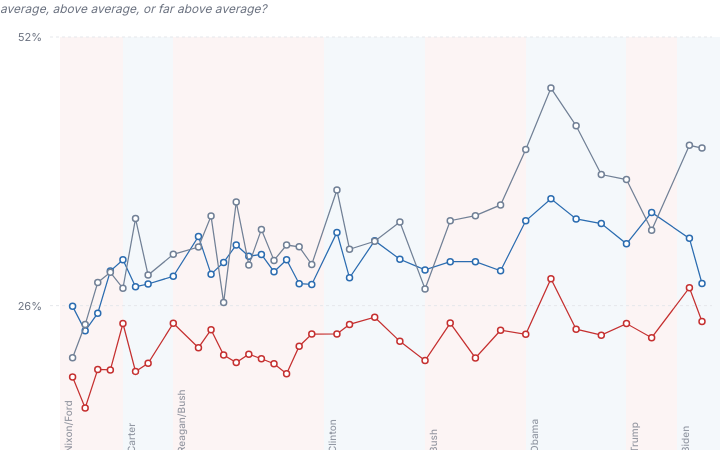
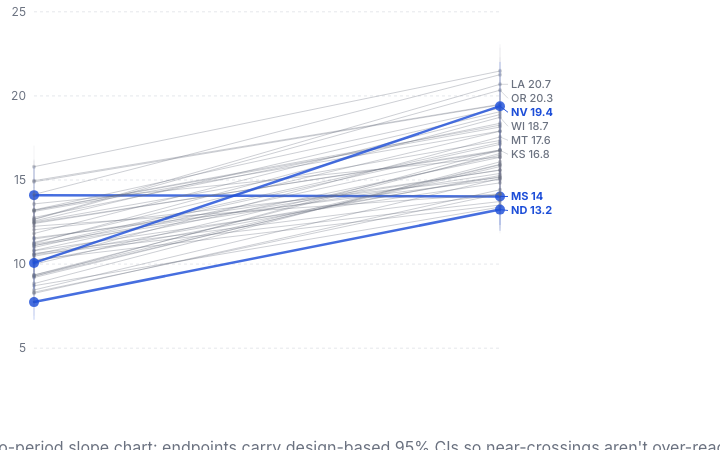
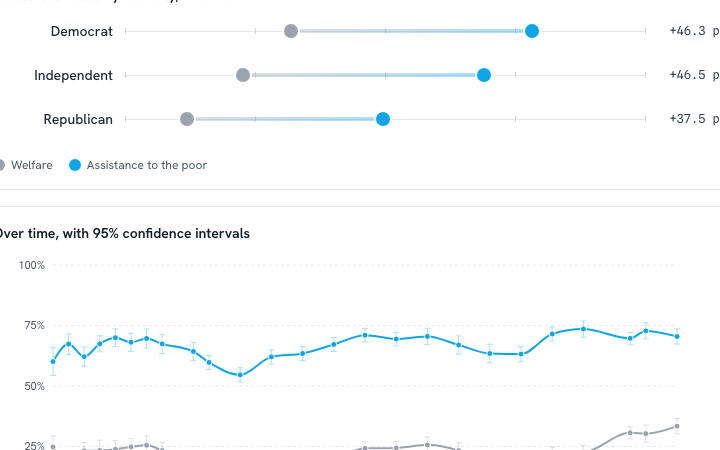
+2A two-panel composite for visualizing GSS split-ballot wording experiments. The top panel shows pooled-across-years estimates by a moderator (party, race, age) as a paired-dot "dumbbell" plot — one dot per wording, connected by a gap label in percentage points. The bottom panel is the 1984–2024 time-trend with both wordings overlaid and design-adjusted 95% CIs. Built around the canonical "natfare" (welfare) vs "natfarey" (assistance to the poor) experiment, but the data shape generalizes to any GSS NAT___ / NAT___Y pair.
gsssurveywording-experiment